MRD:01365309EXO
Exercise 1: H + H2 system
Dynamics from the transition state region
[1].On a potential energy surface diagram, how is the transition state mathematically defined? How can the transition state be identified, and how can it be distinguished from a local minimum of the potential energy surface?
Answer: The transition state is the saddle point of the potential energy surface, where the derivatives in orthogonal directions are all zero. It is the local minimum of the potential energy surface and also a local maximum on the minimum energy path linking reactants and the products. Thus, it is mathematically defined as ∂V(ri)/∂ri=0 and SD<0, where SD is the saddle point calculation of SD=Vr1r1(rx,ry)Vr2r2(rx,ry)-V2r1r2(rx,ry).
The transition state can be identified by finding the maximum point on the energy path as going along the minimum energy trajectory . It can also be observed to be an intersection point of a straight line with slope=1 and the energy path on the contour plot, where the distance of AB and BC is the same (i.e. the distances between three H atoms are all the same).
Good, is the maximum/ local minimum less than zero also? Mys18 (talk) 00:31, 9 June 2019 (BST)
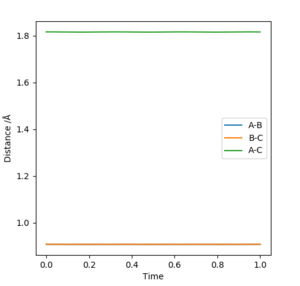
[2].Report your best estimate of the transition state position (rts) and explain your reasoning illustrating it with a “Internuclear Distances vs Time” plot for a relevant trajectory.
Answer: The best estimate of the transition state position (rts) is 0.9077 ≈ 0.908 Å.The plot on the right shows that the distances of AB and BC are unchanged during the time change and AC distance is also constant during the time change as the sum of BC and AB distances.
Okay. Mys18 (talk) 00:31, 9 June 2019 (BST)
[3].Comment on how the mep and the trajectory you just calculated differ.
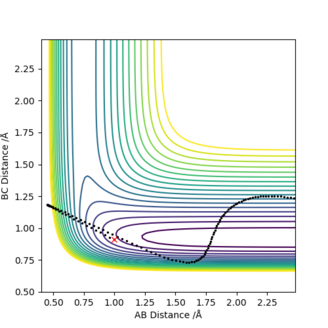
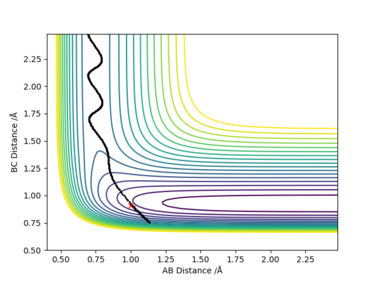
Answer: r1 is now 0.9175 Å and r2 is still 0.9075 Å. The MEP type shows a smooth increase in the potential energy trajectory without any oscillations observable. While in the dynamic type, oscillations along the potential energy trajectory is observed. This is because that MEP calculation is a special trajectory which gives infinitely slow motion with minimum energy path and then it will just smoothly go along the potential energy trajectory. whereas dynamic trajectory does not always stay at the potential energy minima and gives oscillations.
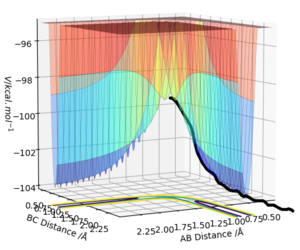

Sure, it is a special trajectory, but why do we see infinitely slow motion? Mys18 (talk) 00:31, 9 June 2019 (BST)
[4].Setup a calculation where the initial positions correspond to the final positions of the trajectory you calculated above, the same final momenta values but with their signs reversed.What do you observe?.


Reactive and unreactive trajectories
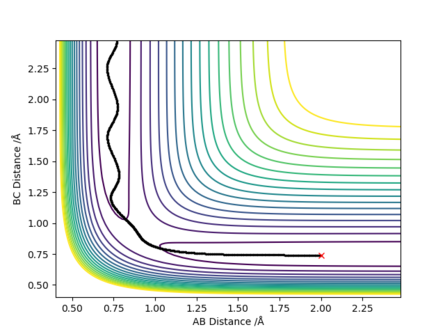
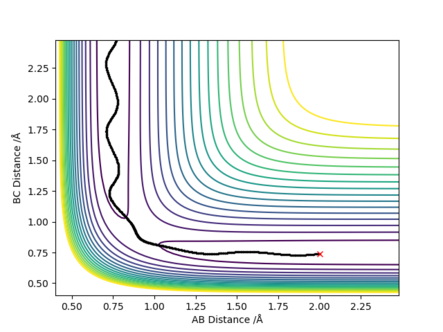
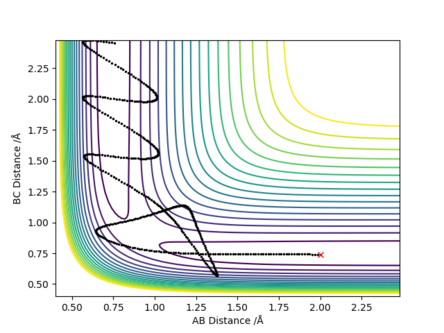
[5].Complete the table above by adding the total energy, whether the trajectory is reactive or unreactive, and provide a plot of the trajectory and a small description for what happens along the trajectory. What can you conclude from the table?
Answer: The reactant needs to have enough kinetic energy to pass the transition state barrier. Higher momenta does not always give the reactive trajectory,.If the initial momenta is too high, the products formed would go back to reform the reactant as it has enough kinetic energy to overcome the activation energy (i.e. energy barrier) again to go through the transition state.
[6].State what are the main assumptions of Transition State Theory. Given the results you have obtained, how will Transition State Theory predictions for reaction rate values compare with experimental values?
Answer: The theory explains the rate of elementary chemical reactions and assumes a typical type of chemical equilibrium between reactants and activated transition state complexes. Assumptions made is listed below[1]:
(1) When apply the transition state theory to the potential energy surfaces, quantum-tunneling effects are assumed to be negligible.
(2) Born-Oppenheimer approximation which that he motion of atomic nuclei and electrons in a molecule can be separated.
(3) The atoms included in the reactant state should have Boltzmann distributed energies. This should be satisfied if the system has had enough time to the thermal equilibrium.
(4) When the system achieves the transition state, with a velocity towards the product configuration, it will not reenter the initial state region again.
The theory predicted well for the criteria 1-3, where the experimental rate matches well to the theory. The reactant just passes through the transition state once and the products do not go back or the reactant has no enough energy to pass the barrier to form product.
For the criteria 4 and 5, the rate of reaction is predicted to be than the experiment value as he reaction is assumed to be only forward reaction (i.e. no reverse reaction) based on this theory. Since they include barrier-recrossing and reformation of reactants, which is not allowed in the theory.
Explanation needs more detail... For reaction 4, it does infact have enough energy to go over the energy barrier, yet it is correct saying not reactive...Maybe assumption 4 you have written will help you to understand this. Mys18 (talk) 00:34, 9 June 2019 (BST)
EXERCISE 2: F - H - H system
PES inspection
[7].By inspecting the potential energy surfaces, classify the F + H2 and H + HF reactions according to their energetics (endothermic or exothermic). How does this relate to the bond strength of the chemical species involved?
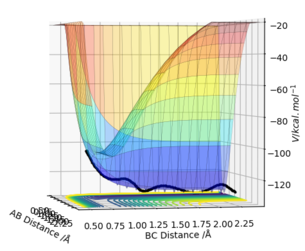
Answer:
F + H2 (A=F, B=C=H):
rAB=1.00 Å, rBC=0.74 Å, pAB=0 and pBC=-1.5.
Etot=-100.9 kcal/mol-1, it is a reactive reaction by looking through the surface plot.
This shows an exothermic reaction where the trajectory moves from higher potential energy reactant to lower potential energy along the potential energy surface. The energy gain from new forming H-F bond is greater than the energy put in breaking original H-H bond, thus gives an exothermic reaction.
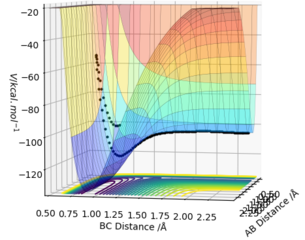
H + HF (A=B=H, C=F):
rAB=0,74 Å, rBC=0.91 Å, pAB=0 and pBC=-10.
Etot=-48.3 kcal/mol-1, it is a reactive reaction by looking through the surface plot.
This shows an endothermic reaction where the trajectory moves from lower potential energy reactant to higher potential energy along the potential energy surface. The energy gain from new forming H-H bond is smaller than the energy put in breaking original H-H bond, thus gives an endothermic reaction.
[8].Locate the approximate position of the transition state.
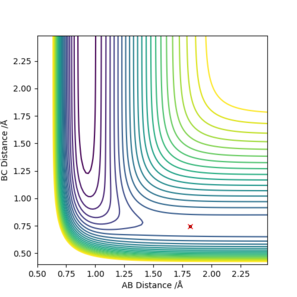

Answer: Transition state is located by assuming both momenta is 0 and find the internuclear distances between the atoms at where they are unchanged with time. The point is located on the contour plot, where there is no trajectory and the point remains at the starting point.
F + H2 (A=F, B=C=H):
rAB=1.815 Å, rBC=0.746 Å, pAB=0 and pBC=0.
H + HF (A=B=H, C=F):
rAB=0,746 Å, rBC=1.815 Å, pAB=0 and pBC=0 .
[9].Report the activation energy for both reactions.
Answer:
F + H2 (A=F, B=C=H):
rAB=1.815 Å, rBC=0.746 Å, pAB=0 and pBC=0 .
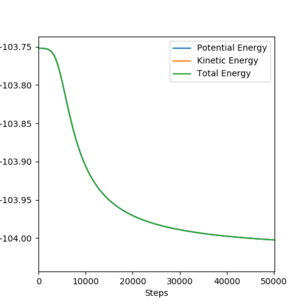
Ea=-103.75-(-104.0)=0.25 kcal/mol-1.
H + HF (A=B=H, C=F):
rAB=0,746 Å, rBC=1.815 Å, pAB=0 and pBC=0 .
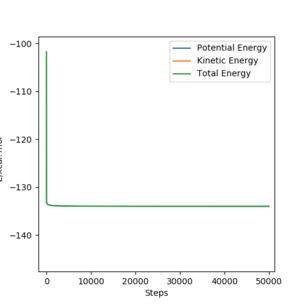
Etot=-101.9-(-134.0) =32.1kcal/mol-1
Correct, good remembrance of your units too! Mys18 (talk) 00:34, 9 June 2019 (BST)
Reaction dynamics
[10].In light of the fact that energy is conserved, discuss the mechanism of release of the reaction energy. Explain how this could be confirmed experimentally.
Answer:
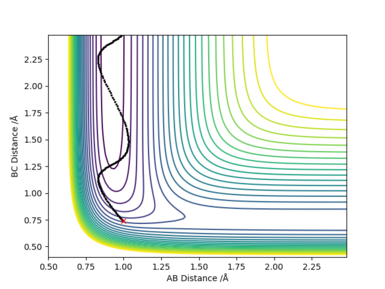
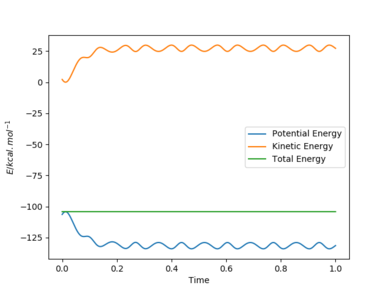
F + H2 (A=F, B=C=H): rAB=1.00 Å, rBC=0.74 Å, pAB=0 and pBC=-1.5.
Etot=-104.0 kcal/mol-1, it is a reactive reaction by looking through the contour plot.
The energy is conserved by looking at the energy-time plot. The total energy is constant with time change, and the changes in potential energy and kinetic energy always with the same amount in opposite direction. It is an exothermic reaction where the trajectory moves from higher potential energy reactant to lower potential energy along the potential energy surface. The energy gain from new forming H-F bond is greater than the energy put in breaking original H-H bond, thus gives an exothermic reaction. This could be confirmed experimentally by measuring the temperature increase of the reaction.
Sure, but you have produced plots that evidently show vibrational motion, what spectroscopy technique could we use to confirm this, what bonds could we look at/what would we observe?. Mys18 (talk) 00:37, 9 June 2019 (BST)
[11]. Discuss how the distribution of energy between different modes (translation and vibration) affect the efficiency of the reaction, and how this is influenced by the position of the transition state.
Answer:
H + HF (A=F, B=C=H):
The Polanyi rules, which state that vibrational energy is more efficient in promoting a late-barrier reaction than translational energy. It has been extended to polyatomic reactions by examining the coupling of reactant modes with the reaction coordinate at the transition state.
(1)an H atom colliding with a high kinetic energy
rAB=1.00 Å, rBC=0.91 Å, pAB=-10.0 and pBC=-0.5.
Etot=-97.8 kcal/mol-1, it is an unreactive reaction by looking through the contour plot. The momentum of incoming H atom is large and the vibrational energy of H-F bond is small.
(2) increasing the energy of the H - F vibration
rAB=1.00 Å, rBC=0.91 Å, pAB=-1.1 and pBC=-8.0.
Etot=-38.0 kcal/mol-1, it is a reactive reaction by looking through the contour plot. The momentum of incoming H atom is decreased and the vibrational energy of H-F bond is increased.
Therefore, it is clearly that the vibrational energy has an more important role in the reaction since this exothermic reaction has a late transition state. It is easy to cross the transition state barrier with high vibrational energy according to the Polanyi empirical rules.
On the contrary, the translational energy is more important for a reaction with an early transition state such as reaction of F and H2.
Very good and good trajectories! Nice job :). Mys18 (talk) 00:37, 9 June 2019 (BST)
Reference
[1].T. Bligaard, J.K. Nørskov, in Chemical Bonding at Surfaces and Interfaces, 2008

