MRD:01364124
Molecular Reaction Dynamics
Exercise 1: H + H2 System
Dynamics From the Transition State Region
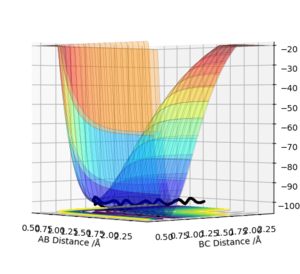
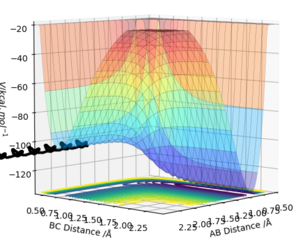
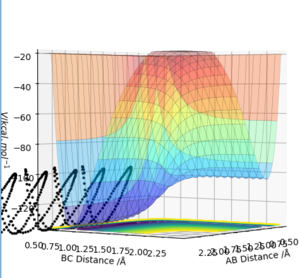
The transition state is defined as a saddle point where there is both a maximum and minimum depending upon the direction it is viewed from. At the transition state, the maximum and minimum will have differentials equal to zero. By taking the second partial derivative, we may then identify whether this point is a maximum or minimum. The potential energy surface diagram below illustrates how potential energy varies with interatomic distance between A, B and C. It may be seen that there is both a maximum and minimum as indicated by the curvature of the surface plot. Based on the surface plot, it may be observed that there is a greater curvature for points at the maximum in comparison to those at the minimum. This is due to the nature of the intrinsic chemical properties of the molecules in question.
This part is good. Sw2711 (talk) 17:08, 24 May 2019 (BST)
Trajectories from r1 = r2
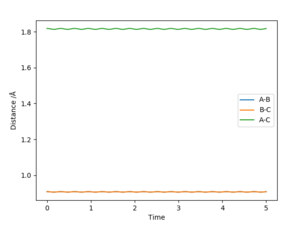
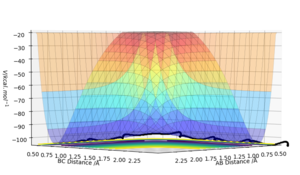
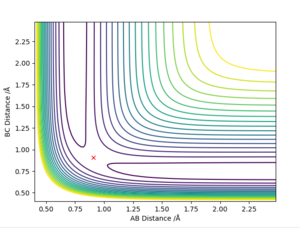
The best determined estimate of the transition state position (rts) was found to be 0.909. An initial estimate of 0.91 was found via the contour plot which showed that all atoms were at equal distance from one another and not falling off the ridge. By then establishing a plot of intermolecular distance against time, it was found that movement of atoms with time was little. Measurements up to a time of 1 second showed that the atoms did not fall off the ridge. However, extending this time to 5 seconds proved the opposite and thus accuracy was increased to a maximum of 0.909.
It shows that you've understood the concept. Just wondering whether you have tried 0.908, 0.907, 0.906 etc? Sw2711 (talk) 17:11, 24 May 2019 (BST)
Calculating the Reaction Path
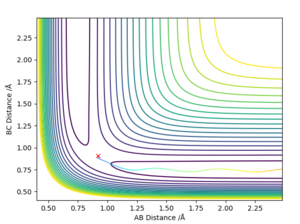
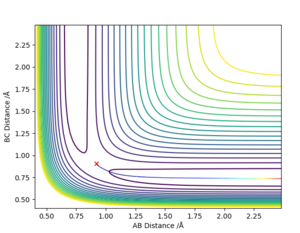
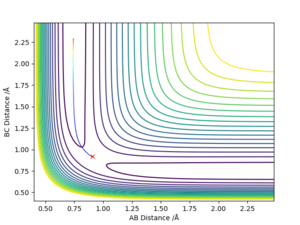
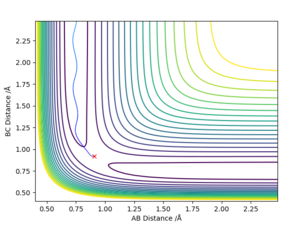
This part is generally good. Sw2711 (talk) 17:12, 24 May 2019 (BST) Calculation of the reaction path via a dynamic calculation setup results in a wavy line as shown in figure x. On the other hand, calculation via MEP results in a straight line. The MEP calculation produces a straight line as the velocity always resets to zero in each time step.
If an initial condition of r1 = rts and r2 = rts + 0.01 was instead used ie values reversed then the reverse of the graphs above would be shown. These graphs are shown below:
As shown by the distance-time graph, the A-B and A-C distance increase with time whilst the B-C distance remains relatively constant where the atoms do not move away from one another. Additionally, the graph indicates that the A-B distance is approximately 10 whilst the A-C distance is 0.75.
Setting the initial condition instead to r1 = rts and r2 = rts + 0.01, the B-C distance would instead increase with time and the A-B distance remain relatively constant. which means? Sw2711 (talk) 17:12, 24 May 2019 (BST)
Reactive and Unreactive Trajectories
Initial Positions r1 = 0.74 and r2 = 2.0 are kept constant throughout
- For the initial positions r1 = 0.74 and r2 = 2.0, run trajectories with the following momenta combination and complete the table.
| p1 | p2 | Etot | Reactive? | Description of the dynamics | Graph Number |
|---|---|---|---|---|---|
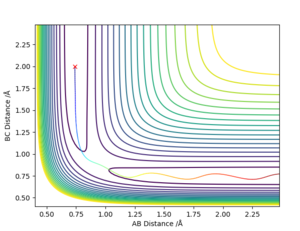
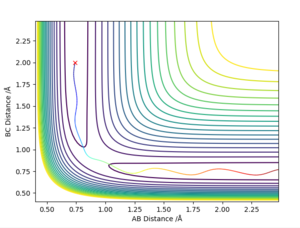
| -1.25 | -2.5 | -99.02 | Reactive | Atom C closes towards A-B which then breaks and results in formation of a B-C bond. | 1 |
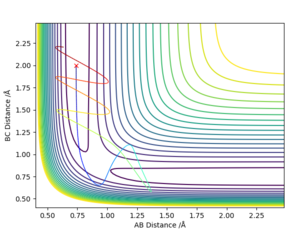
| -1.5 | -2.0 | -100.46 | Un-Reactive | Atom C closes towards A-B but does not have sufficient momentum to break the A-B bond. Thus it draws away from the A-B which remains intact. | 2 |
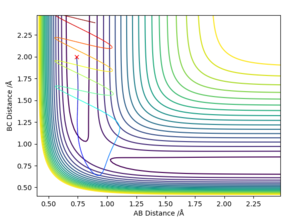
| -1.5 | -2.5 | -98.96 | Reactive | Atom C closes towards A-B just in the same pathway as Graph 1, however in this instance atom c has less energy. As a result, the time taken to reach the transition state and consequently react with it is greater | 3 |
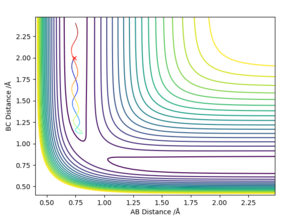
| -2.5 | -5.0 | -84.96 | Un-Reactive | where is your description for this one? | 4 |
| -2.5 | -5.2 | -81.80 | Reactive | Atom C approaches the A-B bond and results in oscillation of the A-B but the A-B bond reforms. Momentum of Atom C however is much greater and therefore results in breakage of the A-B bond and consequent formation of the B-C bond | 5 |
Transition State Theory
Transition State Theory (TST) can be used to understand the reaction rates of elementary chemical reactions. The theory makes an assumption of a special chemical equilibrium (quasi-equilibrium). This is an equilibrium between reactants and activated transition state complexes. The main aim of TST is to provide a qualitative explanation as to how chemical reactions take place. The main assumption of the transition state theory is that if a molecule has sufficient energy to reach the transition state, it will react. If it does not have enough energy to react then it will not react. Furthermore, classical mechanics rather than quantum mechanics is used to explain the transition state theory. This theoretically means that a reaction can take place without the atoms needing to reach the transition state.
Good, but how does that link to the previous experiment. Do you agree with the TST? In addition, we only have 3 atoms in our system. Do you think terms like 'equilibrium', 'quantum' is applicable in our case? Sw2711 (talk) 17:16, 24 May 2019 (BST)
Exercise 2 F-H-F System
PES Inspection
F + H2 -> HF + H
Conditions set for this reaction
F - H2 Distance (AB Distance): 2.00 A
H-H Bond Distance (BC Distance): 0.74 A
F-H Momentum: 2.90 kgms-1
H-H Momentum: -0.5 kgms-1
By observing the potential energy surface plot, it can be concluded that this reaction is exothermic as the products are higher in energy compared to the reactants.
Product is higher in energy than reactant, so it's exothermic??? Sw2711 (talk) 17:17, 24 May 2019 (BST)
H + HF
Conditions set for this reaction
F - H2 Distance (AB Distance): 2.0 A
H-H Bond Distance (BC Distance): 0.74 A
F - H2 Momentum: 2.55 kgms-1
H-H Momentum: -0.5 kgms-1
By observing the potential energy plot for this reaction, it may be concluded that this reaction is endothermic as the products are lower in energy in comparison to the reactants
Do you really observed product lower in energy in the plot? Sw2711 (talk) 17:18, 24 May 2019 (BST)
From both these contour diagrams, it may be determined that the H-F bond is stronger than the H-H. This is because for H + HF, the energy required to break the H-F bond is much greater than the energy released from the formation of the H-H bond, consequently the H-F bond is stronger than the H-H bond. Good. Sw2711 (talk) 17:18, 24 May 2019 (BST)
Position of the Transition State
HF: 1.80 A
HH: 0.75 A
You need some explanations. Sw2711 (talk) 17:19, 24 May 2019 (BST)
Activation Energy
Activation Energy is the energy required to reach the transition state. In terms of a potential energy surface diagram, it is the difference in energy between the reactants and the transition state. In order to determine the energy of the reactants, a distance may be added or subtracted from the bond length of HF. By doing this, the contour plots the trajectory of the atoms. In this case, 0.1 A may be added to the H-F bond length such that the trajectory of the atom falls into the reactants.
So what's the energy? Sw2711 (talk) 17:19, 24 May 2019 (BST)
Energy of the Transition State of F + H2
Reaction Dynamics
The initial conditions that result in a reactive trajectory are as follows:
H-H Bond Distance: 0.74 A
H-F Bond Distance: 1.8 A
H -F Momentum: -0.5 kgms-1
H-H Momentum: 2.90 kgms-1
Huh? so what? Where are your answers for the last two questions? Sw2711 (talk) 17:20, 24 May 2019 (BST)

