MRD:013566600
Exercise 1: H + H2 System
Ng611 (talk) 18:57, 30 May 2019 (BST) In most places an absolutely exemplary report. You used the wrong PES in your final set of simulations, although this hasn't lead you to the wrong conclusion. Think carefully about your experiment and what the results you obtain correspond to.
Transition State
Transition state is the configuration corresponding to a saddle point on the potential energy surface (PES) of the molecule of interest. This saddle point can be found by using the Hessian matrix to find a stationary point on PES. Similar to energy minimisation, the transition state has a partial derivative of 0 with respect to all its axes. In order to distinguish between a transition state and local minima/maxima (equilibrium geometry), we must examine the second derivatives of the PES with respect to the geometry, using the Hessian Matrix. [1] The determinant of the Hessian Matrix would be negative at a saddle point and positive at a local minima or maxima.
where and
Ng611 (talk) 18:47, 30 May 2019 (BST) Consider numbering your equations.
If and , then has a local minima at
If and , then has a local maxima at
If , then has a saddle point at
The diagonalisation of this matrix yields Eigenvectors, which are normal modes of the vibration. The Eigenvalues are proportional to the square of the vibrational frequency. Hence, the sign of the second derivative can be used to distinguish between Maxima and Minima on the PES. A local minima on the PES have only positive eigenvalues (vibrational frequencies) whereas a local maxima or Saddle Point have one or more negative (imaginary) frequencies. A frequency calculation should be performed to determine the sign of eigenvalues and subsequently identifying the transition state at the saddle point.[1]
Ng611 (talk) 18:47, 30 May 2019 (BST) Exemplary answer! Analysis of the hessian and the emergence of 'soft' (i.e.: negative frequency) phonon modes is how you identify transition states vs local minima in most computational chemistry packages.
Estimation of the Transition State
Force is defined as the negative gradient (first derivative) of the potential energy () with respect to internuclear distance (). Therefore, we can expect the gradient of transition state to equate to zero. Information of forces along AB and BC in Graphical User Interface (GUI) can help identify this.
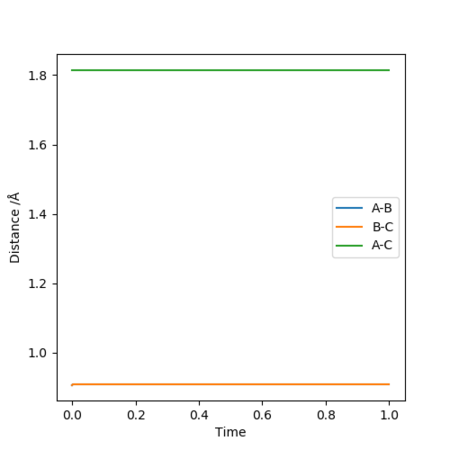
The initial estimation value for transition state bond length is RAB = 0.91 Å, RBC = 0.91 Å and ρAB = 0 , ρBC = 0. The forces along AB and AC were -0.895 and a slight oscillation can be seen from the internuclear distance-time plot. This indicates that 0.91 Å is not the exact transition state bond length.
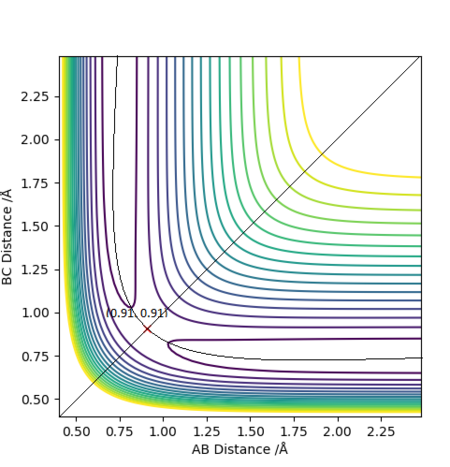

It was found that Force = 0 when RAB = 0.907742 Å, RBC = 0.907742 Å, hence this is the stationary point.
Ng611 (talk) 18:49, 30 May 2019 (BST) A very sophisticated way of identifying the TS, well done! Think about how these forces relate to the Hessian matrix you describe above.
MEP and Dynamic Trajectory
Minimum Energy Path (MEP) is defined as the lowest energy path for the rearrangement of a group of atoms from one stable configuration to another, leading to product formation. It corresponds to an infinitely slow motion, where the momenta are always reset to 0 in each step. To trace out the MEP, both the initial and final states the saddle point corresponds to must be known.
Comparison between MEP and Dynamic Trajectory
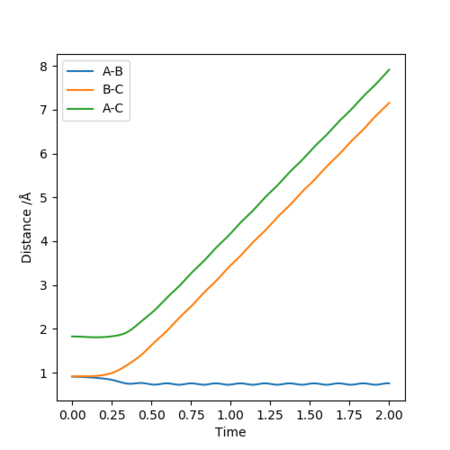
The initial conditions here were displaced to RBC = 0.917742 Å and RAB = 0.907742 Å. The results of these initial conditions were compared between MEP and dynamic calculations. Both calculations showed that RAB approaches infinity with time whilst RBC fell at around 0.75 Å. This occurs as HB and HC attracts each other to form a H-H bond, and HA moves away to infinity.
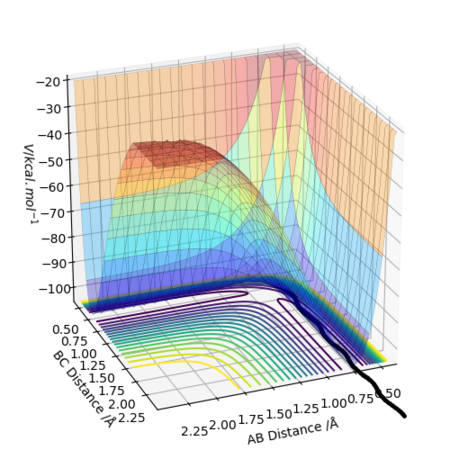
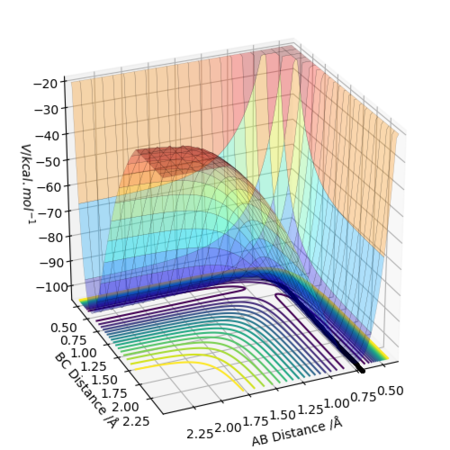
The difference between MEP and Dynamic calculations as seen from above figures is the oscillatory motion present in the Dynamic calculation. This is not seen in MEP because the trajectory flows downhill along the minimum energy path initiated at the saddle point (Transition State) with all the inertia effects of the atoms removed. Hence, MEP does not travel into valleys of high potential energy which causes the oscillatory motion.
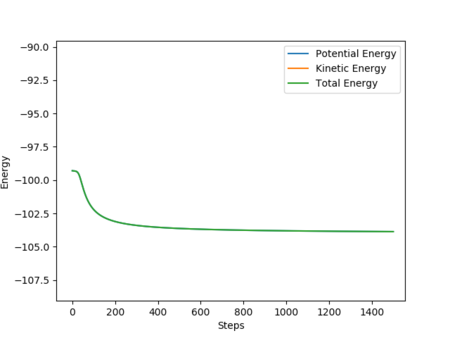

From Fig. 7, the oscillatory motion can be observed. The momenta possessed by the molecules allow it to travel into valleys of higher potential energy, thus causing the oscillatory motion.

Reactive and Unreactive Trajectories of H2
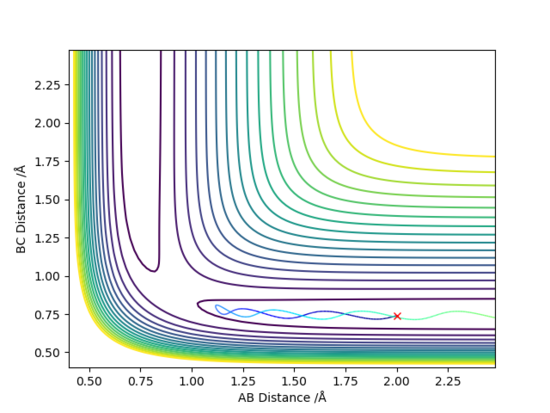
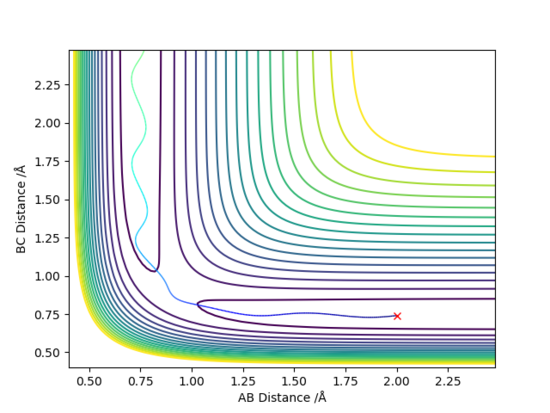
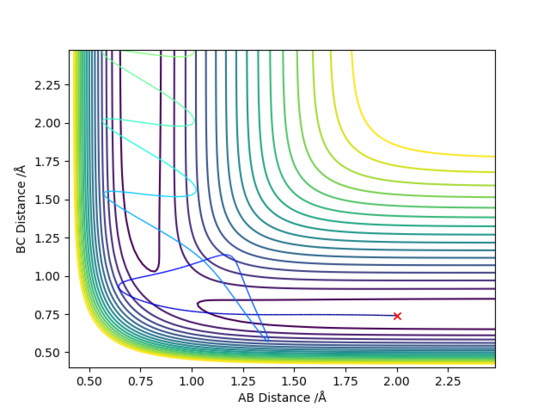
The initial conditions are RBC = 0.74 Å, RAB = 2.0 Å, with ρBC = p1, ρAB = p2 as shown in the table below.
In conclusion, the assumption that a molecule that has energy greater than its activation energy will lead to a reactive pathway is not always applicable. In reaction D, even though the momenta p1 and p2 were relatively high, it is an unreactive pathway. On the other hand, reaction can occur in A and B when momenta were relatively lower.
Transition State Theory
Transition State Theory (TST) is a method for estimating rate constants of transitions, i.e. in chemical reactions or diffusion. The underlying idea is identifying the dividing surface (transition state) that separates the reactants (initial state) and the products (final state). TST relies on a few assumptions stated as below:
1. Reactant states are in local equilibrium along the reaction coordinate.
2. Once the trajectory crosses the transition state and overcome the activation energy, it will form the product and does not regenerate the reactants.
3. The rate is slow enough so the atoms in the initial state (Reactants) obeys the Boltzmann Distribution.
4. Born-Oppenheimer approximation applies.
5. Particles behave classically.
Ng611 (talk) 18:52, 30 May 2019 (BST) Not sure how you'd reconcile the assumption that particle behaviour can be treated classically with the need to apply Born-Oppenheimer (a quantum mechanical approximation). Perhaps you mean that at the TS, any motion along the IRC can be treated classically as a translation?
Assumption 2: TST assumed a successful reactive pathway would occur if the particles possessed total energy higher than the activation energy, but Reaction D showed that this does not always hold true for all reactions. From Reaction D's contour plot, even though the particles have overcome the activation energy, they rebounded to regenerate the reactants which is not assumed by TST. The predicted reaction rate is higher than the experimental value.
Assumption 5: In contrast, TST assumed an unreactive pathway if particles possessed total energy lower than the activation energy. However, particles can behave quantum mechanically, hence via quantum tunnelling, it can lead to product formation for reactions with lower total energy than its activation energy. The predicted reaction rate is lower than the experimental value.
Exercise 2: F - H - H system
PES Inspection of F + H2 -> H + HF
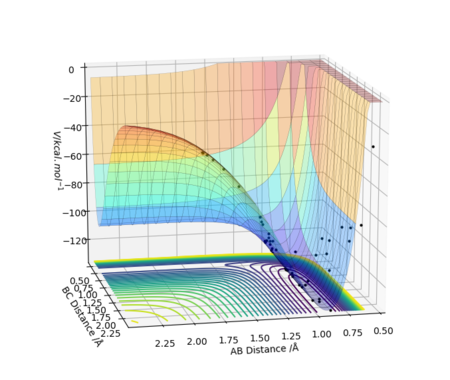
From the PES, the reactants F and H2 are situated at a higher potential energy than the products. As the reaction proceeds, potential energy is lost. Therefore, F + H2 -> H + HF is an exothermic reaction as energy is released. The H-H molecule gains some kinetic energy as it loses some potential energy when the H-H bond starts to break, to form the new H-F bond. The H-F bond strength is 569 kJ/mol which is stronger than H-H bond strength 436 kJ/mol. [2] The bond formed is higher in energy than the bond broken, energy is released, hence the reaction is exothermic.
Transition state is at RHF = 1.81025 Å and RHH = 0.744891 Å. Forces along H-F is -0.002 whilst along H-H is 0.000. Transition state total energy = -103.752 kcal/mol
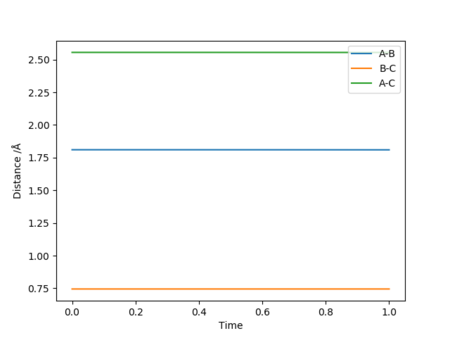

The Hammond's Postulate states that the transition state of a reaction resembles the structure of the species (reactant or product) to which it is closer in energy. It also relates reaction rate to stability. Since F + H2 -> H + HF is an exothermic reaction, the transition state should resemble its reactants (early TS).
Calculating the Activation energy of this reaction
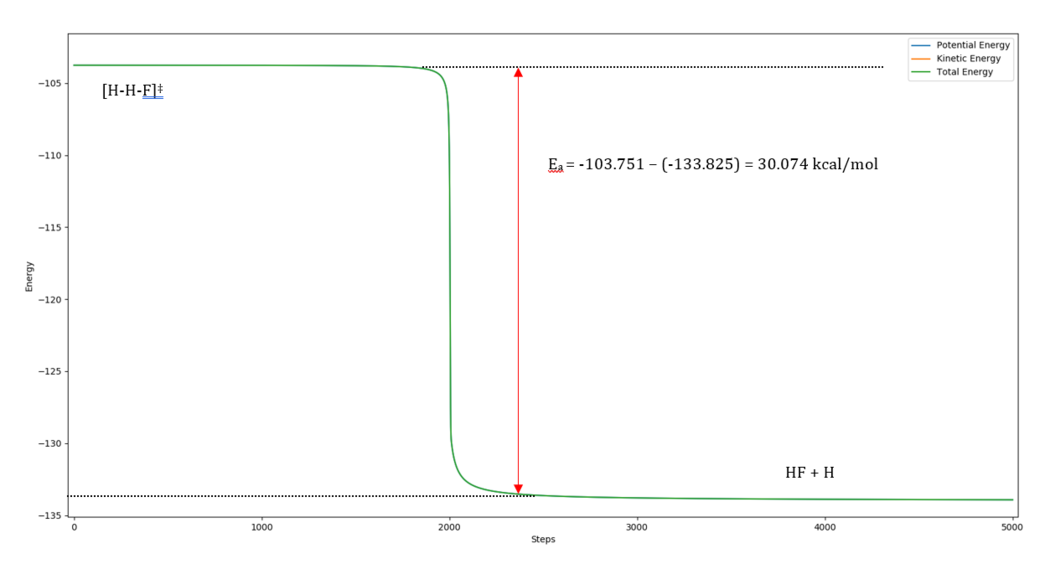
Activation energy is defined as the difference in energies between the transition state and the reactants/products. By altering the initial conditions to slightly displace from the transition state in the direction of forward (or backward) reaction, the activation energy can be calculated.
Initial conditions for H2 + F -> HF + H (Exothermic)
HHF = 1.83025 Å and HHH = 0.744891 Å
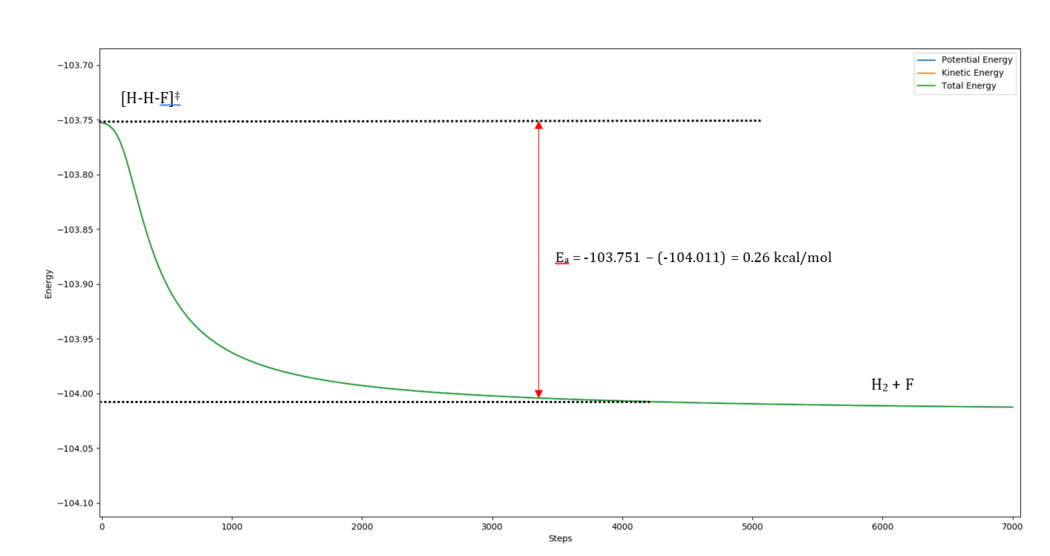
Activation Energy: -103.751-(-104.011) = 0.26 kcal/mol (literature value = 0.3 kcal/mol) [3]
Initial conditions for HF + H -> H2 + F (Endothermic)
HHF = 1.79025 Å and HHH = 0.744891 Å
Activation Energy: -103.751-(-133.825) = 30.074 kcal/mol
Reaction Dynamics
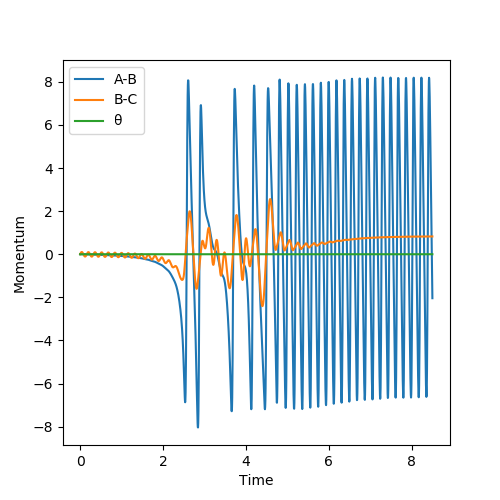
Initial Conditions: HHF = 1.80 Å and HHH = 0.74 Å, ρHF = 0, ρHH = 0
The H2 molecule initially travels with little vibrations, towards F (take this direction as Left). After the initial collision with F, it rebounded in the direction towards the right. This causes the peak and trough oscillation shown in Fig. 15. After a few similar collisions, the H-H bond finally dissociates. HA moves further away from HB. H-F bond is formed, giving the plateau in Fig. 15 for B-C bond.
The reaction between H2 + F leads to three electronic states, but only the lowest energy among these is reactive. This could be confirmed experimentally by performing a photoelectron spectroscopy on the stable negative ion FH2- where the spectra provides transitions to the ground state and to low-lying excited state surfaces. The Franck-Condon region overlaps with the saddle point (TS), and it will tend to lie towards the reactant than the product valley of the saddle point. Infrared chemiluminescence, chemical laser, and crossed molecular beam experiments [4] are methodologies that have been used to determine rate constants over a large temperature range to compare them between experimental and theoretical values.
Ng611 (talk) 18:53, 30 May 2019 (BST) Excellent!
Polanyi's Empirical Rules
| Case | RHH | RHF | ρHH | ρHF | Contour Plot |
|---|---|---|---|---|---|
| 1 | 0.74 | 1.80 | -3.00 | -0.5 | 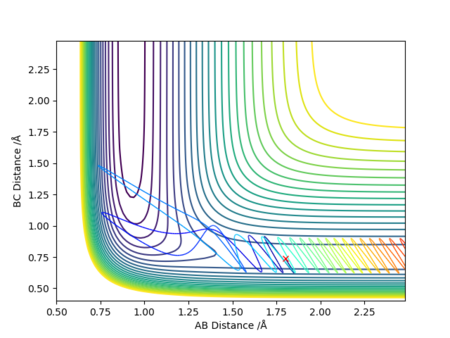
|
| 2 | 0.74 | 1.80 | 2.50 | -0.8 | 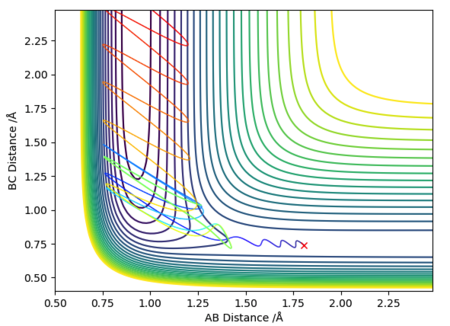
|
Case 1 showed that the reactants are projected onto the surface with a low momentum. They have insufficient kinetic energy to overcome the activation barrier, and the trajectory 'U-turned' and returns to the entrance channel of the reactants. This trajectory corresponds to an elastic or inelastic scattering, depending on whether there is a change in rotational or vibrational state of H2.
Case 2 showed that the reactants are projected onto the surface with a high momentum. They have sufficient kinetic energy to overcome the activation barrier. At small BC (H-F) distances, they roll up the repulsive surface, before falling back down again, followed by an oscillatory trajectory towards the exit channel, forming the products. As atom A (HA) departs, the BC distance (H-F) extends and contracts periodically, and this corresponds to the vibration of H-F.
From these two cases, it can be predicted for a reaction to occur, sufficient amount of energy is needed relative to the transitional motion of the reactants. Some of these energy is converted to the vibrational motion of the products.
| Case | RHH | RHF | ρHH | ρHF | Contour Plot |
|---|---|---|---|---|---|
| 3 | 2.00 | 0.91 | -3.00 | 0.1 | 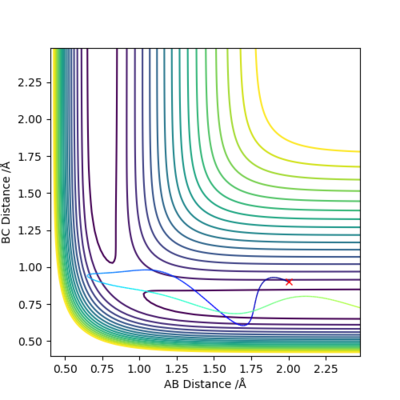
|
| 4 | 2.00 | 0.91 | -0.10 | 5.0 | 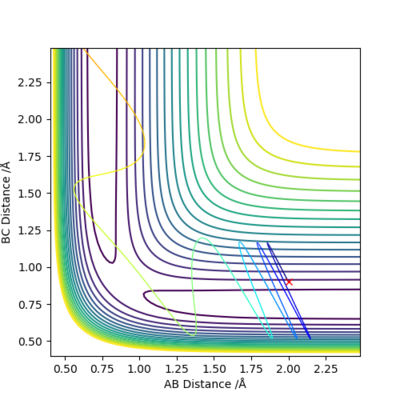
|
Ng611 (talk) 18:54, 30 May 2019 (BST) The PES versions here don't really seem to correspond to the ones in the previous table. The ones here look like H + H2 PESs. Are you sure you performed the correct simulations?
Trajectories in Case 3 and 4 correspond to the reverse reaction, HF + F -> H2 + F.
Case 3 is an unreactive pathway. Some of the translational energy of the reactants are converted into vibrational energy of the AB molecules (H2) after the collision, but insufficient to overcome the activation barrier.
Case 4 is a reactive pathway. The reactants started with a mixture of translational and vibrational kinetic energy, and it overcame the activation barrier to form the products with no vibrational excitation.
It has always been of interest how chemical reactions are driven by various forms of energy. To drive a reaction effectively, energy can be channeled into the reaction coordinate near transition state. However, the reaction coordinate (bond length) is constantly changing as the reaction progresses, the exact reaction coordinate is difficult to identify. Mode specificity can provide a better understanding of the dependence of reactivity on reactant mode excitation. [5] Polanyi proposed two empirical rules concerning mode specificity for reactions like H2 + F -> HF + H. For an exothermic reaction with early TS, the translational energy is more effective than vibrational energy in overcoming the activation barrier, and vice versa for an endothermic reaction with late TS. [6] [7]
Note that although Polanyi's empirical rules have provided understanding for mode specificity, it is difficult to extend these rules to polyatomic molecules.
Ng611 (talk) 18:56, 30 May 2019 (BST) You are correct, although due to the mistake in your FH+H simulations, your data doesn't actually back this up.
Bibliography
- ↑ 1.0 1.1 H. Bernhard Schlegel;Optimization of equilibrium geometries and transition structures, J. Comput. Chem., 1982, 3(2), pp. 214-218.
- ↑ P. Atkins, J. De Paula; Atkins Physical Chemistry, 2006, Oxford University Press, Oxford
- ↑ D. Truhlar, N. Blais; Variational Transition State Theory, J. Chem. Phy., 1984, pp. 159−189
- ↑ S. Bradforth, D. Arnold, D. Neumark; Experimental and theoretical studies of the F + H2 TS region via PES of FH2-, J. Chem. Science, 1993, UC Berkeley
- ↑ S. Bradforth, D. Arnold, D. Neumark; Experimental and theoretical studies of the F + H2 TS region via PES of FH2-, J. Chem. Science, 1993, UC Berkeley
- ↑ B. Zhao, Z. Sun, H. Guo; State to State dynamics of the Cl + H2O -> HCl + OH Reaction: Energy Flow into Reaction Coordinate and Transition State Control of Product Energy Disposal, J. Chem. Phy., 2015
- ↑ J. Polanyi; Some Concepts in Reaction Dynamics, Acc. Chem. Research, 1972, 5(5), pp. 161–168


