MRD:01349769
EXERCISE 1: H + H2 system
=== On a potential energy surface diagram, how is the transition state mathematically defined? How can the transition state be identified, and how can it be distinguished from a local minimum of the potential energy surface?
===
The transition state is defined as the maximum on the minimum energy path linking reactants and the products on a potential energy surface (PES) diagram. If one starts a trajectory exactly at the transition state, with no initial momentum, it can remain there forever. This is due to the fact that the change in potential energy with respect to coordinates is 0, and hence no force is acting on the particle under these conditions. However, if one changes the geometry by a small amount in the direction of the products it can roll towards the products (and similarly for the reactants). One way of locating the transition state is to start trajectories near the transition state and see whether they "roll" towards the reactants or products. On a PES diagram for this system, a transition state can be mathematically defined to be where ∂V(r1, r2)/∂r1 = ∂V(r1,r2)/∂r2 = 0 and where the point in question is a saddle point . To distinguish between a saddle point and a local minimum, one can use the second partial derivative test. If H < 0 and then a saddle point is present and hence the transition state is identified here. For a local minimum, the condition is H > 0 and ∂V2(r1, r2)/∂r12r > 0, which indicates a minimum in potential energy with respect to reaction coordinates (∂V2(r1, r2)/∂r22 can also be used - the choice is arbitrary and gives the same result).[1] Inspection of a PES diagram for this reaction will show two minima and a saddle point for potential energy along the minimum energy path thus providing a visual aid for this system. (Here, V is potential energy and the r variables are the positions of the atom ( r2) and molecule(r1). H is the Hessian determinant from which the test is derived from).
Great answer well done. Rs6817 (talk) 15:29, 28 May 2020 (BST)
=== Report your best estimate of the transition state position (rts) and explain your reasoning illustrating it with a “Internuclear Distances vs Time” plot for a relevant trajectory.
===
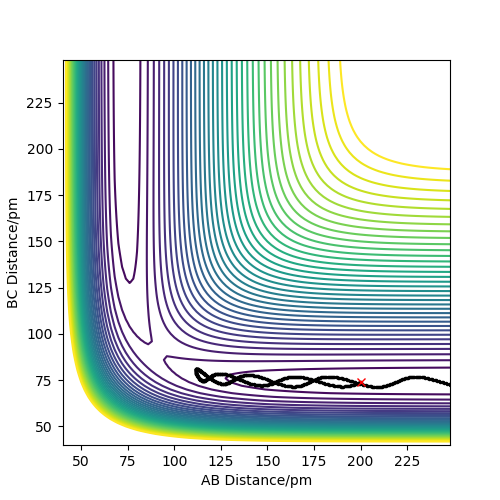
Calculations showed that the best estimate is rts= 90.8pm. The reasoning here is that with this value, the potential energy of the transition state is at its lowest relative to other positions and the most realistic transition state is naturally going to be the one of lowest energy. This allows the reaction to be more kinetically feasible and be along the minimum energy path. Having higher energy positions would contradict the condition of requiring the minimum energy path. Furthermore, the atoms don't oscillate at this transition state position when given no momentum, thus no force is acting on them. Also, given that partial bonds are present at a transition state, either through the process of forming or breaking, it's no surprise that the distance between H atoms would be greater than the equilibrium bond length of 74pm for dihydrogen. Figure 1 shows an internuclear distances vs time plot for a trajectory originating near the stated transition state position of 90.8pm. Here, the "rolling" phenomenon is seen as the trajectory slowly moves towards the products and the distance, B-C, decreases. At smaller values of transition state position, a slow moving trajectory isn't seen, rather a very fast trajectory is observed - which can be a consequence of the repulsive energy present as distances between atoms shorten.
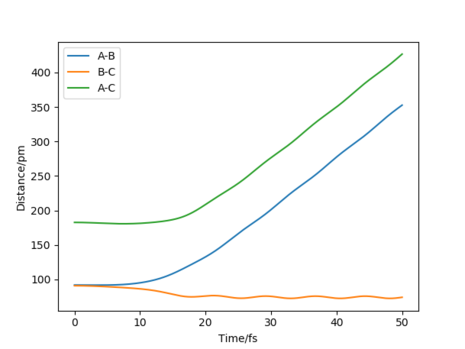
Well answered. What does the internuclear distance vs time plot look like if you are at the transition state? Rs6817 (talk) 10:53, 4 June 2020 (BST)
=== Comment on how the mep and the trajectory you just calculated differ.
===
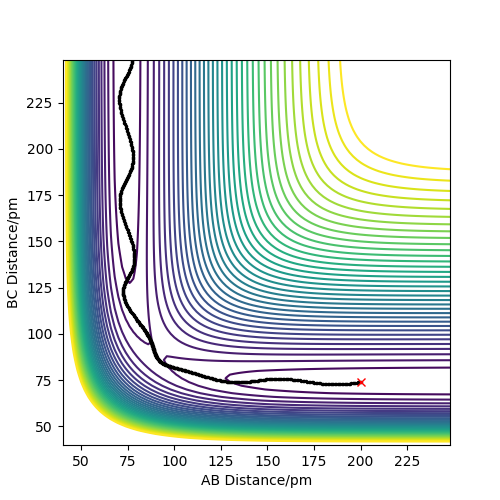
The mep trajectory does not have any vibration occurring in the molecule during the trajectory, since momentum/velocity is set to zero in each step; this means that the total energy will decrease when the trajectory moves towards the products as the potential energy decreases while the kinetic energy remains 0 throughout the trajectory. As a consequence, no conversion is possible between the two forms of energy as a result of this. These points can be seen in Figure 2 which shows the contour plot for the mep for the same initial conditions. The motion of the trajectory is straight, owing to kinetic energy being removed in each step, thus there's no vibration in the molecule.
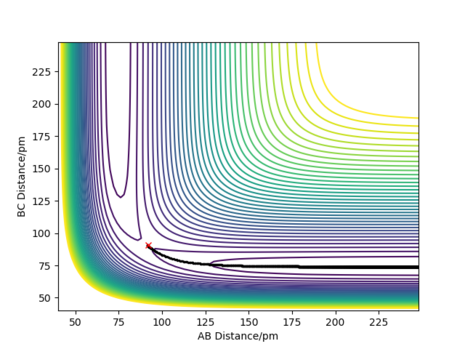
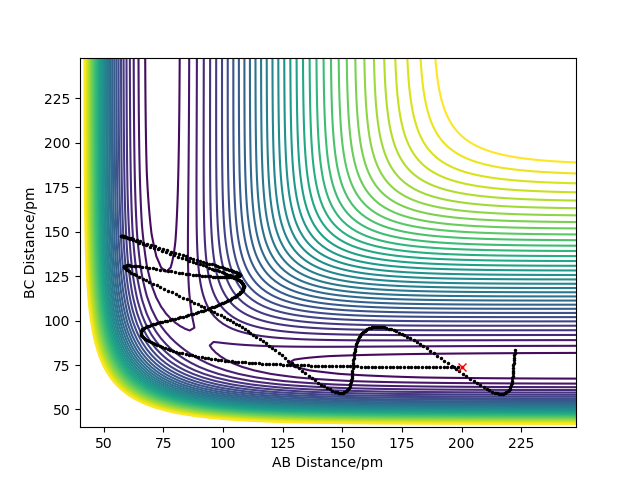
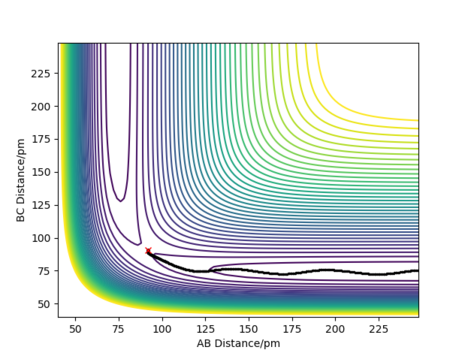
Figure 3 shows the contour plot for the dynamic trajectory for the same initial conditions. Here, the trajectory isn't straight, but wavy and so oscillating; this is due to exchange of potential energy to kinetic energy, giving a constant overall energy and hence the presence of vibrations. This is in stark contrast to the mep trajectory, where the value of 74pm for the B-C distance is constant after products have formed; this does not occur for the dynamic trajectory.
Good answer. Well illustrated Rs6817 (talk) 10:57, 4 June 2020 (BST)
=== Complete the table above by adding the total energy, whether the trajectory is reactive or unreactive, and provide a plot of the trajectory and a small description for what happens along the trajectory. What can you conclude from the table?
===
From this table, a conclusion can be drawn that a trajectory can end up being unreactive if a hydrogen atom and molecule possess certain higher values kinetic energy relative to a reactive trajectory with reactants having lower kinetic energies. Evidentially, Having enough kinetic energy to exceed an activation barrier isn't necessarily enough for a trajectory to be reactive since its possible for further transition states to form in the same trajectory which can then lead the trajectory back to the reactants. Rather, a correct quantity of kinetic energy is required to form a transition state and then not have the required quantity to form another one.
Good layout of table but descriptions suggest you may be over complicating things. There is no direct indication of vibrational level occupancy. The trajectories show an incoming atom to a molecule. The results from the table suggest a combinatorial dependency on vibrational AND kinetic energy for a reaction succesfully occur / bypass the transition state inot the product channel. Rs6817 (talk) 11:02, 4 June 2020 (BST)
=== Given the results you have obtained, how will Transition State Theory predictions for reaction rate values compare with experimental values?
===
Excessive amounts of kinetic energy can lead to the formation of multiple transition states for this hydrogen system and result in the trajectory returning back to the reactants. However, one of the key characteristics of Transition State Theory (TST) is that once reactants enter the transition state, they can no longer go back to being reactants and hence products form. Because of this, TST can predict higher reaction rate values relative to those from experiment where it could be possible for the transition to fall back to reactants and thus lowering rate. Furthermore, the Eyring equation can be written in terms of classical thermodynamic terms such as ΔG‡ (corresponding to Gibbs Free Energy change between the reactant and transition state) and this can be naturally be extended to ΔS‡ and ΔH‡, the entropy and enthalpy changes of activation, respectively. Thus, for reactions where two particles are coming together to form one structure like this one, there is naturally a loss of entropy on forming the transition state, giving a more positive ΔG‡ and hence a possibly lower reaction rate relative to experimental values. In the values calculated here, entropy was not factored in - thus, TST could lead to a reduction in reaction rates compared with the method here. Given that the partition function of the transition state isn't going to outweigh the product of the two partition functions of the reactants for this reaction (just on the basis of the very large number of translational states lost), the statistical thermodynamic approach using the Eyring equation also shows a loss of entropy and again, a possible drop in reaction rates relative to experimental values.
Watch the wording here, multiple transition states suggests that you beleive there to be multiple transition states, there is only one, as indicated by the saddle. I think what you are getting at is barrier recrossing / the trajectory passing over the saddle region. You have not described the further assumptions of TST and how these relate directly to the modelled system in your table above. Your discussion on the Eyring equation, whilst erudite is not particularly relevant to the question and is not referenced. Your assumptions are quite vague here and I am not sure if the programme provides the information required to expore this. Rs6817 (talk) 11:07, 4 June 2020 (BST)
EXERCISE 2: F-H-H system
=== By inspecting the potential energy surfaces, classify the F + H2 and H + HF reactions according to their energetics (endothermic or exothermic). How does this relate to the bond strength of the chemical species involved?
===
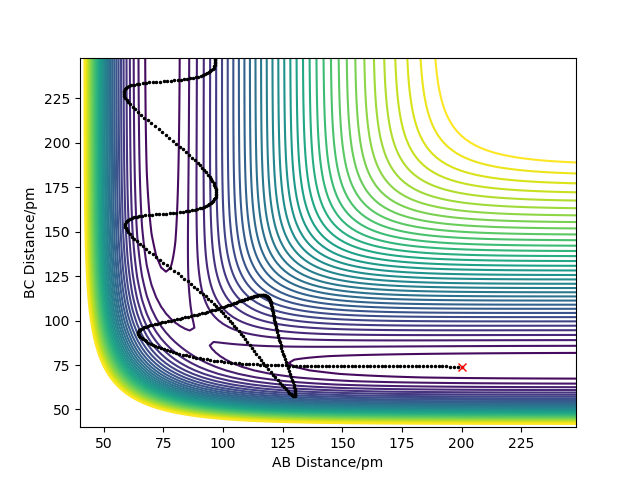
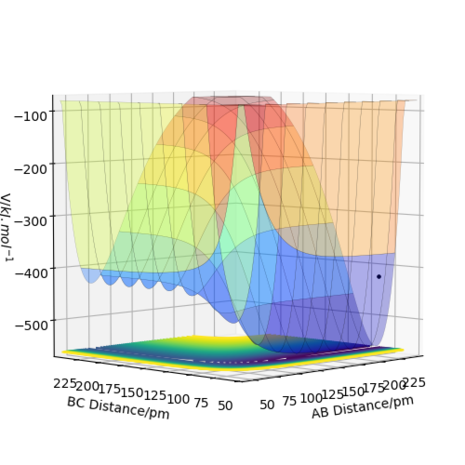
F + H2 is an exothermic reaction, as the PES diagram shows the product being of lower potential energy along the reaction coordinate, thus releasing (heat) energy to the surroundings. The H-F bond formed is stronger than the H-H bond present in the reactants. Figure 4 shows the PES diagram for this reaction.
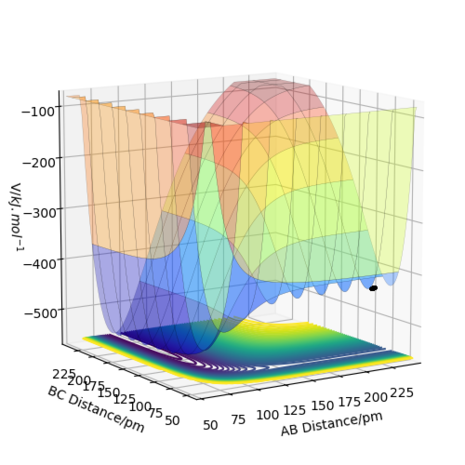
Naturally, H + HF will be an endothermic reaction as its the reverse of the reaction above and the PES plot confirms this, given the product being of higher potential energy. Thus (heat) energy is absorbed from the surroundings. This is due to the H-H bond being weaker than the H-F bond. Figure 5 shows the PES plot for this reaction, which is naturally a reverse of the reaction above.
Good answer, clear and well described - good referencing the figures in text. A reference for relative bond strengths would further support this answer. Rs6817 (talk) 11:10, 4 June 2020 (BST)
=== Locate the approximate position of the transition state
===
The approximate position of the transition state is calculated as being 99.412 pm. At this position, the forces acting on the transition state are zero along AB and BC - thus the molecule should have no momentum and a saddle point should be present.
=== Report the activation energy for both reactions.
===
The activation energy for the F + H2 reaction is calculated as approximately 7.11 kJ mol-1.[2] The energies, E, of the F + H2 and HF + H species are -435.1 kJ mol-1 and -560.7 kJ mol-1, respectively - which can be calculated by letting AB →∞ and setting BC to the equilibrium bond length of the HF and then H2 species then switching as appropriate. This gives ΔE = -125.6 kJ mol-1 for the exothermic reaction. Using the equation Eab = Eaf - ΔE = (7.11 kJ mol-1) - (- 125.6 kJ mol-1) = 132.71 kJ mol-1 to give the activation energy for the backwards reaction, HF + H. (Ea are the activation energies for forward and backward reactions, ΔE is the change in energy for the reactants relative to products).
How did you determine these energies? This needs to be made clear with an Energy vs time plot. I tihnk you may have confused exo and endo in your reported activation values. Rs6817 (talk) 11:15, 4 June 2020 (BST)
=== In light of the fact that energy is conserved, discuss the mechanism of release of the reaction energy. Explain how this could be confirmed experimentally.
===
In the event that products form with excess amounts of energy, a mechanism for the release of said energy is in the form of rotational-vibrational coupling where the vibrational states can couple to the rotational states and decay an excited vibrational state to the ground state for a given vibrational mode. When this happens, IR radiation will be emitted. The IR chemiluminescence can be measured by IR spectroscopy and the intensity and frequency of the bands can give insight into the population of vibrational states and their energies for a given mode of the H-F bond[3]
Good answer, well referenced. Rs6817 (talk) 11:16, 4 June 2020 (BST)
=== Discuss how the distribution of energy between different modes (translation and vibration) affect the efficiency of the reaction, and how this is influenced by the position of the transition state.
===
Efficiency of the reaction and other reactions in general can be sensitive to proportion of the energy present as translation or vibration since it can be a number of times faster with higher amounts of one or the other. To assess why, it's necessary to assess the PES plots for a reaction. An attractive surface for is one in which the saddle point occurs early in the reaction coordinate, while a repulsive surface is one in which the saddle point occur late. A surface that's attractive in one direction is repulsive in the opposite direction. For an attractive surface, a lack of translational energy can prevent it reaching the saddle point and thus prevent it from forming products. Thus increasing the proportion of translational energy while keeping other variables constant will increase the efficiency of a reaction with an attractive surface. Products formed from attractive surfaces tend to be in vibrationally excited states too. In contrast, reactions with repulsive surfaces proceed more efficiently if the proportion of vibrational energy is increased, while keeping other variables constant. The added vibrational energy allows the trajectory to fluctuate and use this fluctuation while moving up the valley to reach the saddle point. As a consequence, products typically form in their vibrational ground states.[4]
The programme would have allowed you to explore this. What does Hammonds postulate tell us? What about Polanyis rules? Rs6817 (talk) 11:17, 4 June 2020 (BST)
References
- ↑ https://mathworld.wolfram.com/SecondDerivativeTest.html
- ↑ V. Aquilanti, K.C. Mundim, S. Cavalli, D. De Fazio, A. Aguilar, J.M. Lucas,
Exact activation energies and phenomenological description of quantum tunneling for model potential energy surfaces. The F+H2 reaction at low temperature,
Chemical Physics,
Volume 398,
2012,
Pages 186-191,
ISSN 0301-0104, - ↑ Atkins, de Paula, Keeler, Atkins' Physical Chemistry 11e, 2017, Chapter 18, Page 804
- ↑ Atkins, de Paula, Keeler, Atkins' Physical Chemistry 11e, 2017, Chapter 18, Page 808


