MRD:01345527
Introduction
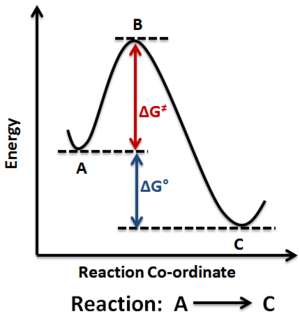
Reactions between two or more species can be plotted on an energy-reaction coordinate graph. Figure 1 shows such an example.
The reaction coordinate is an indication of the progress made along the reaction, and it is system dependent. It can be the distances between two species, or an axis of time.
Figure 1 can be therefore considered as a 1-dimensional potential energy surface, where the transition state (TS) is at the maximum of such an energy-coordinate graph. Mathematically, this can be expressed as and can be confirmed by taking the second derivative, which would be negative i.e. . In the forward direction. Pu12 (talk) 20:20, 21 May 2020 (BST)
Furthermore, if the reaction coordinate was a function of the distance between two reactant species , the derivative of energy with respect to distance would give the magnitude of Force,
:
It is important to realise that the potential energy surface is multidimensional and not a one dimensional curve like in your Figure 1. The internal reaction coordinate (IRC) is not known a priori, so one cannot calculate quantities like or , so these expressions cannot be used to localise a transition state. First and second derivatives of a multidimensional surface thus depend on the direction (or coordinate) in which one is taking the derivative. For example, in the transition state, the second derivative of the potential energy is negative with respect to only one direction, and is positive with respected to all other directions - that is the definition of a first order saddle point. João (talk) 00:59, 30 May 2020 (BST)
The properties of the transition state can be characterised using Hammond's Postulate. The transition state is similar in energy and therefore in structure to the reaction intermediate, where the structure will resemble the reactant or product depending on which is closer in energy. An endothermic reaction shows a TS closer to the product, and an exothermic reaction having a TS closer to the reactant.
Note that transition state and reactive intermediate are two different things, the former is a saddle point in the potential energy surface and the latter is a local minimum in the potential energy surface corresponding to a meta-stable species. João (talk) 00:59, 30 May 2020 (BST)
Experimental
Exercise 1: H + H2 system
Setup
A program was run using the following reaction conditions (Distances r1 refers to BC, where B—C is a hydrogen diatomic and A is a lone hydrogen atom) -
| Distance r1 / pm (AB) | Distance r2 / pm (BC) | Momentum p1 / g mol-1 pm fs-1 (AB) | Momentum p2 / g mol-1 pm fs-1 (BC) |
|---|---|---|---|
| 230 | 74 | - 5.2 | 0.0 |
Figure 4 illustrates the system.

In this system, atom B is colliding with molecule AC. A new bond A—B is formed whilst the distance B—C lengthens.
Trajectory illustrations
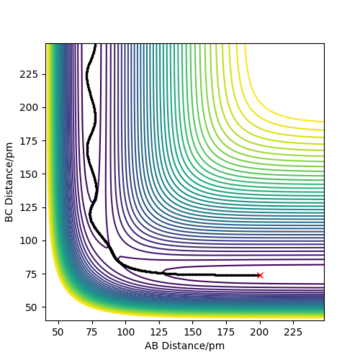
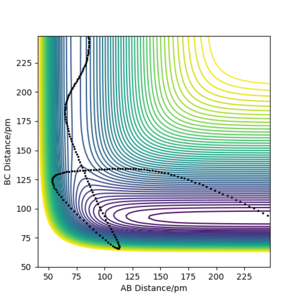
The contour plot observed is shown Figure 5. A reactive trajectory is observed in this instance, where the reaction starts from the reaction channel (top right) and finishes at the product channel (bottom right).
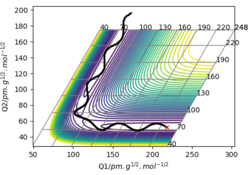
A skew plot is also illustrated on Figure 6, where the energy contour plot is produced on a different set of coordinates Q1 and Q2, both as a function of rAB and rBC.
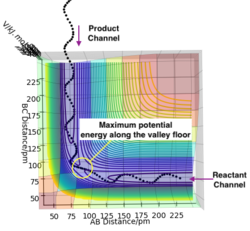
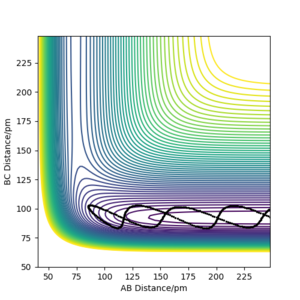
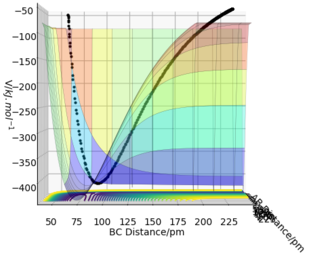
Figure 7 shows a surface plot of the H + H2 system. The product and reactant channels are orthogonal to each other, but are connected at the transition point at the bottom of the valley. The trail of black dots at the bottom of the potential signifies the trajectory followed by the system. The oscillatory nature of the trajectory implies the vibration of the diatomic A—B and B—C along their respective channels. Interestingly, as the trajectory always oscillates between contour lines of the same magnitude, it highlights that the law of conservation of energy is being observed.
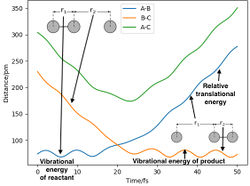
Figure 8 can be illustrated graphically in an "Interatomic Distances vs Time" graph.
After approximately 15 fs, the value of r2 increases from its original baseline value of 74 pm and continues to increase indefinitely. Meanwhile, r1 starts at the specified 230 pm and exhibits oscillatory behaviour after 25 fs. The distances r1 and r2 intersect at t = 20 fs (i.e. r1 ≈ r2).
Figure 9 shows an internuclear velocity - time graph for the system.
An oscillation for the first 15 fs is observed for A—B and B—C after approximately 23 fs, which implies vibration. The negative velocities for A—C and B—C for the first 15 fs imply the approach of atom C to the diatomic molecule A—B and likewise the positive velocities for A—B and A—C imply the distancing of atom A from the new diatomic B—C.
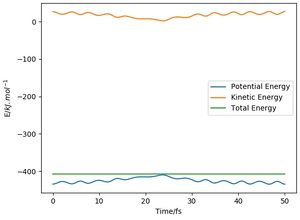
An energy-time graph was obtained (Figure 10). An increase and decrease in potential and kinetic energies respectively were observed, with oscillatory behaviour. However, the total energy remained constant with a straight line, again highlighting the law of conservation of energy.
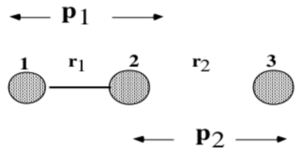
Figure 11 shows the momenta-time graph associated with the system. The momenta p1(t) and p2(t) relate to the bond displacements of r1 and r2 and not of the atoms involved. Momenta p1 and p2 are therefore the momentum values associated with the coordinates r1 and r2 respectively. The observations in Figure 11 can be explained using a diagram of the system, as in Figure 12. Initially, p2 decreases in absolute value while p1 is oscillatory. Since atom 2 feels a net momentum from p1 and p2, p1 therefore oscillates as a result until 25 fs where it crosses the x-axis and remains constant into a translational environment. The constant values suggest the detachment of atom A to form the lone H atom. On the other hand, p2 starts from a translational situation at -5.2 g mol-1 pm fs-1 and then ends in an oscillatory environment, signifying attachment to form the new diatomic.
Dynamics from the transition state region
Along a reaction coordinate, a transition state will be observed along a reactive trajectory. A transition state is defined as the maxima on the minimum energy path, travelling from the reactants to the products. However, the transition state is in fact not a local maxima - it is a saddle point[1] (illustrated in figure 13).
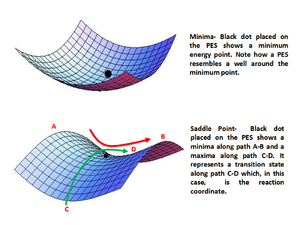
This means that in an orthogonal axis to the reaction coordinate, the TS will be observed as a minima. Mathematically, this can be described as . To distinguish the TS from other local minima, a line can be drawn orthogonal to the reaction coordinate. Along the graph, the energy will reach a minima, which coincides with the same location for the maxima in the energy-reaction coordinate graph in the orthogoal plane of the potential surface.
Locating the transition state
A reaction was run where the distances of A—B and B—C are equal and the species have no momenta. At the transition state, the atoms do not move, since they are at the lowest point in energy as shown by the contour lines in the potential well at a stationary point. As the gradient is related to the force, forces will go to 0 at the TS. The values of the initial forces along A—B and B—C can be plotted as a function of the distance separation in pm. Table 1 shows these results. A negative force implies attraction and positive forces imply repulsions, and hence separation.
| Simulation | Distance AB / pm | Distance BC / pm | FAB / kJ mol-1 pm-1 | FBC / kJ mol-1 pm-1 |
|---|---|---|---|---|
| 1 | 230 | 230 | - 0.483 | - 0.483 |
| 2 | 150 | 150 | - 1.759 | - 1.759 |
| 3 | 100 | 100 | - 1.166 | - 1.166 |
| 4 | 90 | 90 | + 0.132 | + 0.132 |
| 5 | 91 | 91 | - 0.037 | - 0.037 |
| 6 | 90.5 | 90.5 | + 0.046 | + 0.046 |
| 7 | 90.7 | 90.7 | + 0.012 | + 0.012 |
| 8 | 90.8 | 90.8 | - 0.004 | - 0.004 |
| 9 | 90.75 | 90.75 | + 0.004 | + 0.004 |
Using the results from table 1, the transition state for the H + H2 system exists at r1 = r2 = 90.8 pm (to 1 decimal place).
The relationship between r1 and r2 is expected since the surface plot is symmetrical, so we expect a symmetrical transition state in turn.
Figure 14 (below) shows a contour plot for the situation when AB and BC are 230 pm
Calculating the reaction path
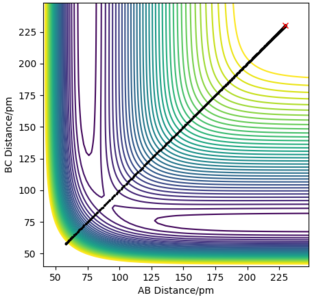
Figure 16 shows a minimum energy path (mep) from the transition state towards the entrance of the product channel. In this model, r1 = rts + 1 pm = 91.8 pm, r2 = rts = 90.8 pm and p1 = p2 = 0 g mol-1 pm fs -1
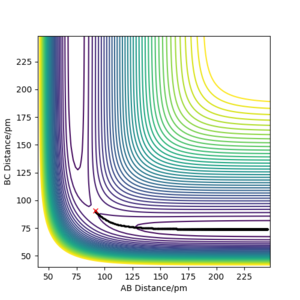
In comparison to the dynamic contour plot on Figure 5, there is an absence of the oscillation indicated by the wavy line. This is expected, since the trajectory corresponds to infinitely slow motion where the velocities and momenta are set to 0 after evey step. This is analogus to a ball on a sand place, where in this instance, the kinetic energy of the ball is removed and violating the conservational energy law. The MEP plot can be described as an infinitely dispersive system.
The reaction path follows the valley floor to H1 + H2—H3 as we are at the crest of our reaction coordinate and a displacement on the AB axis towards the reactant channel will lead the system towards the formation of our initial reactants.
An alternative is to consider an increment to r2 i.e. plot r1 = rts = 90.8 pm and r2 = rts + 1 pm = 91.8 pm. In this situation, the opposite plot will be observed. A displacement parallel to the BC axis will lead the system towards the product channel and hence lead towards the formation of our desired products, H1—H2 + H3.
Reactive and unreactive trajectories
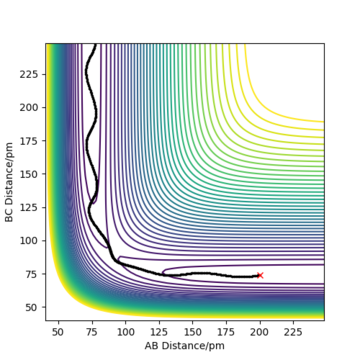
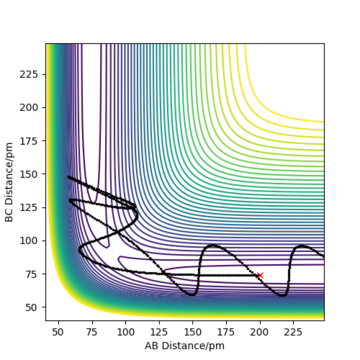
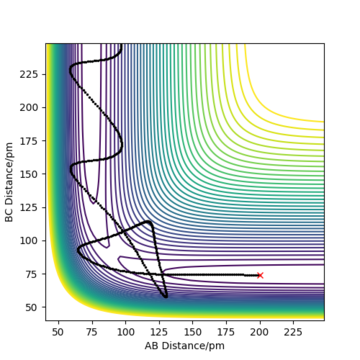
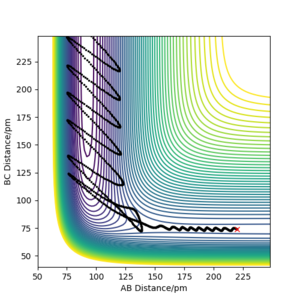
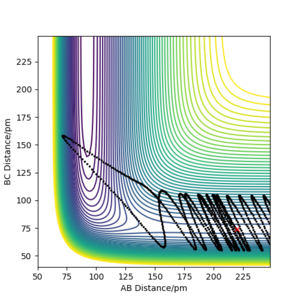
Table 2 shows the results of different trajectories run with different momenta combinations using r1 = 200 pm and r2 = 74 pm.
Figure 15 shows the system setup.
There is no relationship between ETOT or the total magnitude of the initial momenta and the reactivity of the trajectory.
From Table 2, there is no relationship between ETOT and whether the trajectory is reactive or unreactive. Additionally, there is no relationship between the combined magnitude of p1 and p2 and the reactivity of the trajectory. Between simulations 3 and 4, the total magnitude of momenta increases by 7.00 g mol-1 pm fs-1 from 8.20 to 15.20 g mol-1 pm fs-1 and the trajectory becomes unreactive in 4. However, a further increase of p2 by 0.5 g mol-1 pm fs-1 to 10.60 g mol-1 pm fs-1 between 4 and 5 changes the trajectory to reactive again. The system with the largest magnitude in total energy 2 at 420.077 kJ mol-1 but as ETOT decreases between subsequent simulations in the order 1, 3, 4 and 5, the trajectories oscillate between reactive and unreactive, implying no correlation between ETOT and the reactivity of a system.
These results can be compared to the transition state theory. The theory states that all collisions with kinetic energy KE greater than the activation energy Ea will result in the collision under selected assumptions
- The reactants can go to the TS and complete the trajectory to form the products.
- The products cannot reform the TS and hence reform the reactant species in the opposite direction.
This can be expressed as:
where R is the reactant, TS is the transition state and P is the product.
However, in simulations 4 and 5, the transition state theory does not explain the description of the dynamics as it violates the assumption that the products cannot reform the TS and reform the reactant species. The trajectory goes across the TS a second time to form the reactant. As a result, the TS theory overestimates the reaction rate. The assumption states the reaction will go to completion, although this is not the case. For instance, if 10 TS crossings were observed for the system, we assume that 10 instances of products are formed. In reality, only 1 instance would form a product (resulting in a 10% yield) and the remaining 9 other instances reform the reactants, giving a 90% loss.
A separate but valid assumption we also make is that the transition state theory ignores quantum tunnelling (QT). TS theory is a classical theory and therefore treats atoms classically, so quantum tunnelling is not accounted for as it contributes extremely small effects to the reactivity property of a trajectory. Solely with quantum tunnelling, we would be underestimating the rate of reaction, but as barrier crossing is a much larger effect, the overall result is that transition state theory overestimates the reaction rate as mentioned above. Correct, although not related to your results. Pu12 (talk) 20:20, 21 May 2020 (BST)
Exercise 2: F—H—H system
Setup
Two programs were set up separately with the following conditions
Program 1
| Distance r1 / pm (AB) | Distance r2 / pm (BC) | Momentum p1 / g mol-1 pm fs-1 (AB) | Momentum p2 / g mol-1 pm fs-1 (BC) | Atom A | Atom B | Atom C |
|---|---|---|---|---|---|---|
| 250 | 40 | 0.0 | 0.0 | F | H | H |
Program 2
| Distance r1 / pm (BC) | Distance r2 / pm (BC) | Momentum p1 / g mol-1 pm fs-1 (AB) | Momentum p2 / g mol-1 pm fs-1 (BC) | Atom A | Atom B | Atom C |
|---|---|---|---|---|---|---|
| 250 | 40 | 0.0 | 0.0 | H | H | F |
Determination of the thermodynamic properties of the FHH and HFF systems
The following plots are produced (Figure 15 and 16 for program 1 and 2 respectively).

In Figure 15, the reactant channel that is parallel to the BC axis is above the plane of the orthogonal product channel that is parallel to the AB axis. This shows that the reaction between F and H—H is exothermic. This is expected, since the H—F bond formed is stronger than the H—H bond broken, so more energy is given out when bonds are formed than taken in when bonds are broken. On the other hand, in figure 16, the reactant channel is below the plane of the product channel, suggesting that the reaction between H and H—F is endothermic. Since the H—F bond is stronger, more energy is taken in to break the H—F bonds than released when the weaker H—H bonds are formed, so overall the energy of the products is greater than the reactions.
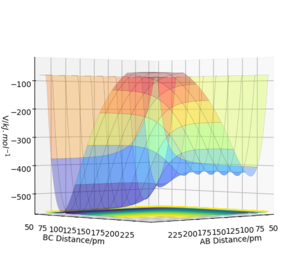
Figure 17 and 18 also represent diagramatically the initial geometries of atoms A, B and C.


Locating the transition state
A key property of the transition state is that any displacement from the crest of the TS, rts will result in the system falling down the surface plot in one of two directions towards the entrances of the reactant or product channels. This property can be used to locate the position of the transition states in both systems.
Hammond's postulate will provide an initial guide for the location of the TS.
The postulate states:
The transition state will resemble either the products or the reactants, depending on which is closer in energy.
In exothermic reactions, the TS is closer to the reactants than the products in energy, which is commonly coined as an "early" transition state. Correspondingly, in endothermic reactions, the TS is closer to the products than reactants in energy, so we coin this the "late" transition state.[2]
Figure 20 shows a contour plot for the F + H—H reaction.

The TS lies along the reactant channel, and the location can be seen to the position when the contour lines begin to pinch along the reactant channel. By keeping the distance BC constant (75 pm) and recording the direction of the reaction trajectory with different values of BC in the range 170 - 200 pm, the transition state can be located.
| Distance r1 / pm (AB) | Direction of reaction trajectory |
|---|---|
| 200 | Right (to entrance of reactant channel) |
| 190 | Right (to entrance of reactant channel) |
| 185 | Right (to entrance of reactant channel) |
| 180 | Left (towards product channel) |
| 181 | Right (to entrance of reactant channel) |
| 180.5 | Left (towards product channel) |
This is illustrated in figure 21.

A similar procedure can be done to find the position of the TS along the BC axis with AB set to 181 pm. Table 4 shows these results.
| Distance r2 / pm (BC) | Initial Direction of reaction trajectory |
|---|---|
| 100 | Down Right |
| 80 | Down Right |
| 70 | Up Left |
| 75 | Down Right |
| 74 | Up Left |
| 74.5 | Up Left |
From these results, it can be determined that the peak of the TS lies at (AB, BC) = (181 pm, 75 pm) to the nearest integer.
For the H + F—F system, the TS will lie along the product channel in comparison to the reactant channel as the transition state is late. Tables 5 and 6 show the results.
| AB is set to 75 pm, p1 = p2 = 0.0 g mol-1 pm fs-1 | |
| Distance r2 / pm (BC) | Direction of reaction trajectory |
|---|---|
| 200 | Up (to entrance of product channel) |
| 190 | Up (to entrance of product channel) |
| 185 | Up (to entrance of product channel) |
| 180 | Down (towards reactant channel) |
| 181 | Up (to entrance of product channel) |
| 180.5 | Down (towards reactant channel) |
| BC is set to 181 pm, p1 = p2 = 0.0 g mol-1 pm fs-1 | |
| Distance r1 / pm (AB) | Direction of reaction trajectory |
|---|---|
| 100 | Up (to entrance of product channel) |
| 80 | Up (to entrance of product channel) |
| 70 | Bottom (to reactant channel) |
| 75 | Up (to entrance of product channel) |
| 74 | Bottom (to reactant channel) |
| 74.5 | Bottom (to reactant channel) |
For the H + F—H system, the peak of the TS lies at (AB, BC) = (75 pm, 181 pm) to the nearest integer.
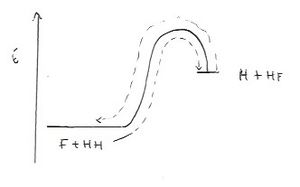
The positions of the TS are interchangable with the axes being represented. This is expected, since the two reactions can be plotted on the same graph. Figure 23 shows an illustration.
Calculating the activation energy
Given the positions of the transition states are known, the initial geometry information can be obtained for a reaction trajectory that starts at the transition state. As the Energy - Reaction coordinate graph levels off at large separations of reactant along the reaction coordinate, the asymptotic energy can be calculated using large separations of AB.
| BC is set to 75 pm, p1 = p2 = 0.0 g mol-1 pm fs-1 | |
| Distance r1 / pm (AB) | Energy total, ETOT / kJ mol-1 |
|---|---|
| 181 | - 433.938 |
| 350 | - 434.891 |
| 550 | - 434.931 |
| 750 | - 434.931 |
So the activation energy for the F + H—H system,
For the H + H—F system:
| BC is set to 92 pm, p1 = p2 = 0.0 g mol-1 pm fs-1 | |
| The total energy at (AB, BC) = (75 pm, 181 pm) is -433.938 | |
| Distance r1 / pm (AB) | Energy total, ETOT / kJ mol-1 |
|---|---|
| 92 | - 517.680 |
| 350 | - 560.657 |
| 550 | - 560.699 |
| 750 | - 560.700 |
| 900 | - 560.700 |
So the activation energy for the H + H—F system, All correct so far. Pu12 (talk) 20:20, 21 May 2020 (BST)
Reaction dynamics and the link to Polanyi's rules
Given that the F + H2 system is exothermic, there are two possible mechanisms for energy release - release of translational kinetic energy or release of vibrational kinetic energy.
If the reaction was observed in a bomb calorimeter with a water jacket, the water temperature would increase although the source of energy that gives rise to the temperature change would be difficult to determine. This is because translational KE is released as heat but vibrational KE is released as photons after vibrational relaxation, which can also be absorbed by the walls of the constant. Therefore, the bomb calorimeter cannot make the distinction as both mechanisms of energy release are radiative.
One possible method is to use Fourier-Transform Infrared-spectroscopy (FTIR). The H—H diatomic does not show an IR vibrational peak since unlike the H—F diatomic, it does not contain a net dipole moment. We can therefore measure the vibrational energy released using the emission of IR photons. Figures 22 and 23 show the situations observed in the diatomic of H—F.
Initially, the H—F will be at the ground state (Figure 20). This means that the molecules are at the lowest vibrational state. As the temperature increases, a portion of molecules can be elevated to the v = 1 vibrational energy level and then complete a transition from v = 1 to v = 2, highlighting the molecules are vibrationally excited. In an IR spectrum, the fundamental 0→1 transition is observed with the largest intensity, since most molecules are able to complete this transition. The 1 → 2 transition is observed at a lower wavenumber due to the smaller magnitude of energy required compared to 1→2.
Over time, vibrational relaxation will take place and eventually the molecules will return to the ground state. As a result, more 0→1 and fewer 1→2 transitions will occur, hence the 1→2 transition will decrease in intensity while the main peak will increase in intensity. These 1→2 transitions can therefore be used as a measure of how populated the excited states are, since they are only possible if the first excited state is populated.
Overall, if the mechanism of energy release was translational, a rise in temperature would increase significantly although there would be a smaller 1→2 band present. If the mechanism was via vibrational relaxation, a larger change in the 1→2 peak intensity would be observed in the IR spectrum.

4 different systems were set up to investigate the F + H2 and H + H—F systems. Table 9 shows the setup and results.
These results are indicative of Polanyi's empirical rules. The distribution of the total system energy alternates betwen vibrational and translational energy from products to reactants.
Polanyi's rules[3] are taken from his observations of reactions with early and late transition states, and how the quantities of energy of the reactants in the different modes can influence whether the reaction proceeds to completion.
For an exothermic reaction that contains an early transition state, it is more efficient that the reactants have little vibrational energy and high translational energy. In contrast, for an exothermic reaction containing a late transition state, it is more efficient that the reactants have high vibrational energy and low translational energy. The case for the exothermic reaction is justified by considering the bond length at the transition state - the H—H and H—F bonds needs to be elongated so greater vibrational energy will cater for the formation of longer bond lengths in a labile fashion. Table 9 shows that for exothermic reactions, reactants with high translational energy are converted into products with high vibrational energy. In contrast, for endothermic reactions, reactants with high vibrational energy are converted into products with high translational energy.
This relates to the discussion above regarding the mechanism of energy release. Since the products have high vibrational energy, the H—F molecules radiate the excess energy upon formation through vibrational relaxation and can be observed as an increase in temperature with a bomb calorimeter.
Excellent report, no obvious mistakes and thorough discussion in a professional style with many diagrams to assist. Pu12 (talk) 20:20, 21 May 2020 (BST)
References
- ↑ Weisstein, Eric W. "Saddle Point." From MathWorld--A Wolfram Web Resource. https://mathworld.wolfram.com/SaddlePoint.html Accessed 10 May 2020
- ↑ Eric V. Anslyn, Dennis A. Dougherty. Modern Physical Organic Chemistry, 2006, pp. 375-377
- ↑ Polanyi, J. C. Some Concepts in Reaction Dyanmics 08 May 1987: Vol. 236, Issue 4802, pp. 680-690

