MRD:01340400
Modelling a H + H2 system
Ng611 (talk) 21:44, 18 May 2020 (BST) 3/5 - in general, a good piece of work. It's a shame that you didn't manage to do the final section of the report though. More specific feedback is given throughout.
Potential Energy Surfaces
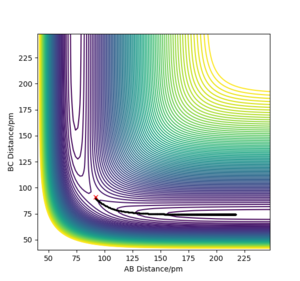
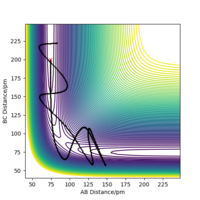
Chemical reactions can be modelled by using a potential energy surface diagram, which relates the potential energy to the positions of atoms in space. For a system involving three atoms, like the H + H2 system, the distances between the atoms can be described by the bond lengths between atoms A-B and B-C. This is shown for a successful collision of such a system by figure 1.
Ng611 (talk) 21:27, 18 May 2020 (BST) It is only possible to represent this system as a surface if we make one key assumption. What is it? Think about the angles of collision...
Transition States on Potential Energy Surface Diagrams
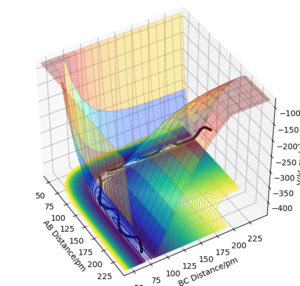
The potential energy of a transition state can be defined mathematically by the highest point along the lowest energy route between reactants and products on a potential energy surface. That is, it is a saddle point on a 3-dimensional surface where the relative distances between atoms make up the XY plane and the Z axis defines the potential energy of the system. The saddle point of a surface has the property ∂V(ri)/∂ri=0 or that it has a gradient of 0. In order to distinguish the transition state from local minima by differentiating the potential energy with respect to the x axis and then with respect to the y axis and multiplying them together. If it is a saddle point the results should be above and below zero respectively. When simulating a chemical reaction, the transition state can be easily estimated for symmetric systems, that is systems where the transition state lies upon a mirror plane of the potential surface between the reactant region and the product region. Whilst using this method, it was estimated that the TS bond length of each bond in H-H-H was 91 pm.
Ng611 (talk) 21:27, 18 May 2020 (BST) What directions on the PES do X and Y correspond to here?

Ng611 (talk) 21:29, 18 May 2020 (BST) Very very true. You're off by <1 pm though, so it's not a significant issue. How could you use the MEP calculation to more accurately estimate the TS?
Minimum Energy Path (MEP)
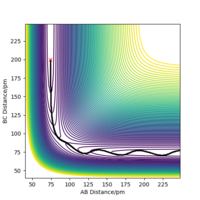
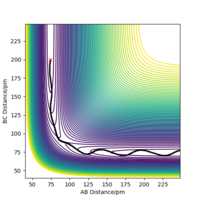
The minimum energy path (MEP) is a path along the valley floor of the potential energy surface. The MEP disregards any vibrational energy the molecule may have and so it outlines the minimum point at each step along the reaction path. The Dynamic pathway is distinct from the MEP as it includes the vibrations of a molecule. Therefore the pathways shown by each simulation differ, as the dynamic pathway will oscillate up and down the valley walls whilst the MEP will stay strictly at the lowest local point at all times (figure 3). Whilst simulating the MEP, a comparison between the internuclear distance and momenta against time shows that although the internuclear distance is increasing over time, the momenta of the atoms is constant at zero. This is because the MEP resets the momentum of the atoms to zero at each step of the simulation, which is how the program will negate any vibrational energy in the system.
Ng611 (talk) 21:31, 18 May 2020 (BST) Good!
Reactive and Unreactive Trajectories
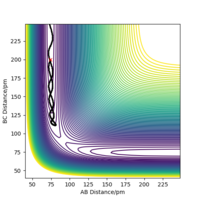
Not all collisions between molecular Hydrogen and atomic Hydrogen will result in a successful reaction. Whether a collision is successful or not is dependant on the relative magnitudes of momentum (kinetic energy) of each species. Below is a series of different initial trajectories from the same coordinates (figure 4). This table demonstrates how the total energy of the system is not a factor in the successful collision between the reacting species.
Ng611 (talk) 21:36, 18 May 2020 (BST) Slightly misleading here. The total energy *is* a factor here, but it isn't the *only* factor. In general, not having enough energy means you absolutely will not cross the TS (neglecting quantum effects), but having enough energy doesn't guarantee that you will cross the TS.
Transition State Theory
Transition State Theory (TST) is a powerful theory which helps predict the reaction rate for a given process. Unlike the Arrhenius Equation, TST takes into account temperature dependancy in the form of the pre-exponential values RCl and the partition functions. TST is an imperfect approximation of the reaction dynamics of a system, as it makes the following assumptions: the kinetic energy along the reaction coordinate follows the Boltzman Distribution; all reaction trajectories with an energy greater than the activation energy will be reactive; the motion of the system over the transition state is considered classically, and therefore doesn't take into account quantum effects such as tunnelling or quantisation of energy states; once a reaction has crossed over the transition state it cannot cross back over again; and finally that the reactants are in equilibrium with the transition state structure.
These assumptions mean that TST will overestimate the rate of a reaction when compared to experimental results, since a reaction system can cross over the transition state multiple times. Also, collisions which do initially cross over the transition state are counted as successful in TST but they may be counted towards the rate as a successful collision.
Ng611 (talk) 21:38, 18 May 2020 (BST) Excellent, and absolutely correct! If we were to include tunelling effects, how would it alter the rate and how significant would it be compared to TS recrossing?
Modelling F-H-H Systems
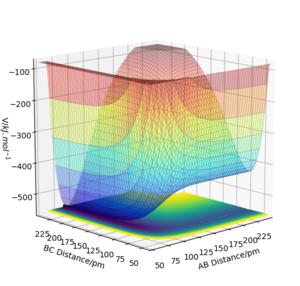
The reaction of a Fluorine atom with a H2 molecule to form HF + H is exothermic, whilst the reaction of Hydrogen Fluoride with a Hydrogen atom to form F + H2 is endothermic. This is seen in figure 5, which shows a potential energy surface for the F-H-H system. The lower potential energy seen at small AB distances (F-H bond formed) indicates that the F-H bond is stronger and more stable than that of the H-H bond. The formation of a more stable species will result in energy being dispersed to the surroundings, whilst the formation of a less stable species will require energy to promote that species to the higher energy level.
The energy barrier of the transition state in this diagram is relatively small, and is therefore difficult to discern by eye. However, using the information provided by the Hessian it can be estimated that the transition state occurs at F-H 181 pm and H-H 75 pm. Using Hammond's Postulate, we can infer that the structure of the transition state is similar to the structure of H2, since they are energetically so similar. The energy barrier for the reaction of H2 with F is 0.071 kJ.mol-1 and the energy barrier for the reaction of HF with H is 124.618 kJ.mol-1.
Ng611 (talk) 21:41, 18 May 2020 (BST) Your F+H2->H+HF barrier is somewhat too small, which suggests either your estimate for the TS is off, or that you've not separated the molecules enough.
Reaction Dynamics
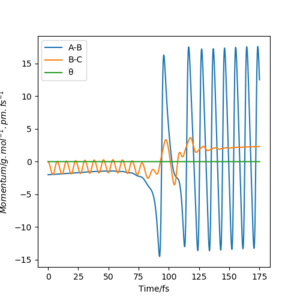
A successful reaction between F and H2 forms Hydrogen Fluoride and a Hydrogen atom can result in the HF molecule having a large vibrational energy. The molecule disperses this energy by emission of radiation to its surroundings via radiative decay. Figure 6 shows how the HF molecule (AB) retains a significant amount of momentum after the reaction is complete.
Ng611 (talk) 21:43, 18 May 2020 (BST) Good start. How would you confirm this experimentally?
Ng611 (talk) 21:43, 18 May 2020 (BST) Missing the final section on Polanyi's rules unfortunately...

