MRD:01333599
Molecular Reaction Dynamics Lab: Iman Safia Ilyas
Introduction
Molecular reaction dynamics allow us to understand the trajectory of a reaction and predict whether species will react with given inter-nuclear distances and momenta. This also allows the inter-nuclear distances where the transition state is, to be located, which is very important for knowing how reactions proceed. This report starts off with the simple system of:
Which progresses to a more complicated system with different nuclei:
and
Exercise 1:
The transition state on a potential energy surface diagram is mathematically defined as the maximum on the minimum energy path which links the reactants and the products. The Transition state is a saddle point.
This occurs when
We can differentiate the transition state from a local minimum by calculating second partial derivatives.
If the point is a local minimum: . If the point is a maximum, therefore the transition state, .
Concise and accurate. Well done.Sw2711 (talk) 22:58, 9 May 2019 (BST)
Locating the Transition State
The transition state can be estimated by equating the inter-atomic coordinates: . The momenta are equated to zero: .
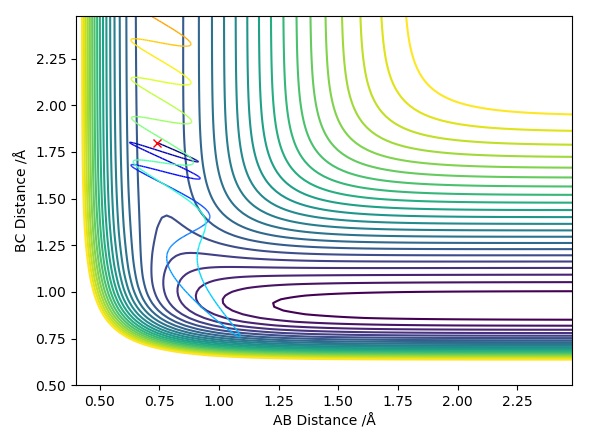
If we take a look at the animation plot, the point of that we are looking for occurs when the vibrational energy is the smallest as this is a form of kinetic energy. The inter-atomic distance with the least kinetic energy is favoured as the potential energy is maximised due to the conservation of total energy. My estimation for the optimum inter-nuclear distance is: . We can see that in the graph below that the oscillations are at their minimum as we almost have a straight line.
Good.Sw2711 (talk) 22:58, 9 May 2019 (BST)
Graph 1 - Inter-nuclear Distances Vs Time when
MEP Vs Dynamics Calculations and Trajectories
First we set and set
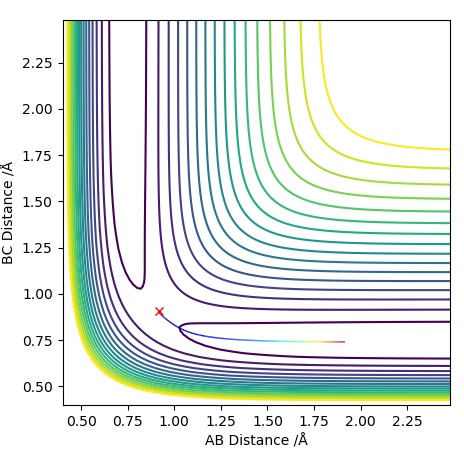
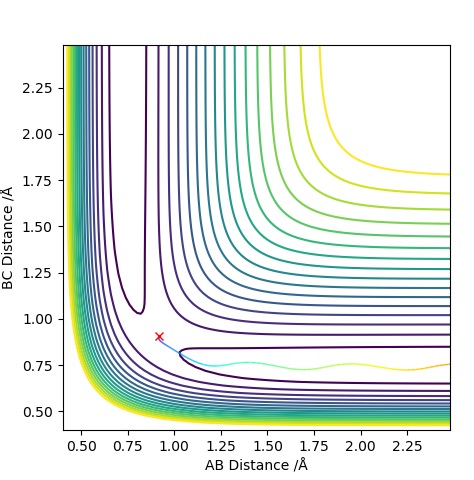
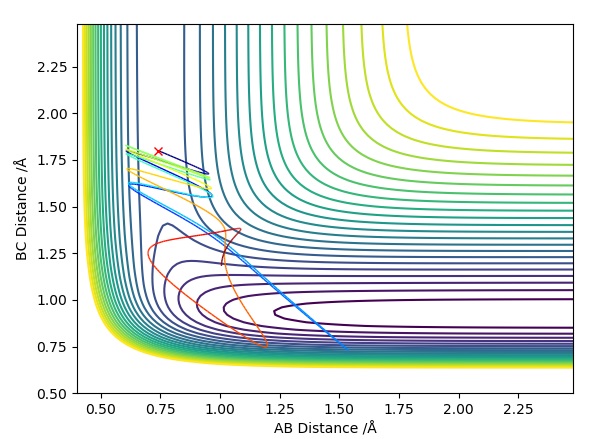
In the MEP diagram the trajectory is a straight line whereas in the dynamic plot, we see a an oscillating trajectory. This is because the MEP diagram disregards that atoms have mass, which causes this oscillatory behaviour in the Dynamic plot. MEP resets the velocity to zero at each step.Sw2711 (talk) 22:58, 9 May 2019 (BST) If the values of and were to be reversed, the graphs would also reverse. In the Momentum Vs Time graph, the lines for AB and BC would switch.
Graph 2 - MEP Contour Plot
Graph 3 - Dynamics Contour Plot
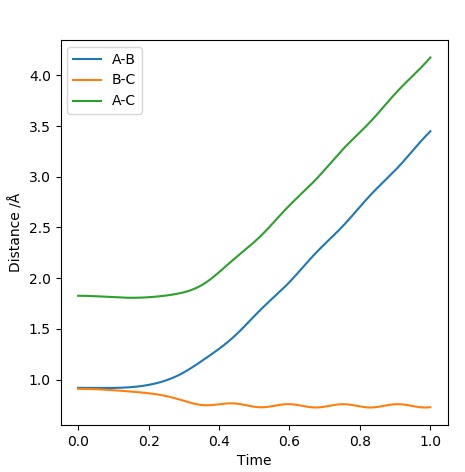
When looking at the Inter-nuclear Distances Vs Time Plot, the final positions are: and
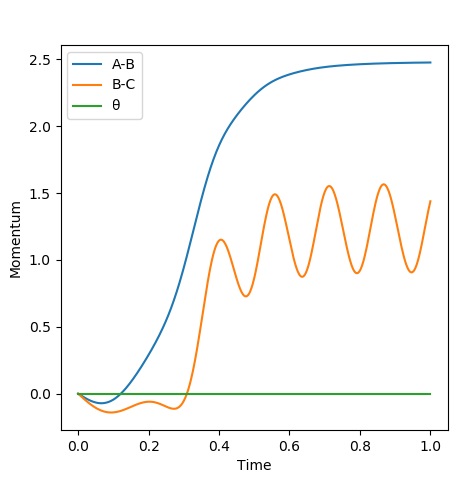
When looking at the Momentum Vs Time Plot, the average momenta at large t are: and Momentum has increased over time, but for BC after the momentum becomes oscillatory.
Graph 4 - Inter-nuclear Distances Vs Time
Graph 5 - Momentum Vs Time
Reactive and Un-reactive Trajectories
The momenta are going to be varied with fixed initial positions of and
This part is also very good.Sw2711 (talk) 22:58, 9 May 2019 (BST)
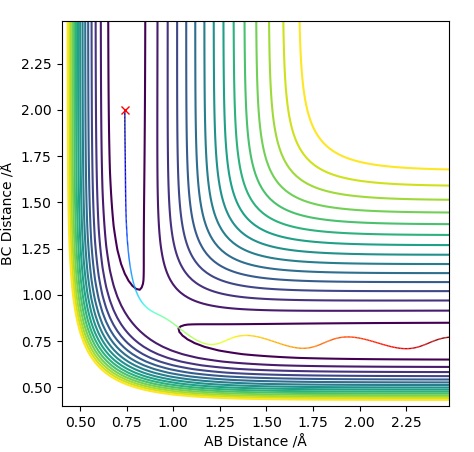
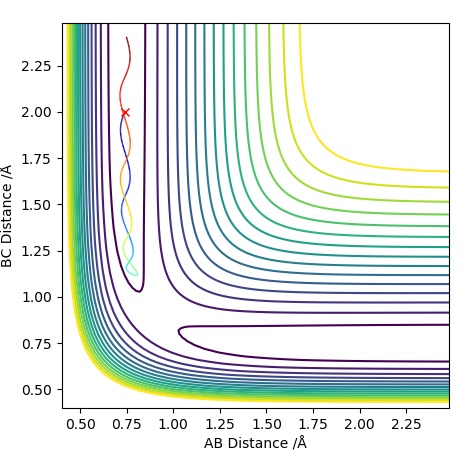
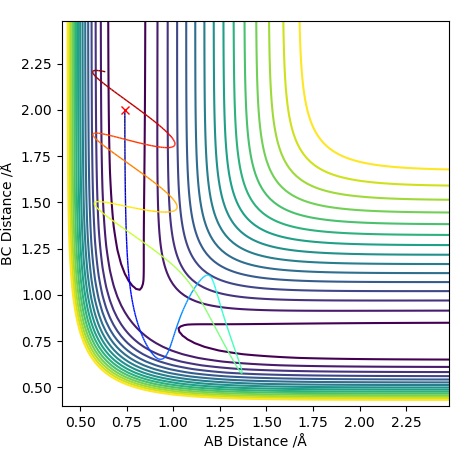
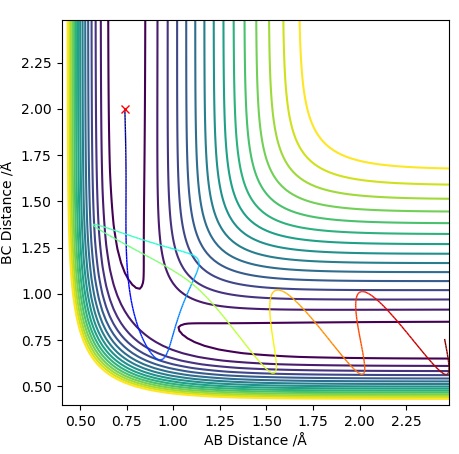
| p1 | p2 | Etot | Reactive? | Description of the dynamics | Trajectory Plot |
|---|---|---|---|---|---|
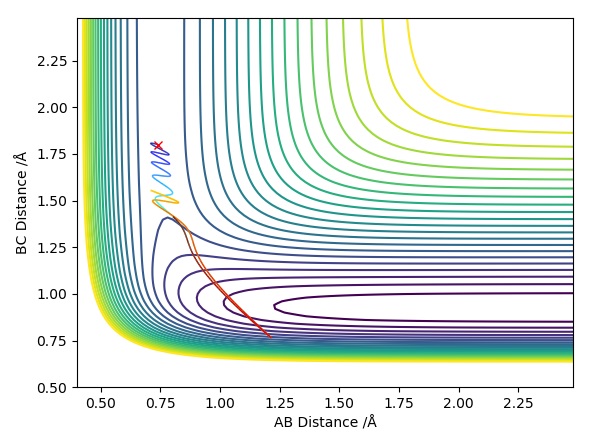
| -1.25 | -2.5 | -99.0 | R | As approaches , the A-B bond weakens and eventually breaks, forming the B-C bond then travels further away. Initially is fairly constant, till the transition state is crossed where it increases. The opposite occurs for which rapidly decreases until it exceeds the transition state where it follows a subtle oscillatory motion. | 1 |
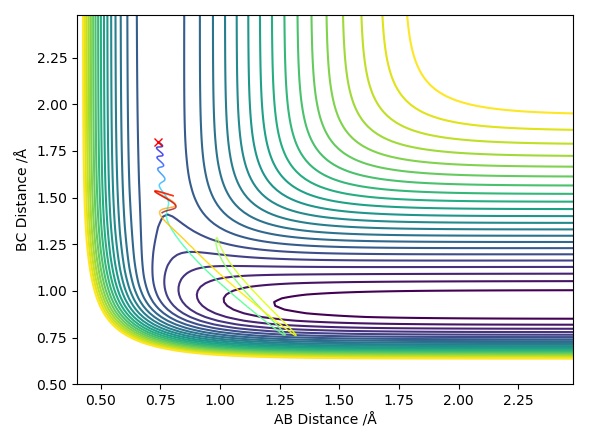
| -1.5 | -2.0 | -100.4 | UNR | When approaches it does not have enough energy to reach the transition state therefore the reaction cannot take place as we are assuming particles to follow classical mechanics. This makes it an unreactive pathway. After travelling towards , returns to the reactant state. | 2 |
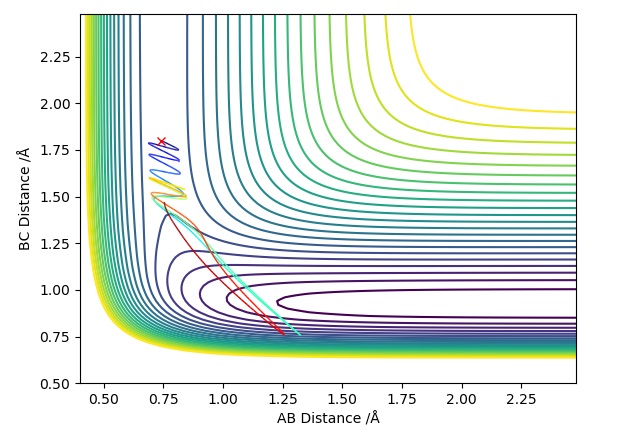
| -1.5 | -2.5 | -98.9 | R | When approaches , it does have enough energy to reach the transition state (known as the activation energy) for the reaction to proceed. With time travels towards and bonds with when the transition state is crossed, freeing atom . This is a similar situation to Trajectory Plot 1. | 3 |
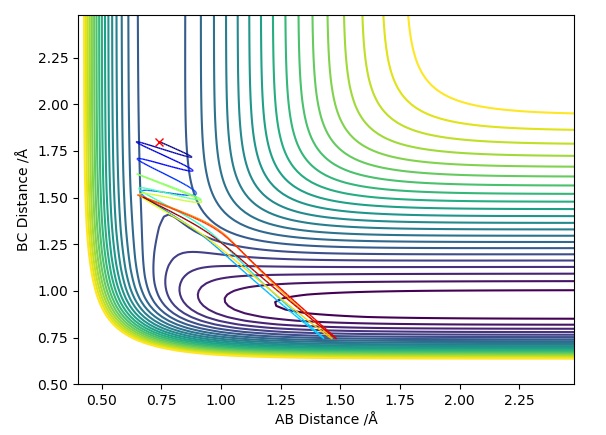
| -2.5 | -5.0 | -84.9 | UNR | In this plot we can see that although has passed the transition state, the overall reaction has not occurred. The momentum of BC is too high causing it to recross the transition state back to the reactants. As approaches it extends the A-B bond and attracts atom to itself, however due to the excess momentum of , it travels away and the A-B bond is reformed. | 4 |
| -2.5 | -5.2 | -83.4 | R | Initially as approaches it causes the A-B bond to weaken as the trajectory crosses the transition state. This is followed by the A-B bond reforming temporarily, however has enough momentum when travelling towards the second time to cause the A-B bond to break causing to be free and a B-C bond is formed. The transition state is crossed three times, the first time when approaches , the second just before the A-B bond reforms and a third time just before the B-C bond is permanently formed to form and . | 5 |
Trajectory Plot 1
Trajectory Plot 2
Trajectory Plot 3
Trajectory Plot 4
Trajectory Plot 5
Transition State Theory
Transition state theory assumes that all reacting atoms and molecules are classical particles. Tunnelling effects, which are explained by quantum mechanics, are ignored. The Born-Oppenheimer approximation is also assumed which says that nuclear and electronic motion are separated. Another assumption made is that once the system has reached the transition state with a speed towards the product states, it will form the product and won't return to the initial state. It is also assumed that the atoms in the reactant states are Boltzmann distributed however since the system only has three atoms it is less likely that this assumption is taken into account. In order for a reaction to possibly occur, the transition state must be crossed at least once. As we see from our trajectory plots above, if it is crossed an odd number of times, the reaction will occur. If it is crossed an even number of times the reaction will not occur. Transition state theory predictions of reaction rates has not generally been successful and do not directly match up with experimentally obtained rates.
You have researched and explained well. Well done.Sw2711 (talk) 22:58, 9 May 2019 (BST)
Exercise 2:
Reaction 1:
We can classify this reaction as exothermic as the product is more stable, therefore the transition state is closer to the reactants in energy than the products.
The H-F bond strength is stronger than H-H as Fluorine is a much more electronegative element than Hydrogen so it has a strong charge, pulling most of the electron density towards itself, shortening the bond, thus making the forward reaction more exothermic as the products are more stable. Fluorine's 2s orbital also overlaps well with the Hydrogen 1s orbital forming a strong bond.
Good explanation.Sw2711 (talk) 23:07, 9 May 2019 (BST)
A possible set of conditions for this reaction to occur:
This Graph shows the potential energy surface of Reaction 1, under possible reactive conditions.
Reaction 2:
This reaction can be classified as endothermic as the reactants are more stable than the products, therefore the transition state is closer to the products in energy than the reactants.
Good.Sw2711 (talk) 23:07, 9 May 2019 (BST)
A possible set of conditions for this reaction to occur:
This graph shows the potential energy surface of Reaction 2, under possible reactive conditions.
Locating the Approximate Transition State:
To locate the transition state we allow the momenta to equal zero. For reaction 1, since it is exothermic, according to Hammond's postulate, the transition state energy will be similar to the reactant energy, therefore it will be similar to the initial inter-nuclear distances we have above. If we see the Potential energy surface graph below, we see that the transition state is localised to one point, which is the maximum in the minimum energy path.
Approximate transition state for F - H - H system: and
Graph showing Potential Energy Surface When the Above Conditions are True
Very good.Sw2711 (talk) 23:07, 9 May 2019 (BST)
Activation Energies:
The activation energy is the energy difference between the reactants and the transition state. The activation energy for reaction 1 will be a lot smaller than reaction 2 as the H-F bond is very strong and stable, meaning that it is very hard for HF and H to have a reactive trajectory.
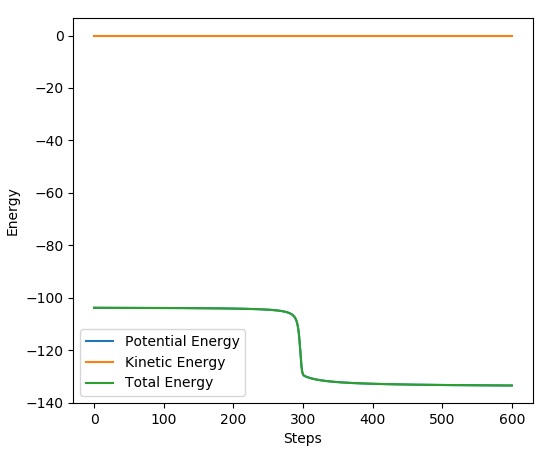
This part is also good, just where is your energy vs time plot for reaction 1?Sw2711 (talk) 23:07, 9 May 2019 (BST)
The transition state energy is
For Reaction 1:
Energy of Reactants =
Energy difference between reactants and Transition state:
Activation energy for Reaction 1:
For Reaction 2:
Energy of Reactants =
Energy difference between reactants and Transition state:
Activation energy for Reaction 2:
Reaction Dynamics of
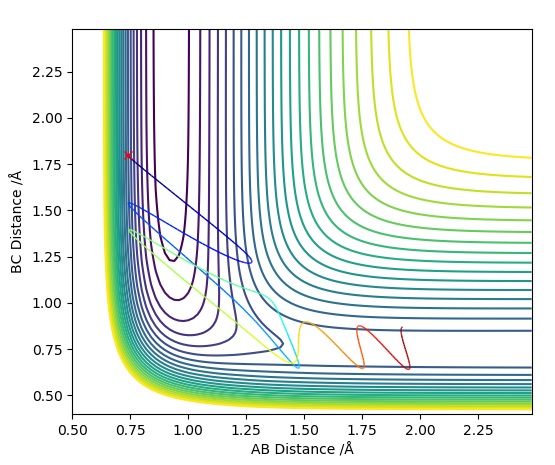
A possible set of conditions for this reaction to occur had been found experimentally:
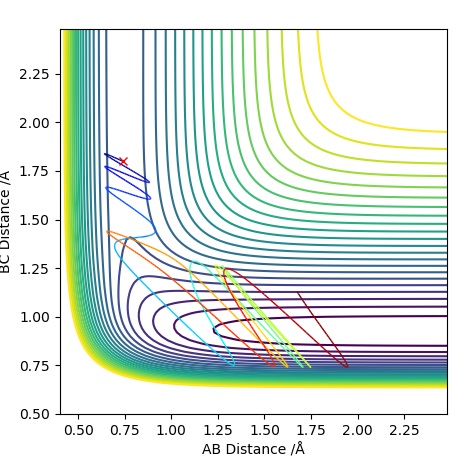
This Graph shows the contour plot of the above reactive trajectory:
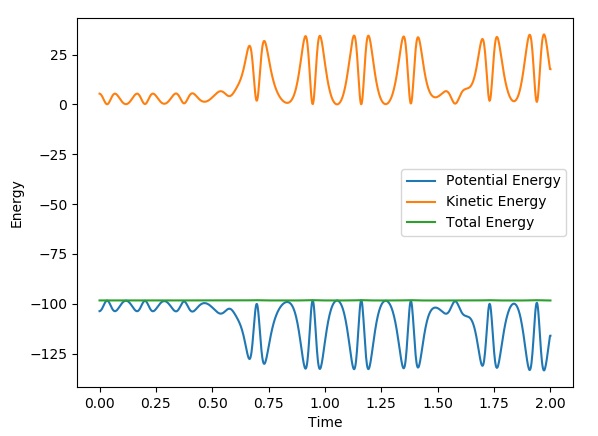
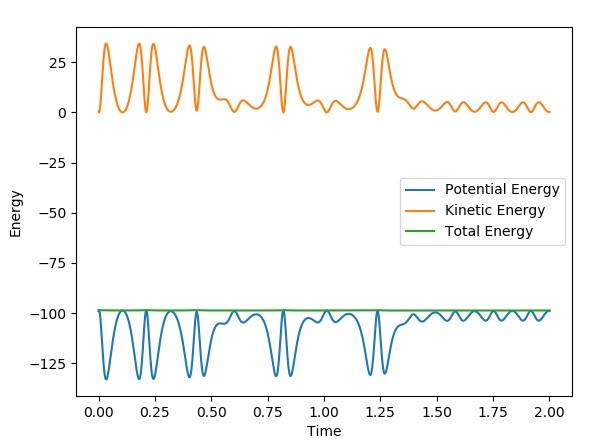
This graph shows the conservation of energy of the above reactive trajectory:
It can be seen that energy is conserved in the above graph. The kinetic and potential energy mirror each other in such a way that when kinetic energy is minimised, potential energy is maximised and the total energy is always constant. This holds true for reaction 2 as well. We can confirm the conservation of energy via calorimetry, due to the fact that both types of energy can be measured using changes in heat. An increase in heat energy is due to kinetic energy and a decrease in heat corresponds to potential energy.
Good.Sw2711 (talk) 23:07, 9 May 2019 (BST)
Varying the Values for Momentum for Reaction 1:
Initially we keep the distances and constant as well as and vary between -3 and 3.
Momentum Vs Time Graph for
This is an un-reactive pathway. The trajectory briefly crosses the transition state and forms the H-F bond, but this is short lived and eventually the system returns the the reactant state.
Momentum Vs Time Graph for
This is a reactive pathway as the H-F bond forms permanently at the end of the trajectory.
Momentum Vs Time Graph for
This is an un-reactive pathway where the trajectory shows us that it ends up back with the reactants.
Momentum Vs Time Graph for
This pathway is un-reactive as the trajectory does cross the transition state to form the H-F bond, this quickly breaks and forms the reactants again.
Momentum Vs Time Graph for
This is an un-reactive pathway. the trajectory crosses the transition state and forms the stable H-F bond temporarily but this quickly breaks apart to reform the reactants.
Momentum Vs Time Graph for
This is an un-reactive pathway that crosses the transition state a couple times to form the H-F bond but it is not stable enough to permanently form, therefore the trajectory heads back towards the reactants.
Momentum Vs Time Graph for
This is an un-reactive pathway, where the reactants have sufficient energy to cross the transition states and temporarily form the H-F but revert back to the reactants.
Momentum Vs Time Graph for
This is an un-reactive pathway, which briefly forms the H-F bond but this quickly reforms the reactants.
Momentum Vs Time Graph for
This is an un-reactive pathway, where the trajectory crosses the transition state a couple times but eventually reverts back to the reactants
The conditions are now:
-
-
-
-
Which gives us the contour plot shown below:
This shows us an un-reactive pathway, whereby the transition state is crossed multiple times, so the H-F bond is formed briefly each time, however it has not been stable enough to form the products. This results in the trajectory heading back towards the reactants for the final stage.
Very good effort here. Sw2711 (talk) 23:07, 9 May 2019 (BST)
Reaction Dynamics of:
A possible set of conditions for this reaction to occur had been found via trial and error:
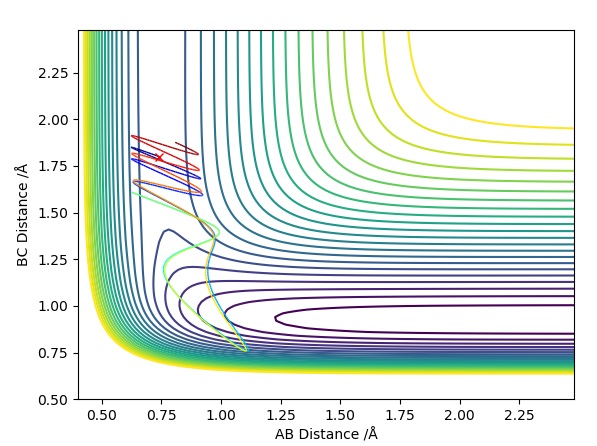
This Graph shows the contour plot of the above reactive trajectory:
This graph shows the conservation of energy of the above reactive trajectory:
Varying the Values for Momentum for Reaction 2:
Initial conditions for a reactive Trajectory have been found via trial and error:
This Contour Plot shows a reactive pathway with the above conditions
We see that the trajectory crosses the transition states a few times to form the H-F bond which quickly dissociates many times, but overall, the trajectory follows through into the product states forming the H-F bond completely.
Polanyi's Empirical Rules:
Polanyi's rule state that vibrational energies are more efficient at promoting a later transition state than translational energy. For reaction 1, we have an early transition state as the transition state resembles the energy of the reactants using hammond's postulate. This means that translational energy is more efficient at promoting this early transition state, which is an exothermic reaction. For reaction 2, we have a later transition state as the transition state resembles the energy of the products, meaning that vibrational energy affects the efficiency most. This is for an endothermic reaction. The optimum energy for the two must be found to allow a reaction to occur.
Very good. Do you find this helpful to find a reactive setting for the previous experiment?Sw2711 (talk) 23:07, 9 May 2019 (BST)


