MRD:01327311
EXERCISE 1: H+H2 system
Dynamics from the transition state region
Relating the transition state with a potential energy surface
Consider a triatomic reaction: A + BC → AB + C. To map out the potential energy of the system, there are three variables involved: 1)bond distance AB 2)bond distance BC and 3) the angle between the three atoms (ie the angle of approach of A). Assuming that the three atoms are collinear, we can simplify to a 3D potential energy surface (PES).[1]
On a potential energy surface diagram, how is the transition state mathematically defined? How can the transition state be identified, and how can it be distinguished from a local minimum of the potential energy surface?
The minimum energy of a system is given when the first differential of potential energy (V) with respect to the bond distance (r) is equal to zero. As this is a triatomic system, the minima of both distance AB and BC must be considered. The distances at which both of these conditions are satisfied where dV/dr1=dV/dr2=0 gives the bond distances of the transition state, hence distinguishing it from other potential minimas.
Whilst you are right that the TS will be found somewhere along the minimum energy pathway there are details missing from this explanation.
The transition state is a saddle point on the potential energy surface (PES) defined by the two distances AB/BC, this means simultaneously a minimum and a maximum. Look at the diagram in the script for an example of the shape of the PES at this point.
To find a transition state, once you have found the lowest energy pathway you then need to find the maximum of this new function. Also remember that you need to evaluate 2nd differential of stationary point to see if you are at a minimum or a maximum, it is not enough to take the 1st differential. Mak214 (talk) 14:14, 13 May 2019 (BST)
Defining the transition state position
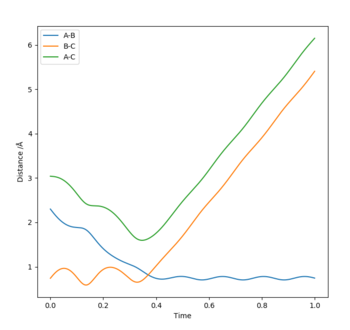
Report your best estimate of the transition state position (rts) and explain your reasoning illustrating it with a “Internuclear Distances vs Time” plot for a relevant trajectory.
The bond distances of the transition state for the following reaction: H2+H → H+H2 are all equivalent as we are dealing with a triatomic system with all equivalent atoms. From the "Internuclear distance vs time" plot, we see that the TS is achieved at t=0.37s where the bond length of A-B (blue) and B-C (orange) intersects, hence equal. Reading the y-coordinate of this intersection, we see that r1=r2=0.92Å.
The distance given is simply an estimate as it is not truly the TS distances because the forces along AB and BC are non-zero. Force is equivalent to the first differential of V with respect to r, hence the non-zero value does not satisfy the condition of a transition state as defined previously.
OK. Note that you can find the transition state distances even more accurately than this by setting the momentum of both AB and BC to 0, encouraging the reaction to get stuck in the transition state configuration. Mak214 (talk) 14:24, 13 May 2019 (BST)
Comparing reaction trajectories calculated for MEP and Dynamic mode
Comment on how the mep and the trajectory you just calculated differ.
Using the value of rts=0.92Å, the following values were substituted: r2=rts and r1=rts+0.01 with p1=p2=0. The reaction does not take place. However we see interesting differences between the calculation done by MEP and Dynamic mode by comparing their surface plots and internuclear distance vs time plot.
Surface plot
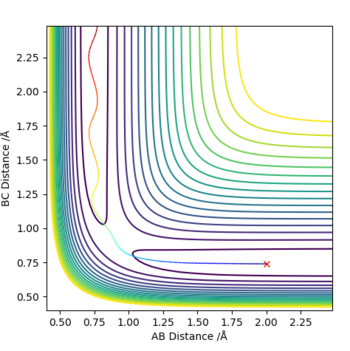
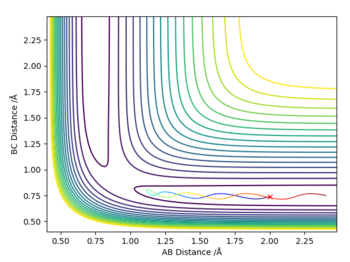
The surface plots generated by both calculations are given below.
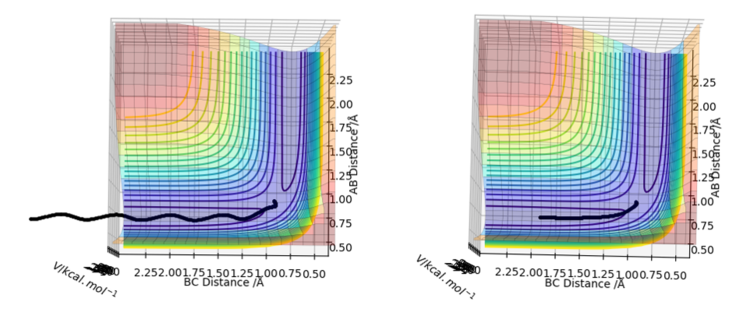
The key difference between the results of the two calculations is the straight line shown in the MEP mode (right) but the curved pattern on the Dynamic mode (left) along the axis of distance BC. The oscillating behaviour of the Dynamic mode represents the vibrational motion of the system where length BC changes with a specific period. On the other hand, the straight line on the MEP calculation neglects this oscillating behaviour and simply considers the translational motion of the system as seen from the unchanging value of distance AB.
Internuclear distance vs time
The internuclear distance vs time plots generated by both calculations are given below.

The linear increase of length BC in the dynamics mode suggests that atom C moves away from molecule AB infinitely with time. The sinusoidal pattern of length AB backs up the oscillating behaviour also seen in the surface plot as highlighted before. The constant momentum of atom C at 2.46289 shows a constant velocity away from AB. The oscillation of AB is also shown between values of 1.70807 and 0.758331. The final value of the bond distance AB at time 1 is 3.453, and BC is 0.7177. In contrast, the MEP projects an asymptotic relationship of length BC and time where it nears a value of approximately 2.15661 angstroms. Both were done with settings of 500 steps, hence can be thought of an equal x-axis scale.
Comparing results with settings of r1-rts and r2=rts+0.01 The values and profile shown on each of the graphs does not change in magnitude. This is as expected as the triatomic system are all identical atoms hence the conditions are essentially identical as well if they are indistinguishable atoms. The labelling of the lines invert on the internuclear distance plot, and the black line on the surface plot is now reflected such that it extends along the AB bond axis.
This does not explain why the two calculations MEP and Dynamics have given you a different plot. The reason that you see the oscillating behaviour for the dynamics simulation is because the calculation remembers how much momentum the particles have after each timestep, meaning that if they reach a minimum stationary point on the PES they may still rise back out of this if they had some momentum. However for the MEP the residual momentum is reset to 0 after each timestep, meaning that once a stationary point is reached there is no force to move the particles. Mak214 (talk) 14:29, 13 May 2019 (BST)
Reactive and unreactive trajectories
Momentum and the success of the reaction
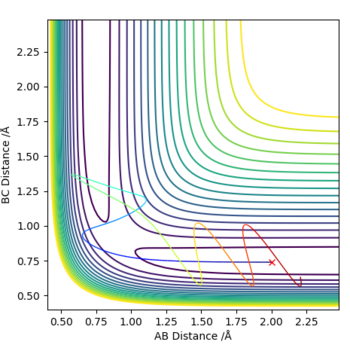
Complete the table above by adding the total energy, whether the trajectory is reactive or unreactive, and provide a plot of the trajectory and a small description for what happens along the trajectory. What can you conclude from the table?
From the table, we can conclude that the reaction does not proceed from simply increasing the momentum of one component of the system. As we go down the table, the momentum of BC(p1) increases, however does not correlate to the reaction's success. The momentum of the components must be better matched for the reaction to proceed. When p1=-1.5, the reaction is unsuccessful at p2=-2.0 however successful at p2=-2.5. When p1 is increased to p1=-2.5, the momentum of p2=-2.5 is no longer sufficient, and the reaction only proceeds when p2=-5.2.
Transition State Theory
State what are the main assumptions of Transition State Theory. Given the results you have obtained, how will Transition State Theory predictions for reaction rate values compare with experimental values? The transition state theory (TST) "allows one to obtain the reaction rate constant from the molecular properties of the reactants and the ones corresponding to the TS" (Gert. D. Billing 1996) To elaborate further, on top of the reaction kinetics from the collision theory, the TST tries to better understand the activation energy of the system. Therefore, not only does it approach the reaction rate from a statistical point of view, but also consier the thermodynamic perspective. The main assumption of the TST are the following [2]:
1) the molecules in the reaction have an energy distribution following the Boltzmann distribution
2) the reactant is in equilibrium with the transition state
3) once the reactant has achieved a transition state, it cannot revert back into the original reactant, but proceeds as a product.
The third assumption has major implications for the discrepancy between experimental and theoretical reaction rate values where the experimental rate will be slower than the theoretical. Conditions of the 5th row (p1=-2.5, p2=-5.2) provides a reaction dynamic that produces the TS conformation three times, indicating the reversal from the TS into the reactants that opposes the third assumption of the TST. The reversals can be confirmed from the graph (internuclear distances). Distance AB (blue) and BC (orange) intersect three times where rAB=rBC, confirming the formation of the TS confirmation three times. The first formation of the TS is at 0.16s, however at 0.20s, distance AB starts o increase again, indicating that the transition state had reverted back to a conformation closer to the reactants. Therefore, we see that the third assumption fails in this particular case, slowing the rate of reaction although it had converted to the products eventually. The reaction rate is significantly more inhibited for conditions in the 4th row (p1=-2.5, p2=-5.0) as the transition state reverts back from the products to the reactant, and the reaction is unsuccessful.
Nice discussion. Mak214 (talk) 14:44, 13 May 2019 (BST)
EXERCISE 2: F - H - H system
PES Inspection
Determining reaction profile from surface plot
By inspecting the potential energy surfaces, classify the F + H2 and H + HF reactions according to their energetics (endothermic or exothermic). How does this relate to the bond strength of the chemical species involved?
The reaction profile for the following system was investigated: 1) H+HF → H2 + F and 2) H2 + F → H+HF where the atoms were each set to A,B,C from the left respectively.

Inspection of the surface plot indicates whether the reaction is exothermic or endothermic as it computes the potential energy of the system at two extremes; when rAB is large (ie the reactants are far apart), and rBC is large (ie the reactants had successfully reacted to the product where the original molecule is now split). Looking at the surface plot of (1), the potential of the system increases from when rAB is large, to the other extreme when rBC is large. This means that the reactant side has a lower potential than the product side. Therefore, the increase in potential indicates that the reaction is endothermic. However the surface plot of (2) shows that the potential decreases from large rAB to large rBC suggesting the exothermic reaction profile. This is consistent with the analysis that can be done with bond enthalpies, where we can compare the bond dissociation energy of the reactant and the products. The bond dissociation energy of HF (565 kJ mol-1) is larger than H2 (436 kJ mol-1) so reaction profile (1) would show an endothermic reaction as energy must be absorbed from the surroundings as it is more energetically taxing to break the H-F bond than form the H-H bond. Naturally, the opposite reaction scheme of (2) would be exothermic.
Great. Please remember to reference where you got this bond enthalpy data from in future. Mak214 (talk) 14:51, 13 May 2019 (BST)
Locating the transition state
Locate the approximate position of the transition state.
To locate the transition state of the system, the settings of the molecules were changed so that both momentum of AB and BC are equal to 0. The distances AB and BC were adjusted so that the forces along A-B-C will be equal to 0. Knowing the reaction profile (exo/endothermic) and the equilibrium bond length of H2 (0.74Å) and HF (0.91Å), we can use Hammond's postulate to estimate which bond is elongated or shortened and to what extent to make an educated guess on the transition state [3]. Reaction (1) is has an endothermic reaction profile as discussed, hence goes through a late TS, where the confirmation is more similar to the products than the reactants. This implies that the HF bond is elongated to near the product. In a similar way, reaction (2) is has an exothermic reaction hence goes through an early TS suggesting that the H-H bond length is contracted in the TS. Upon these two implications, the distances were adjusted until the force was calculated to be approximately 0, indicating that the transition state positions were successfully defined as: F-H=1.81 and H-H=0.75.
Well explained Mak214 (talk) 14:53, 13 May 2019 (BST)

Activation Energy
Report the activation energy for both reactions. The activation energy (Ea) was found by the difference in potential between the potential of the reactant side and the potential of the TS. The potential of the TS was calculated from the parameters set as above to give -103.752 kJ mol-1. The potential of the reactants were found by setting the rBC as the optimal distance of the molecule (H2=0.74pmangstom and HF=0.91angstrom) and rAB as 100 assuming that it is 'infinitely' apart hence the interaction between the atom and the molecule is negligible. The potential energies found and thus the Ea calculated was as follows:
| System | PE (kJ mol-1) | Energy calculation | Ea (kJ mol-1) |
|---|---|---|---|
| (1) H+HF | -134.025 |  |
30.273 |
| (2) H2+F | -104.02 |  |
0.268 |
As the TS configuration requires a distance of F-H (1.81 ang) almost double the length of its optimal distance (0.91 ang), naturally reactants (1) would require a much higher activation energy than of reactants (2) where H-H had hardly changed. Therefore, the loss of attractive forces between H-F and increase of repulsive forces between H-H to achieve the TS lead to the increase in potential of the system as reflected by the activation energy.
Great!Mak214 (talk) 16:50, 13 May 2019 (BST)
Reaction Dynamics
Mechanism of the release of energy
In light of the fact that energy is conserved, discuss the mechanism of release of the reaction energy. Explain how this could be confirmed experimentally.
Consider the reaction of F+H2 → HF + H. The conservation of energy is proven from the energy vs time graph where total energy (green) stays constant, and PE and KE are symmetrical along the total energy indicating its conjugate property. The mechanism of the release of reaction energy is via the vibrational energy of the newly formed FH molecule. The oscillating behaviour of the FH molecule can be seen from the momentum of AB (blue) in the momentum vs time plot. This mechanism of the release of energy can be confirmed by emission spectroscopy where the oscillation of molecule FH will be detected in the IR region will be emitted.
Good. Mak214 (talk) 16:52, 13 May 2019 (BST)
Polanyi's theory
Discuss how the distribution of energy between different modes (translation and vibration) affect the efficiency of the reaction, and how this is influenced by the position of the transition state.
The reactant side's potential energy where AB distances are large is known as the entrance channel and the exit passage refers to the product's where BC distances are large. The location of the energy barrier within the entrance channel implies that the configuration of the transition state is more similar to the reactants than the products, and the opposite is true if the barrier is in the exit channel. This can be related to Hammond's postulate where the former refers to an early TS and the latter, a late TS.
The reactants' energy distribution between translational and vibrational energy must be appropriate to the location of the energy barrier for the reaction to succeed. Polanyi states that for an early TS, reactants with energies predominantly in the translational mode is favoured, and for a late TS, energy in the vibrational mode is favoured.[3] The energy changes the system undergoes along the reaction coordinate can be understood in analogous to a ball travelling along the potential well. Considering a reaction with a late TS, excessive translational energy of the reactants would simply cause the ball to bounce off the wall and never overcome the well (ie never reach the energy barrier and transition into the exit channel). However, with vibrational energy, the reactants may be in the appropriate phase to overcome the well and reach the energy barrier in the exit channel. Considering a reaction with an early TS, the energy of the system should predominantly in the translational mode. The straight motion of the atom colliding with the molecule possesses enough energy to overcome the energy barrier in the entrance channel. If the reactants were to have energy predominantly in the vibrational mode, it would 'waste' its energy into an oscillating motion hence fail to overcome the barrier.
This is exemplified by the two different sets of parameters used for the reaction: H+HF $rarr; H2+F. The reaction is an endothermic reaction as discussed before. Therefore it is expected that reactants with high vibrational energies will successfully react.
Two extremes were tested where the momentum parameters were adjusted so that parameters (A) had a higher distribution of vibrational energy (pHH=-1,pHH=-30) and parameters (B) in translational energy (pHH=-3,pHH=-1).

The contour plot for a high translational energy simply shows the reactants rebounding back and never forming the products. However, with enough vibrational energy the reaction takes place as distance BC increases as well.
Good. Mak214 (talk) 16:56, 13 May 2019 (BST)
References
- ↑ Steinfeld, J., Francisco, J. and Hase, W. (1999). Chemical kinetics and dynamics. Upper Saddle River, N.J.: Prentice Hall, p.221.
- ↑ Nilsson, A., Pettersson, L. and Nørskov, J. (2011). Chemical Bonding at Surfaces and Interfaces. Elsevier Science.
- ↑ 3.0 3.1 Steinfeld, J., Francisco, J. and Hase, W. (1999). Chemical kinetics and dynamics. Upper Saddle River, N.J.: Prentice Hall, p.299.

