MRD:01235058220518
Potential Energy Surface, Transition State and Minima
At the transition state of the reaction, the potential energy surface is at a maximum following increase in energy from from the reactants' energy, equal to the activation energy. At this ridge point, ∂V(ri)/∂ri=0 . There is a point where the potential energy graph direction changes direction to be orthogonal to the direction of the reactants, the point where the graph changes direction is at the transition state. Likewise, at a minimum in the potential energy surface ∂V(ri)/∂ri=0.
Jas213 (talk) 22:26, 28 May 2018 (BST)What about the second derivative?? You need it to differentiate between the two.
Position of the Transition State, rts
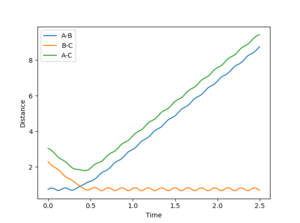
Figure 1 shows the plot of internuclear distance against time with the given parameters of r1= 0.74, r2= 2.30, p1= 0, p2= -2.7. The transition state is symmetrical, and occurs where the distances r1 = r2 = 0.908 Angstroms- at this internuclear distance, ∂V(ri)/∂ri=0 are satisfied. To locate the radii of the transition state, the momenta of AB and BC were set to zero in order to remove the tendency of the atoms to be carried by their momenta away from one another once reaching the transition state radii. The graph of internuclear distance vs. time, Figure 2, thereby shows a straight line of zero gradient, illustrating that the internuclear distance is not changing with time.

Dynamics and Minimum Energy Pathway, MEP
The minimum energy reaction pathway given by the system with infinitely slow molecular motion and zero moment of inertia. Oscillation due to vibrational energy is observed in the 'dynamics' plot, however in the MEP plot there is no observed vibrational oscillation. Figure 3 shows the internuclear distance vs. time MEP at a slight deviation of r1 from 0.908 at the transition state to 0.918. Momenta remained at zero and r2 remained at the radius for the transition state rts= 0.908.
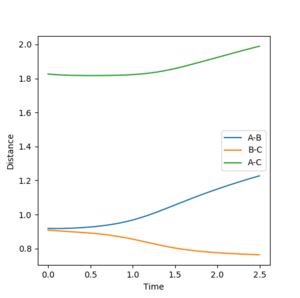
With the radii r1 and r2 interchanged so that now r2= 0.918, r1= rts, the graph of internuclear distance vs. time shows an exchange in the trends for AB and BC. Conversely to before, now the distance between A and B decreases with time, but the distance between nuclei B and C increases with time.

Setting the initial radii values to the final values of the trajectory above, and reversing the momenta vectors shows
Jas213 (talk) 22:27, 28 May 2018 (BST)Units units units. An additional contour or surface plot would have illustrated this better. You don't see any vibrations in the MEP because the vibrational energy is set to zero at each step. A momentum vs time plot would have illustrated this further.
Reaction Trajectories: Reactive and Unreactive
The energy profile of a reaction, regardless of whether the free energy change is endothermic or exothermic, will pass over an energy barrier known as the activation energy, and reach a saddle point (the derivative of the graph equals zero here) corresponding to the energy of the transition state. In order to react, the reactants must collide with reactive orientation, and sufficient energy to react- the reactants possess this energy in a number of forms- here we are primarily concerned with kinetic, translational, and vibrational energy. If there is insufficient energy to react upon collision, the system will revert back to the reactants. It is possible for the system to pass the transition state energy and still revert back to reactants without reaction completion. This is known as barrier recrossing [1], and is illustrated with the penultimate parameters.
Theoretically, if the reactants begin at the same positions but with greater momentum, they will possess greater kinetic energy. The starting positions of the reactants were kept constant throughout the stimulations, at r1= 0.74 and r2= 2.0 Generally this trend is followed, as seen between stimulations 2 and 3, where increasing the momentum by (-)0.5 produces a reaction that previously did not occur. However, some cases above show that this is not necessarily always true. For example, stimulation 4 is with greater momentum for both A-B and C compared to trajectories that previously, produced a reaction, however they did not react. This proves that there is more to a successful collision than having enough kinetic energy. The main assumptions of Transition State Theory[2] are:
1. The reaction will follow the minimum energy pathway (mep).
2. Classical behaviour must be obeyed.
3. Quasi-equilibrium assumption: The activated complex is in equilibrium with the reactants. The activated complex to products is irreversible.
Assumption one is not always true, since reactions can proceed via pathways other than the minimum energy pathway. An example could when the activation energy barrier is surpassed via activation photochemically. Assumption three is clearly broken in the example previously discussed where barrier crossing occurs. In this case, if reaction does not go to completion it must be because the activated complex is in equilibrium with the products as well as the reactants- hence giving reversibility. With regards to assumption two, classical behaviour is not always obeyed since quantum mechanical behaviour, such as tunnelling[3], are possible.
Jas213 (talk) 22:33, 28 May 2018 (BST) I like the smooth transition from table to TST as in a proper report. The term you mean for the penultimate case is called "recrossing"
F-H-H System
This stimulation concerns the following reaction:
F + H2 ⇌ H + HF
The reaction is reversible, exothermic in the forwards direction. This is expected due to the formation of a strongly ionic H-F bond, more than compensating for the breaking of a covalent H-H bond, despite this bond being strong. In this stimulation, atom A is fluorine, atoms B and C are hydrogen. The transition state for the reaction between fluorine and diatomic hydrogen is observed at distances A-B= 1.814 Angstroms, B-C= 0.741 Angstroms, as shown in figure 5 below:
Jas213 (talk) 00:12, 29 May 2018 (BST) IF the forwards reaction is exothermic then what does this mean for the backwards reaction? The HF bond is not strongly ionic, it's strongly dipolar covalent. Ionic bonds only exist between anions and cations. Why is the HF bond stronger than the HH bond? Here you could have given the EN, the bond energy or described the difference in energy illustrating the endothermic and exothermic trajectory using the relative energies of the PES surface plot.

The method for finding the transition state was 'dynamics' with momenta set to zero to prevent deviation of the atom positions from the transition state once it has been reached. Figure 5 shows no change in interatomic distances with time and no vibrational oscillations- true for a system at rest.
Jas213 (talk) How did you obtain the TS? what was your method? Did you think about hammond's postulate?
Activation Energy
In order to find the activation energy the calculation method was changed fromm dynamics to MEP. The distance of the approaching fluorine was displaced from that of the transition state. The system, when displaced from the transition state, follows the reaction pathway either back to the reactants or to the products. By Hammond's Postulate, at small deviation in energy on the potential surface there will be a structurally similar system to that at the original point, since they are only separated by a small amount of energy. For exothermic reactions, since the energy profile shows a drop below the energy of the reactants to reach the products, show reactants that are more structurally similar to the transition state than the products are. Therefore it is more sensible to vary the distance A-B to find the activation energy than to vary the B-C distance.
The A-B distance was varied from 1.814 to 1.914 Angstroms. It was necessary to increase the number of steps from 500 to 10,000 since the activation energy is so small.
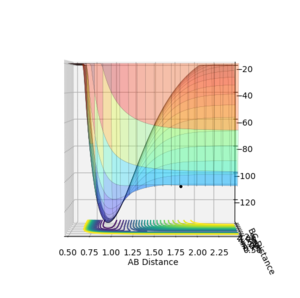
The energy of the transition state was found to be -103.869 kcal/mol. The activation energy was +0.355 kcal/mol.
The reverse reaction, however, is endothermic. The energy of the products was -133.404 kcal/mol. Taking into account the energy of the transition state, the activation energy for the backwards reaction was therefore +29.535 kcal/mol. The potential energy against time graph for HF + H is shown in figure 7.

Jas213 (talk) 00:25, 29 May 2018 (BST) Why did you not use the MEP approach for the backwards reaction? Where's your plot?
Reaction Dynamics
For atom A= F, atom B= H, atom C= H, and the following parameters:
Radii: A-B= 1.91Å, B-C= 0.7455 Å
Momenta: AB = -1.5
BC = 1.0
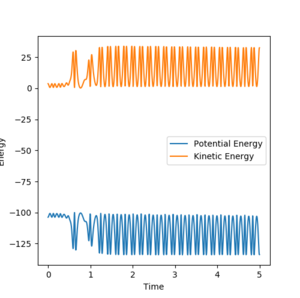
The reaction of H-H + F to HF + H appears to be exothermic since vibrational oscillation increases significantly following reaction at around 1ns. A release in energy would be expected to increase vibrational activity in the products. Figure 8 shows that the HF product has significantly more vibrational energy than the reactants, as shown by very high frequency amplitude of oscillation. Therefore this is related to the conservation of energy because the exothermic reaction energy is taken up into the vibrational modes of the product.

This reaction could be measured experimentally by bomb calorimetry. Using the equation of heat flow equal to the enthalpy of the reaction at constant pressure, enthalpy changes can be measured.
Effect of Varying Momentum
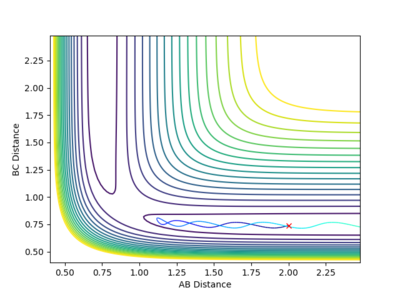
With F-H distance: 1.91 Angstroms, H-H distance: 0.74555, FH momentum: -0.5 kg⋅m/s, H-H momentum: -3.0 kg⋅m/s, the following contour surface is given:
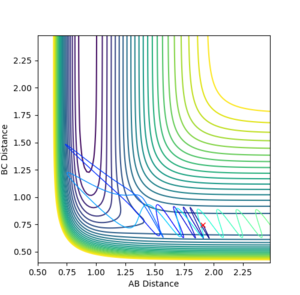
The contour plot shows that at these values of momenta the reaction pathway does not proceed to products.
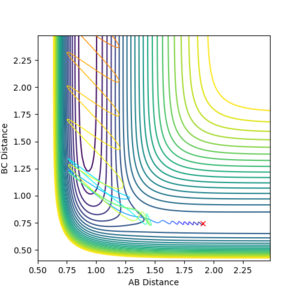
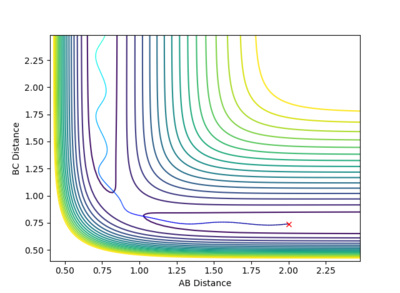
This Reaction pathway shows completion to products.
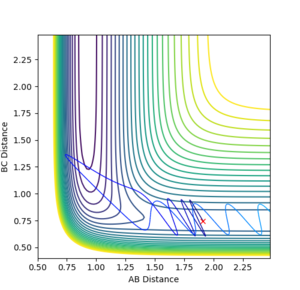
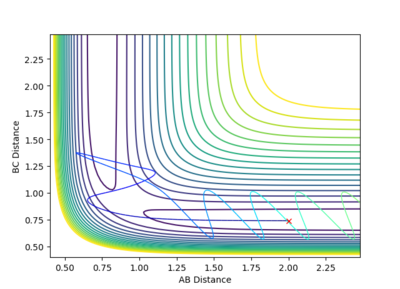
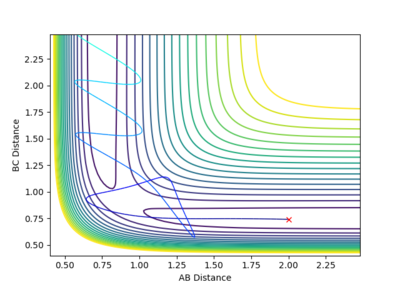
This reaction pathway shows an unreactive trajectory.
Jas213 (talk) 00:17, 29 May 2018 (BST) You only state pHH with your figures, hence I assume you kept pHF constant, but would be good if you had stated it.
Figure 9 where diatomic hydrogen momentum is -3 kg⋅m/s s does not lead to a reaction. Instead, the energy is dissipated as translational and vibrational motion in hydrogen fluoride. Figure 10 shows a complete reaction pathway, the vibrational energy here is in the product of diatomic hydrogen. The vibrational energy is significant, since the amplitude of oscillation is high. Figure 11 again shows failure of the reaction pathway to move towards the products, and instead the energy is dissipated in vibrational and translational energy in hydrogen fluoride.
Polanyi's Rules
Polanyi's rules describe the effects of the distribution of the total energy of a molecule into its different modes on the transition state of a reaction. The modes concerned are translational and vibrational. One rule is that vibrational energy is more significant for promoting a late activation energy in a reaction profile than translational energy is. Conversely, translational energy promotes an early reaction barrier more significantly than vibrational energy does. In the first case the reaction is exothermic, the second, endothermic.
The forward reaction: F + H2 → FH + H is exothermic and so it can be predicted that a high proportion of the total energy of the molecule being located in translational modes would promote reaction. This is illustrated in looking at the above plots of momenta and energy against time. In the case of the reverse reaction, which is endothermic, a high contribution of vibrational energy to the total energy of the reactant promotes completion of the reaction.
Jas213 (talk) 00:19, 29 May 2018 (BST) I can tell that you understand what you did, but why did you not study trajectories for the reverse reaction as well. An overall conclusion would have been nice. Also where are your references for Polanyi's rules?
References
- ↑ Reaction Rate Theory, http://www.acmm.nl/ensing/thesis/node9.html, ( accessed May 2018)
- ↑ E. Anslyn, A. Dennis, Transition State Theory and Related Topics. In Modern Physical Organic Chemistry University Science Books, 2006, p. 365–373
- ↑ Cite error: Invalid
<ref>tag; no text was provided for refs namedtunnelling
Cite error: <ref> tag defined in <references> has no name attribute.


