MRD:01208568
H + H2 reaction dynamics
What value do the different components of the gradient of the potential energy surface have at a minimum transition structure? Briefly explain how minima and transition structures can distinguished using the curvature of the potential energy surface.

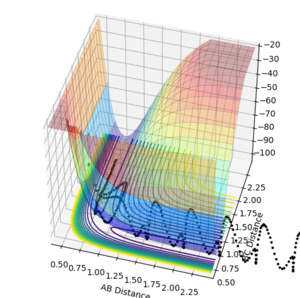
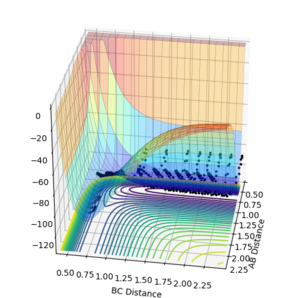
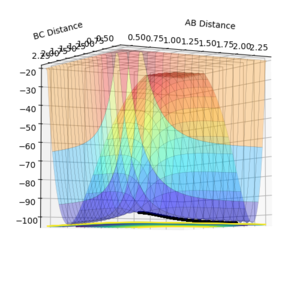
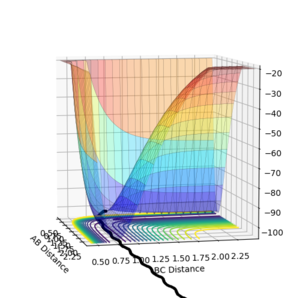
The transition point can be viewed by rotating the image of the plot to show the maximum and minimum at the same time as follows:


These two different perspectives of the potential energy curve at the transition state show that indeed there is a maximum in the direction orthogonal to the reaction pathway and there is a minimum in the direction parallel to the reaction pathway confirming there is a saddle point.
The start and end point of the reactive pathway can be best viewed by following the path of the black dots and since the first derivative is negative and the second derivative is positive, it shows there is a minimum. (This can be viewed from the direction is either axis.)
You can distinguish the minima and transition states by evaluating the curvature of the potential energy curve plot by taking the second derivative and the sign determining whether there is maximum or minimum. The first derivative will be equal to zero. If the second derivative can have both positive and negative values, the reaction is in its transition state, whereas if the potential energy curve can be viewed as only a minimum from the view of either axis, the reaction is in its reactant or state or it has completed and is in its product state.
(Saying that the second derivative can have multiple values here is wrong. What you mean are the partial derivates with respect to the reaction coordinate (along the reaction pathway) as well as its orthogonal counterpart. Fjs113 (talk) 16:37, 3 June 2018 (BST))
The reaction coordinate can be used to explain this, if the potential energy curve plot is in its transition state, viewing in the diagonal direction representing the minimum, moving in any direction equates to the distance between AB and BC changing. When the distance becomes shorter, it means that the hydrogen atoms are moving closer together and therefore the potential energy would increase exponentially as the system would be unstable. If the distance becomes larger, it equates to overcoming the attraction between the AB and BC species in the transition state, thus increasing the potential energy again.
In the view showing the maximum, going diagonally left would mean the distance of AB would be getting short and the distance of BC would be getting larger, up until the point at which the two bonds are equidistant.
(Using mathematical expressions here would have made your answer a lot clearer. Fjs113 (talk) 16:37, 3 June 2018 (BST))
Reporting the best estimate of the transition state position (rts) with the explanation
In this transition state the bond distance of AB and BC would be equal and this would be at the saddle point of the potential energy curve plot. If the position of the transition state, is not found to a good enough approximation, the inter-nuclear vs time plot would show large oscillations between the distance of AB and BC, as the reaction pathway would be moving up and down in the potential well. However when this is approximated well, less oscillation is observed.
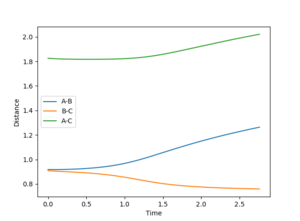
Using the inter-nuclear distance vs time plot, the approximate value of the the distance between AB and BC in its transition state was recorded.
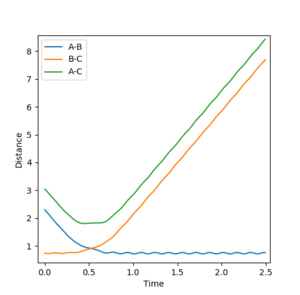
The distance at which the transition state occurs would be when the distance between AB and BC would be equal. This was found by setting the momentum of each species to zero in the initial conditions and just changing the distances. Using this method, it was determined the approximate distance was around 0.9078 angstroms.

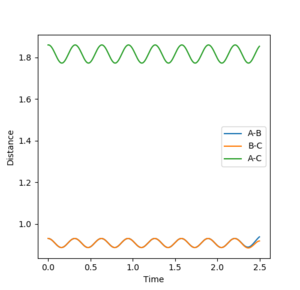
In the initial conditions the distance between AB and BC are set to have the same value, therefore the orange line is completely covering the blue line. In the transition state the distance between AC should be double the distance between AB and this value is 1.8156 angstroms.
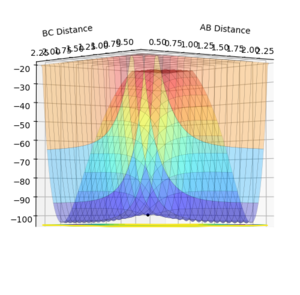
This shows a single black dot at the bottom of the potential well showing that 0.9078 is a good approximation of the inter-nuclear distance of the transition state.
The difference of the MEP and the trajectory calculated
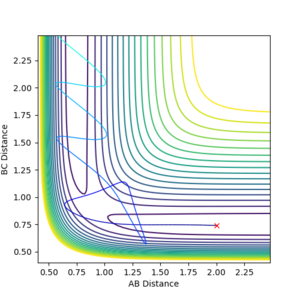
The dynamic calculation shows the reaction pathway oscillating along the valley floor, while the MEP calculation shows a smooth line along the valley floor. To give a full reaction pathway the MEP calculation took 8000 steps whereas the dynamic calculation took 553 steps.

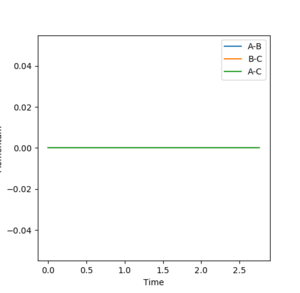
As the momentum is zero for the MEP calculation it shows that this form of calculation does not provide a realistic view of the reaction as the masses of each atoms are assumed to be zero therefore the momenta of each atom is zero.

Reactive and unreactive trajectories
The main assumptions of Transition State Theory
The assumptions made in transition state theory are as follows:
-Once the transition state is reached it will proceed to the product state. This means that it cannot reverse back into the initial state
-The energy of the atoms in the reactant state have that of a boltzmann distribution.
In the table it is clear to see that the first assumption is not correct in all cases as in the fourth set of conditions, the reaction did not proceed and reverted back to the initial state.At a high momentum, the plot shows that the reaction does not go along the potential energy surface plot, therefore the reaction has a possibility of returning to the initial state.
The rate of reaction would be faster using transition state theory than experimental data suggests due to the fact that the reactant pathway may reverse on itself acting as a barrier. Some experiments would not even produce results as no products are formed such as shown above in the table.
H-H-F reaction system
F + H2 reaction system
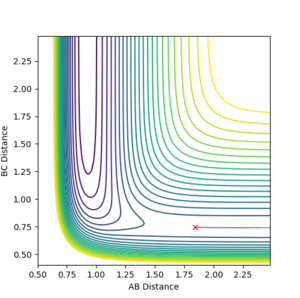
The potential energy surface curve was plotted using the initial conditions rAB= 2.30 angrstoms, rBC= 0.74 angstroms, p1(AB) = -2.7 p2(BC)= 0
The reaction of F and H2 is exothermic as show by the reaction trajectory that the product is lower in energy than the reactant therefore energy is released into the surroundings. This is also confirmed by that fact that the bond strength of H-F is much stronger than that of a diatomic hydrogen molecule. According to Hammond's postulate, the structure of the transition is closer to that in which it is closer in energy. For an exothermic reaction such as this one, the transition state is closer in energy to the reactant , therefore the distance at which the transition state occurs can be approximated along the reaction trajectory as the reaction just begins to proceed. In addition, the activation energy for this reaction is subsequently very low.
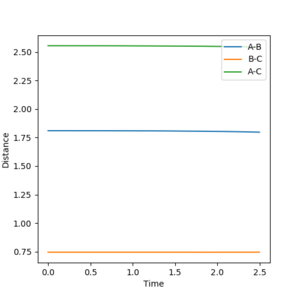
The values for the inter-nuclear distances in the transition state approximation were calculated using the same method as previously described in the H + H2 system.
This plot shows that at the distances F-H= 1.810 angstroms and H-H= 0.745 angstroms, the lines are straight indicating that the approximation is a good one. This is consistent with theory as the value for the bond distance between the two hydrogens should be slightly displaced from 0.74 angstroms, due to the repulsion of the electronegative fluorine atom and is also consistent with Hammond's postulate.
In order to approximate the activation energy, the initial conditions were changed to the point at which the reaction pathway did not proceed to the product state. This was done by evaluating the contour plots at different distances.
From the plot above, it shows that reactant particle starts at around the transition state and reverses back towards the reactant state. The conditions set were (rAB = 1.843 angstroms and rBC= 0.743 angstroms). To figure out the activation energy the energy difference between the transition and reactant states can be calculated to be approximately 0.207 Kcal/mol. However This could be better approximated by calculating a larger number of steps and furthermore trying to find a distances closer to the transition state but in which the reaction pathway is still sloping towards the reactant state. With a 50,000 step calculation, the activation energy was found to be 0.224 Kcal/mol which is 0.017 Kcal/mol higher than the first calculation carried out.
Another method to calculate the activation energy, is to set the inital conditions to where the distance between the fluorine and hydrogen molecules is very large and where the bond length of the hydrogen molecule is the normal length. The potential energy at these distances taking a calculation with only one step would be theoretically the energy of the reactant state. Then taking the difference between this energy and the transition state energy would be approximately equal to the activation energy. Using this method the approximate activation energy was calculated to be 0.261 Kcal/mol.
H +HF reaction system
This reaction is the reverse reaction the reaction described above. Therefore the potential energy surface is identical with the axis swapped round and the reaction is endothermic. By applying Hammond's postulate, the transition state would be expected to be found closer to the product state rather than the reactant state. The potential energy of the products and reactants have a lower bond energies than the respective opposites. The approximate bond enthalpies are 565 kJ.mol-1 for the HF bond and 436 kJ.mol-1. [1]. The enthalpy changes for the H + HF --> HH + F are ΔH = +133 kJ.mol-1 and for the F + HH --> HF + H, ΔH = -133 kJ.mol-1.
The transition state was located via trial and error and was found where the distance rAB = 1.8114 angstroms and rBC = 0.7442 angstroms.
The activation for each reaction was found to be 0.26 Kcal/mol-1 for the first reaction and 30.23 Kcal.mol-1 for the reverse reaction.
Using the law of conservation of energy which states that the energy cannot be created or destroyed but only converted into different forms, it can be concluded that the total energy in the system is constant but is being converted from potential to kinetic energy and vice versa.
When the fluorine atom approaches the hydrogen molecule the speed of the fluorine atom decreases as the kinetic energy is converted into potential energy because of the interaction between the atoms. This potential energy increases up until a maximum of where the transition state is, (kinetic energy is zero at this point). After passing this point of transition, the formation of HF because the reaction is exothermic, causes the potential energy between the atoms to drop immensely which is transferred to the hydrogen atom that leaves increasing its kinetic energy and temperature.
Polanyi's rules can be used to determine to what extent a source of energy contributes to a reaction depending on where the transition state is in relation to the reactant or products. If the transition state is closer to the products, the vibrational energy contributes more the transition structure and so a large amount of vibrational energy will encourage this reaction. Conversely if the transition state is closer to the reactant state, the translational energy of the atom that is approaching will control the efficieny of the reaction.
Therefore for the F + HH --> reaction the needs a small amount of vibrational energy to achieve the transition state and largely requires translational energy for the reaction to fully proceed. Whereas the H + HF --> HH + F reaures a large vibrational energy to achieve the transition state as the reactants lie lower in potential energy.
(The last bit looks very rushed and you missed out on a few bits of the last few questions. Otherwise, well done overall. Fjs113 (talk) 16:37, 3 June 2018 (BST))
- ↑ Atkins, Pauli (2014) Atkin's Physical Chemistry 10th edition, 986


