MRD:01208547
Y2 Computing Lab
Exercise 1
Q1
What value do the different components of the gradient of the potential energy surface have at a minimum and at a transition structure? Briefly explain how minima and transition structures can be distinguished using the curvature of the potential energy surface.
 |
 |
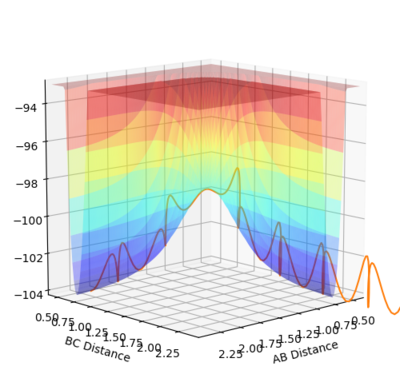
At the two minima, (corresponding to the reactants and products), the derivative of Potential energy () with respect to both r1 (distance A-B) and r2 (distance B-C) is 0. A way to get to this minima is to start at the transition state with a rolling ball in a Surface plot (Potential energy surface) and apply a slight momentum to the ball, the ball will roll towards a minima and oscillate about it after a certain time, the other minima can be achieved in the smae metod by applying a opposite momenta at the start. (If you are unluckey engough to pust the ball in such a way where it oscillates about the transition state, try pushing it perpendicular with respect to your initial direction). On the other hand, the transition state is represented as a saddle point, where on one end it is a loacal maxima and with another view it is the local minima.
Mm10114 (talk) 19:17, 14 May 2018 (BST) This is a good attempt in explaining the relation of the minima and transition state on the potential energy surface. However, a more mathematical explanation using the first and second partial derivatives, and their values, in relation to the surface curvature was expected. The 'rolling ball' example is good, however, mostly used to help you visualise the potential energy changes (gradient) of the surface and the behaviour of a hypothetical system at different positions with different gradient acting on it. Additionally, you have a little too many spelling mistakes and "If you are unluckey" phrase is rather to direct for a scientific report.
Q2
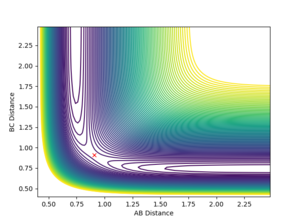
Report your best estimate of the transition state position (rts) and explain your reasoning illustrating it with a “Internuclear Distances vs Time” plot for a relevant trajectory.
 |
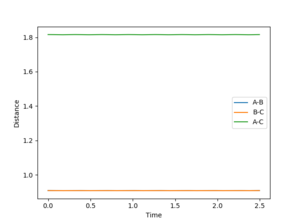 |
Banking on the fact that the transition state must have r1 = r2, starting on a trajectory on the ridge with r1 = r2 will cause an oscillation about the TS, so transition state position can be estimated by finding such r values where there is as little oscillation as possible. In this case, the transiton state is located at 0.908 (r1 = r2 = 0.908)
Mm10114 (talk) 19:40, 14 May 2018 (BST) You should explain why r1 = r2 is necessary for the transition state in this particular case. This might not be true for other systems (see exercise 2), you could explain it by relating it to the symmetry of the contour surface plot. You could describe in a little more detail the procedure that helped you to find the transition state.
Q3
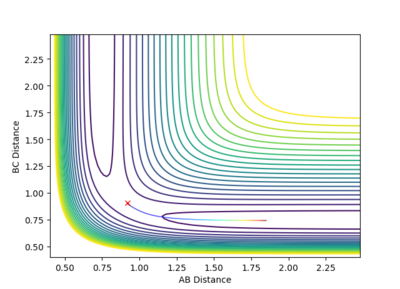
Comment on how the mep and the trajectory you just calculated differ. (Considering r1 = rts+δ, r2 = rts)
 |
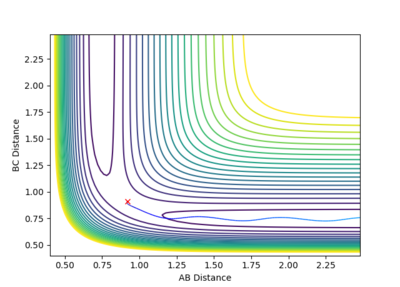 |
As you can see in the two pictures, the Dynamic calculation includes a slight oscillation of the pathway while the minimum energy pathway (mep) is a smooth line with no oscillations to it's name.
(Like a river vs flat land)
We can expect the route of the pathways to go 'upwards if we considered r1 = rts and r2 = rts+0.01 instead.
Mm10114 (talk) 19:40, 14 May 2018 (BST) Try not to reference the reader of a scientific report directly. You've made a good observation of the difference in the trajectory originating from dynamics and the one from MEP. But, you miss the point of explaining what causes the difference, thus how does dynamics and MEP calculations differ in calculating these trajectories. "Upwards" is probably not the best way to navigate on the plot as it can cause some confusion.
Q4
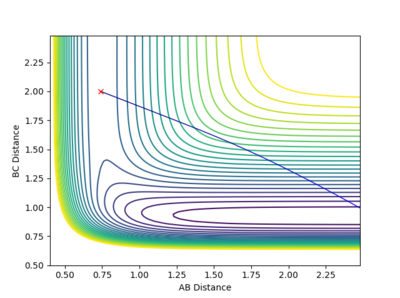
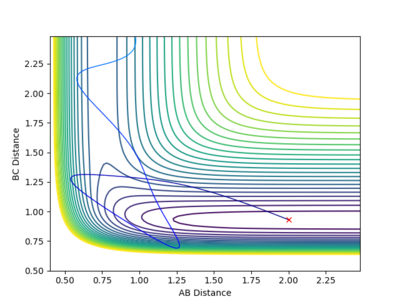
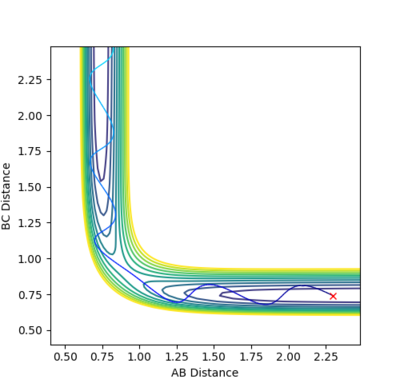
A table showing different starting momenta with constant r values (r1 = 0.74 and r2 = 2.0)
| p1 | p2 | Total Energy | Reactive? | Diagram | Description |
|---|---|---|---|---|---|
| -1.25 | -2.5 | -99.018 | Y | 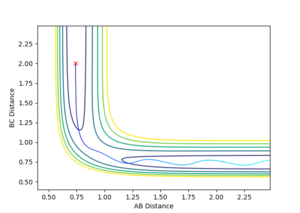 |
smooth reaction A + B-C -> A-B +C Mm10114 (talk) 19:40, 14 May 2018 (BST) You could've comment on the oscillation of the reaction trajectory (line) before and after reaction. |
| -1.5 | -2.0 | -100.456 | N |  |
failed reaction, A bounces right back (unable to go through the activation barrier) |
| -1.5 | -2.5 | -98.956 | Y | 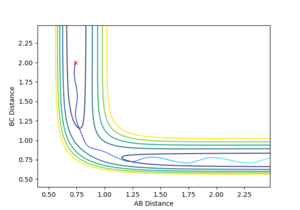 |
smooth A + B-C -> A-B +C with greater initial energy than the first Mm10114 (talk) 19:40, 14 May 2018 (BST) You could've analyse which energy component is greater than in the first reaction. "than the first" - than the first what? be specific. |
| -2.5 | -5.0 | -84.956 | N | 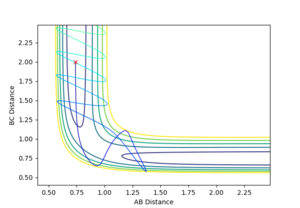 |
A + B-C -> A-B +C Did happen, however it bounced back to beomce A + B-C Mm10114 (talk) 19:40, 14 May 2018 (BST) Please, try to use more scientific wording in your report. First you don't specify what have happened. A full sentence like "The reaction have occurred" or something similar would make your report more appropriate. |
| -2.5 | -5.2 | -84.956 | Y | 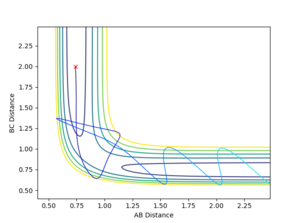 |
Bounces back like the one above, however it bounces back again to obtain the final A-B + C This is a case of Barrier recrossing Mm10114 (talk) 19:40, 14 May 2018 (BST) You need to explain what a barrier recrossing is. Where did you find this information? (maybe some reference). |
Mm10114 (talk) 19:40, 14 May 2018 (BST) In the last two examples if you would have also presented the intermolecular distance vs time plots that would help to show the recrossing events. You could have also discussed in more detail what is actually happening here.
State what are the main assumptions of Transition State Theory. Given the results you have obtained, how will Transition State Theory predictions for reaction rate values compare with experimental values?
Transition state theory was made up to better understand the reaction rates of elementary reaction, one of the main assumptions is that the reactants are in equilibrium with an activated complex rather than the product itself.
So A+B ⇌ Intermediate ->P
Another assumption is how the transition state theory assumes intermediates are long lived enough to form a Boltzmann distribution of states, this however is not the case for most reactions as the intermediates are very short lived. In addition, the transition state theory requires that the atomic nuclei must behave according to classical mechanics, so it ignores the idea of quantum tunneling where reactatns, even with not enough energy to overcome the transition state (energy maxima) have a finite probability of 'tunneling through the barrier completely'. Finally, high temperature can cause the theory to fail, as the theory assumes the passing through the energy maxima in the minimum energy pathway (Saddle), when temperatures get high, new transition states become accessible as more states of energy (Vibrational, Transnational and rotational are being populated).
Mm10114 (talk) 19:40, 14 May 2018 (BST) This is a good discussion. A reference would be helpful to show source of the transition state theory assumptions you discuss here. Please, be vary of any spelling mistakes.
Exercise 2 The F - H - H system
Q1 - Potential Energy Surfaces
Classify the F + H2 and H + HF reactions according to their energetics (endothermic or exothermic). How does this relate to the bond strength of the chemical species involved?
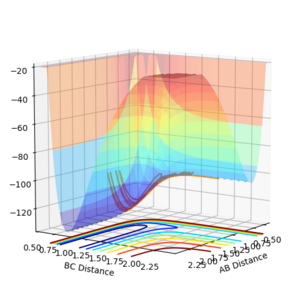
The F + H2 is an exothermic reaction and H + HF is consequently endothermic. This can be clearly seen by looking at the potential energy surface as it shows when B-C distance is small (A=H, B=H, C=H) the potential energy is lower signifying that bond energy of H-F is greater than the bond energy of H-H.
Mm10114 (talk) 20:13, 14 May 2018 (BST) Your explanation is okay. You could've spent a little more time in explaining where exactly on the potential energy surface are products and where substrates, in respect to which reaction. You've also made a mistake in assigning the atoms in brackets "(A=H, B=H, C=H)". You describe a system like in exercise no. 1. You should make more effort to prevent such simple errors (This one makes your explanation invalid).
Locate the Transition State and find the Activation energy of the 2 reactions
 |
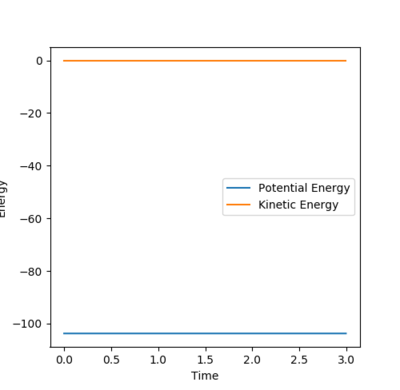 |
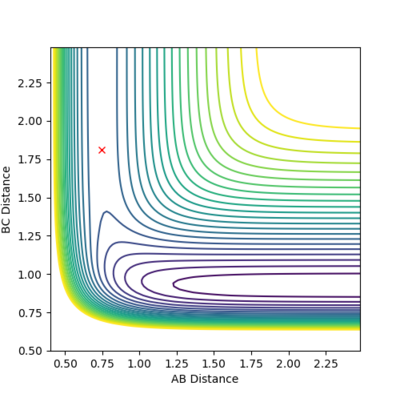
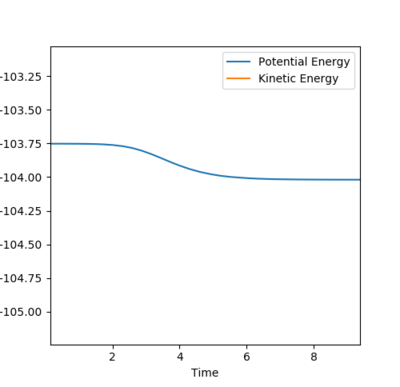
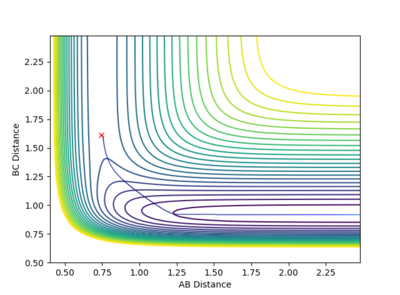
The transition state is the maximum energy on the minimum energy pathway, hence if a dynamic rolling ball is placed on the transition state with no momentum, it should stay still, i.e no changes in the kinetic or potential energy. After some number crunching, the transition state was found to be at (AB) H-H Distance = 0.744Å and (BC) H-F Distance at 1.811Å. The graphs above support this.
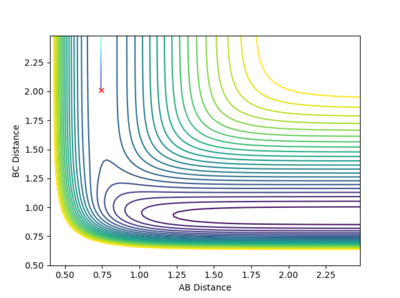
According to Hammond's postulate, since the transition state occurs extremely fast, it is close in molecular structure with the H-H. Therefore by altering the transition state by a tiny bit, the MEP will show a movement towards the reactants (H-H), This along with the Energy against time plot allows us to find the activation energy.
 |
 |
 |
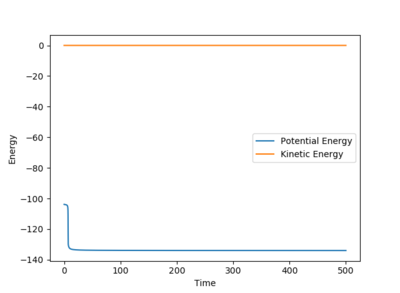 |
The difference in the potential energy is the activation enrgy of the two reactions.
Activation energy for H-H + F -> F-H + H = 0.255 kcal/mol and the Activation energy for F-H + H -> H-H + F = 29.775 kcal/mol
Mm10114 (talk) 20:13, 14 May 2018 (BST) This part is mostly good. "After some number crunching" is probably not the best phrase to say in a scientific report you've done a lot of calculations? You could've briefly describe how did you found the transition state here.
Q2-Reaction Dynamics
Identify a set of initial conditions that results in a reactive trajectory for the F + H2, and look at the “Animation” and “Internuclear Momenta vs Time”. In light of the fact that energy is conserved, discuss the mechanism of release of the reaction energy. How could this be confirmed experimentally?
A set of conditions that show a reactive pathway is AB (H-H) Distance as 0.744 Å, BC (H-F) Distance as 2.25 Å and both the AB and BC Momenta equal to -1 (unspecified units).
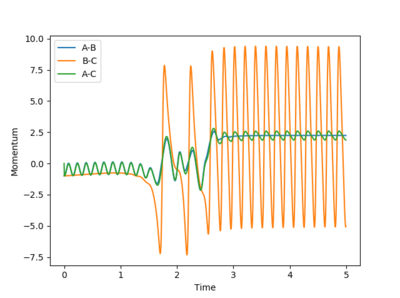
Looking at the graph above, after the collision between H-H and F molecules, the momenta of H-F starts to oscillate rapidly signifying the H-F bond is vibrating intensely. As mentioned before, this reaction pathway is exothermic, releasing about 30 kcal/mol of energy. As energy must be conserved in this closed system, the energy gained is simply converted into a lot of vibrational energy at the H-F bond instead. To measure this experimentally a reaction vessel containing Hydrogen gas and atoms of F (via homolytic fission), remember the facet that kinetic energy of molecules in the gas phase is given by a factor proportional to temperature, hence after the reaction, the H-F bond that is vibrating will then collide with other molecules in the reaction vessel and increase the overall kinetic energy. Therefore, an increase in temperature would signify this is happening.
Mm10114 (talk) 20:13, 14 May 2018 (BST) Very good. Should've add how would you experimentally measure this increase in temperature to fully answer the second question.
Discuss how the distribution of energy between different modes (translation and vibration) affect the efficiency of the reaction, and how this is influenced by the position of the transition state.
With p(HH)on the extremes of the range (+3 and -3), the reaction is unsuccessful and we end up with the reactants again. With -2 ans +2, the reaction is successful albiet a barrier recrossing for +2. However, only +1 results in a successfully reaction unlike -1 which the collision was unsuccessful. 0 momentum also results in a successful reaction.
After observation of more values both in and outside of the range, it was found that in the reaction of H-H + F, most of the successful reaction pathways consisted of the approaching F atom having little momentum as there is a very small activation energy. However, when the reaction fail, it is due to how the transition state is vibrating with an independent H atom in close proximity, therefore it is possible to reform the H bond entirely and break the newly formed H-F bond almost immediately after formation. Hence another factor includes having a large vibrational energy for the H2 atom. This is because a large distance between the 2 Hydrogen atoms when the F atom collides will mean that the independent Hydrogen is far away and will not be able to reform the H-H bond. But do be careful, if the H-H bond stats off with too much momentum, it will break!
Unlike the previous reaction, the transition state is far from the initial reactant energy (of HF and H), hence this time a large momentum for the incoming hydrogen is needed to overcome the much larger activation energy (strong H-F bond). The only thing to beware in this case, is if the initial vibrational energy of the H-F bond is too high, as this will cause the impact from the Hydrogen not to cause a great enough change in momentum in the H-F bond for it to break!, so ideally we also want a low amount of vibration in the H-F bond.
Mm10114 (talk) 20:13, 14 May 2018 (BST) The analysis of the two examples is overall good. However, are you sure using such extreme examples was the best choice here? Especially in the first one it is hard to tell what is happening and you cross very far from the previously estimated transition state. How would you relate your findings to the Polanyi's rules? Especially, the relation between the position of the transition state in respect to the reactants and the resulting requirements for the vibrational/translational energy in order for the reaction to occur?

