MRD:01193130WP
Exercise 1: H + H2 system
The transition state corresponds to a saddle point on a potential energy surface. A saddle point is a stationary point (point at which gradient is equal to 0) but not an extremum point (not a minimum or a maximum). The gradient of a potential energy surface at a transition state and at a minimum is 0 but the two are not the same. We can differentiate between the minimum and transition state by taking the second derivative of the gradient: ∂2V(ri)/∂ri2 > 0 indicates a minimum and ∂2V(ri)/∂ri2 < 0 indicates a maximum (transition state).
Mm10114 (talk) 17:29, 7 June 2018 (BST) Good explanation. You could have be more specific in which direction is the transition state considered a minimum, and in which direction a maximum, when considering second partial derivatives.
ESTIMATING THE TRANSITION STATE
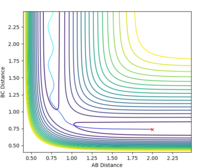
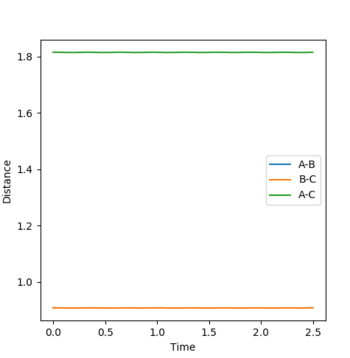
Estimated rts = 0.908 Å. The requirement for a transition state is that it must have r1 = r2 (due to its symmetrical nature) and since the TS is a stationary point, there should be no oscillation at this point. At r1 = r2 = 0.908 Å there is only very minimal oscillation (Fig. 1).
CALCULATING THE REACTION PATH
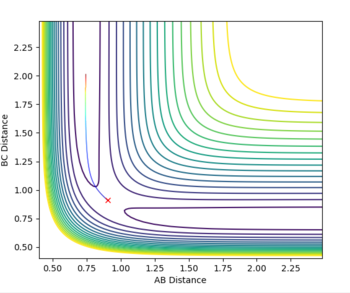
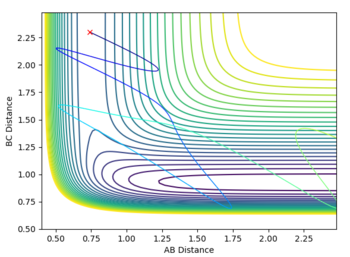
The initial conditions were set such that the system was slightly displaced from the estimated transition state: r1 = 0.908 Å, r2 = 0.909 Å, p1 = p2 = 0. Calculation type: MEP (minimum energy path).
TRAJECTORY
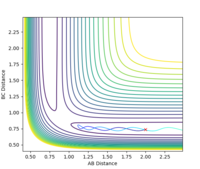
The same initial conditions were used with the calculation type set to 'dynamics'
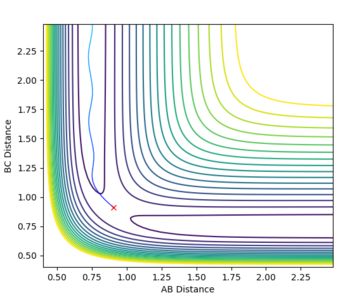
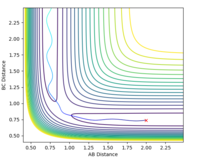
The MEP represents the path of lowest energy a reaction could proceed by and still go to completion, but it does not account for any motion of atoms which is an unrealistic approximation. The MEP calculation results in a straight line, with no oscillation. The dynamic calculation results in the reaction trajectory that shows oscillatory motion and is closer to what happens in reality[1]
The contour plot also shows that when r1 = rts and r2 = rts + 0.01 and we start at the transition state, we fall down to the products. For the case where r1 and r2 are reversed, the reaction falls back down to the reactants.
REACTIVE AND UNREACTIVE TRAJECTORIES
TRANSITION STATE THEORY[2]
The main assumptions of transition state theory (TST) are:
1. The system is in equilibrium (or close to) with the reactants and not the products
2. Reactant behaviour agrees with classical mechanics
3. The possibility of multiple reaction pathways is ignored
4. The transition state (activated complex) will be in equilibrium with the reactants
5. The reaction will always pass through the lowest energy transition state (saddle point)
6. There is negligible barrier recrossing
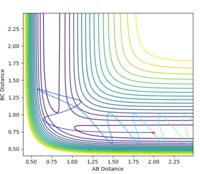
These are only assumptions and therefore not always true, if reactants really did behave as predicted by classical mechanics then the p1 = -2.5, p2 = -5.0 trajectory would be reactive as the assumption suggests any system that has enough energy to reach the transition state (overcome activation barrier) will go to products. That's clearly not the case in this example - the trajectory is unreactive due to barrier re-crossing which is assumed to be negligible in the TST.
Since the TST ignores barrier recrossing and other processes such as quantum mechanical tunnelling, and therefore assumes all collisions with enough energy to form the activated complex will be reactive, the rate of reaction predicted by the TST will be higher than it is in reality.
Mm10114 (talk) 17:29, 7 June 2018 (BST) Very good.
EXERCISE 2: F-H-H system
PES inspection
The reaction F + H2 is exothermic (reactants higher in energy than products). The H-F bond formed is much stronger than the H-H bond that is broken (the H-F bond has high iconic character due to the high difference in electronegativity between H and F) - the energy released from the formation of H-F greatly exceeds energy needed to break the weaker H-H bond so energy is released into the surroundings. The reaction HF + H is endothermic (reactants lower in energy than products) due to the strength of the H-F bond - energy released in the formation of an H-H bond does not exceed the energy needed to break the strong H-F bond therefore energy is taken from the surroundings and the reaction is endothermic.
LOCATING THE [F-H-H]‡ (TRANSITION STATE)
The transition state for F + H2 and for HF + H will be the same: [F-H-H]‡. Hammond's postulate states that if a reaction is exothermic the transition state will resemble reactants and if a reaction is endothermic the transition state will resemble products (based entirely on which it is closer in energy to). Therefore for the exothermic F + H2 reaction the transition state will resemble reactants (F and H2) - using the bond length of H-H (74 pm) and optimising the rough H-F length found by looking at the value that corresponds to 74 pm H-H on a contour plot the point at which the transition state for both F + H2 and H + HF occurs was found to be at the point where H-F = 1.810 Å and H-H = 0.746 Å. The surface plot showing each transition state can be seen below (Fig. 5 and 6):
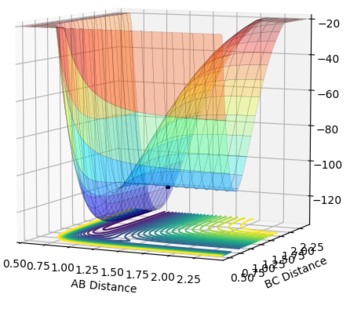
F + H2 Transition state
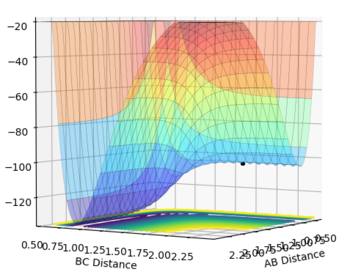
H + HF transition state
CALCULATING ACTIVATION ENERGIES
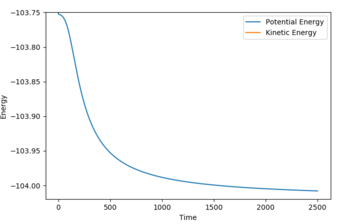
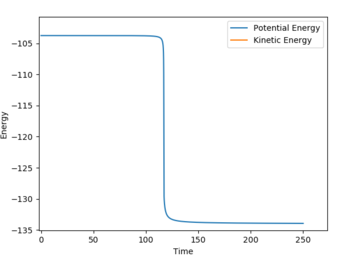
Activation energy can be found by looking at the difference between the energy at the transition state and the energy at the reactants: Ea = energy of TS - energy of reactants
F + H2: Ea = -103.741 --104 = 0.26 kcal/mol
H + HF: Ea = -103.741 --134 = 30.26 kcal/mol
Energy of reactants was determined from energy vs. time plots (MEP calculation) displacing the bond lengths slightly from the transition state lengths. The energy vs. time plots can be seen below (Fig. 7 and 8):
'REACTION DYNAMICS'
MECHANISM OF RELEASE OF REACTION ENERGY
Initial conditions were set such that a reactive F + H2 trajectory was obtained: r(F-H) = 2.3 Å, r(H-H) = 0.8, p(F-H) = -7.0, p(H-H) = -1.0
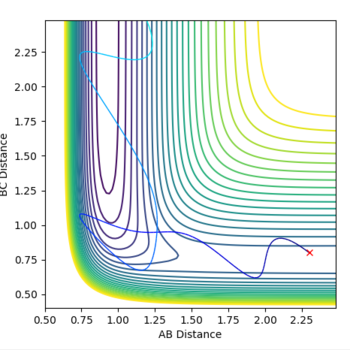
An internuclear momenta vs. time graph (Fig. 9) shows that the amplitude of H-H bond vibration is much smaller than that of the H-F bond vibration. Since the F + H2 reaction is exothermic, excess energy is released into the surroundings. It can be assumed that this excess energy goes into increasing the amplitude of H-F bond (product) vibration. Since energy is conserved, a decrease in potential energy must result in an equal in magnitude increase in kinetic energy and this can be seen on an energy vs. time graph (Fig. 10) for this system.
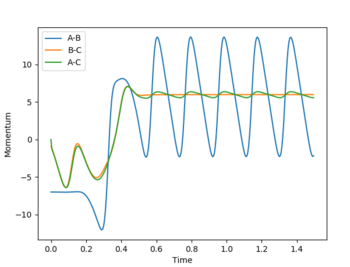
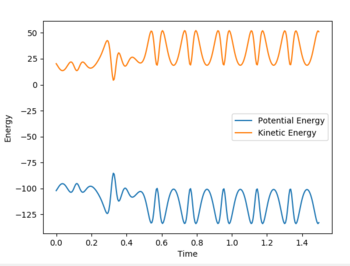
This could be confirmed experimentally by IR- higher vibrational energy will result in more intense overtone bands.
POLANYI'S RULES[3]
Polanyi's rules show how different forms of energy affect reaction rates. The rules state that vibrational energy is more efficient at activating a late barrier reaction than translational energy (the reverse is true for an early barrier reaction). According to Hammond's postulate an exothermic reaction, like F + H2, has an early transition state (it is an early barrier reaction) so, in order for the reaction trajectory to be reactive, translational energy must be greater than vibrational. For example setting p1 = 2 and p2 = -5 (high translational energy and low vibrational energy) results in a reactive trajectory (Fig. 11), swapping the two p values results in an unreactive trajectory thus the F + H2 system obeys Polnayi's rules - reaction will only 'go' if translational energy is much higher than vibrational.
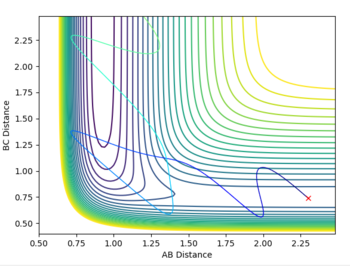
Since the HF + H reaction is endothermic, Hammond's postulate predicts that the transition state resembles products - late transition state (late barrier reaction). Therefore, according to Polnayi's rules, the reaction trajectory will be reactive only if vibrational energy is higher than translational energy). For example, setting p1 = -2.5 and p2 = 5 (high vibrational energy, low translational energy) results in a reactive trajectory but reversing the two values gives an unreactive trajectory. So the HF + H system also obeyes Polanyi's rules since, for an endothermic reaction, only systems with high vibrational energy should be reactive (fig. 12).
REFERENCES
1. Daniel Sheppard, Rye Terrell and Graeme Henkelman, J. Chem. Phys, 2008, 128, 1-10 [4]
2. A. C. Lasaga, Rev. Miner. States, 1981, 8 [5]
3. Z. Zhang, Y. Zhou and D. H. Zhang, J. Phys. Chem, 2012, 3, 3416-3419 [6]

