MRD:01180512
Exercise 1: H + H2 System
Ng611 (talk) 12:03, 22 May 2019 (BST) An exemplary report that clearly demonstrates mastery of the subject matter. Your use of the Hessian to see the TS was particularly good (and is actually how computation chemistry packages determine the TS). Overall, this is an outstanding piece of work
Transition State
The transition state is a turning point and has a partial derivative of 0 with respect to all its axes. The transition state is a saddle point and can be found using the Hessian matrix, whose elements would be the partial derivatives of energy against distance in along a particular axis for a reaction coordinate as shown below. The determinant of the Hessian Matrix would be positive when there are local minima or maxima. If the determinant is negative, then it is a saddle point. [1]
where
If and , then has a local minimum at
If and , then has a local maxima at
If , then has a saddle point at
In addition, the eigenvalues of the Hessian at a reaction coordinate will also reveal the presence of a saddle point. If the eigenvalues of the Hessian have both a positive and a negative value, both concave up and concave down properties are present simultaneously, implying a saddle point is present since a positive eigenvalue implies minima and a negative eigenvalue implies a maxima. [2]
Ng611 (talk) 11:48, 22 May 2019 (BST) This is an exemplary answer! Really well done!
Estimation of the Transition state
The Force acting on the Hydrogen atoms can be represented by the negative of the gradient of the potential energy with respect to distance. As established earlier, the gradient at the transition state is zero, and this can be estimated by looking at the 'forces' section of the graphical user interface (GUI).
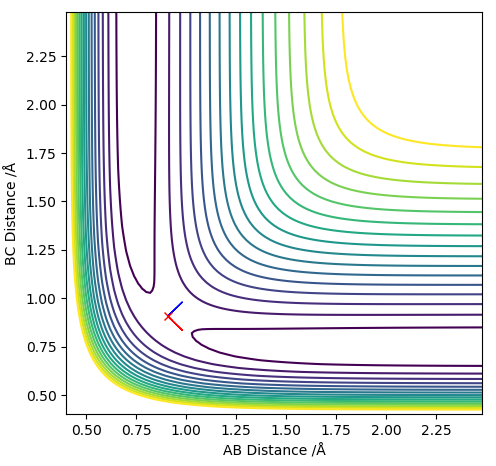
The estimation for the transition state bond length was achieved by using a simple harmonic oscillator (SHO) approximation of the oscillation of the H atoms when RHAHB = 0.83 Å and RHBHC = 0.83 Å, and PHAHB = 0 and PHBHC = 0. Using an interdistance vs time plot, the position of 'zero' displacement in a SHO gave the position of the Transition state, since the Force is 0 when the displacement is zero (SHO approximation). This position of 'zero' displacement is found to be 0.907742 Å, which was verified by looking at the 'forces' section of the GUI. The forces were 0, which indicated a stationary point.
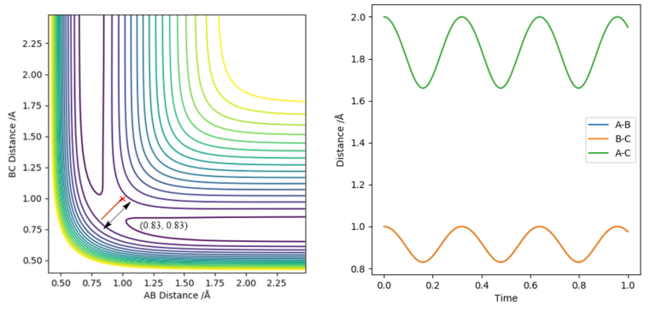
Figure 2 - (Right) Heavy oscillation for Internuclear Displacement plot for H + H2 system at RHBHC = 0.83 Å
In addition, using 0.907742 Å as the input gave a non-oscillatory motion and showed a stationary particle, which is a feature of the transition state. Its energy also did not fluctuate with time.
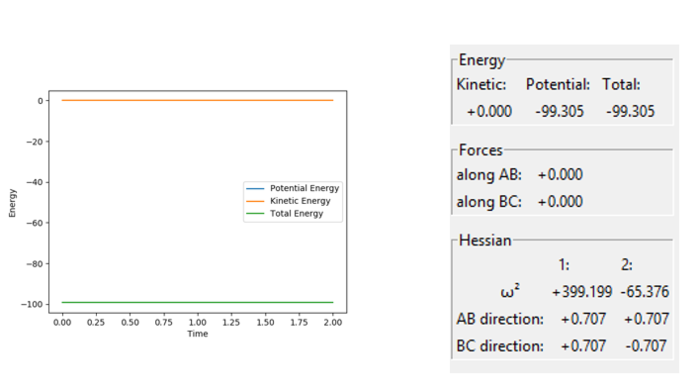
Figure 4 - (Right) GUI showing '0' Force and a negative eigenvalue and positive eigenvalue for H + H2 system at RHBHC = RHAHB = 0.907742 Å
The GUI in figure 4 shows conclusively that it is indeed a saddle point. The eigenvalues of the Hessian matrix feature both a positive value: +399.199 and a negative value -65.376, an indicator of a saddle point since both maxima and minima are present.

Ng611 (talk) 11:50, 22 May 2019 (BST) Again, excellent answer!
MEP and Dynamic Trajectory
Minimum Energy Path (MEP) refers to the lowest energy reaction pathway possible that still leads to product formation. [3] It reflects an infinitely slow motion where the momenta is reset to 0 in each step. The reaction coordinate at the saddle point reflects the direction of the unstable mode with the negative eigenvalue. Following the negative gradient of the PES surface that is concave downwards, one can trace out the MEP.
Comparison Between MEP and Dynamic Calculations
Next, the initial conditions of the system used were slightly modified, using MEP calculation to plot the trajectory using RHAHB = 0.917742 Å and RHBHC = 0.907742 Å.
The results of this calculation were compared to a dynamic calculation. Both dynamic and MEP show that RHBHC approaches infinity with time, and RHAHB fell to around 0.74 Å after being slightly perturbed from the transition state. This is because the slight perturbation causes HA and HB to be attracted to each other to form an H-H bond, while the remaing HC is repelled away to infinity.
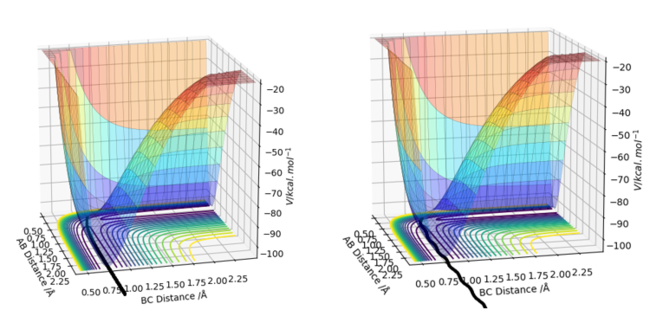
Figure 7 - (Right) Surface plot for H + H2 system using dynamic calculations
The main difference between MEP and dynamic calculations is that oscillatory motion is present in dynamic calculations (which is more realistic, since real molecules possess internal energy after collisions that lead to vibration), but absent in MEP calculations. Oscillatory motion is absent in MEP since the MEP travels only along the minimal energy pathway, which avoids slight displacements into valleys of high potential energy that triggers oscillatory motion. The oscillatory motion in dynamic calculations can be observed from the internuclear distance vs time and contour plots. In dynamic calculations, on the other hand, the inertia of the atoms causes them to oscillate after encountering a valley of higher potential energy.
Internuclear Distance against Time Plot
For the dynamic trajectory, the final distances are RHBHC approximately 0.756 - 0.723 Å indicating formation of A H-H bond. The final distance of RHAHB is 10 as the HC is ejected away after the collision. For the MEP trajectory, the final distances are similar (with the exception of RHBHC = 0.756 Å lacking oscillatory behaviour. This absence of oscillatory behaviour is due to the definition of MEP which resets the kinetic energy to zero, preventing oscillation along the regions which are not minimal energy pathways.
Another noteworthy difference in the Internuclear distance against time plot is that the distances of RHAHB increases 'logarithmically' for MEP but linearly for dynamics calculation. This could be due to MEP's preference to move only along the lowest energy pathway, whereas dynamic calculations have no such preference. MEP removes kinetic energy from the system, which might have caused a non-linear increase in distances.
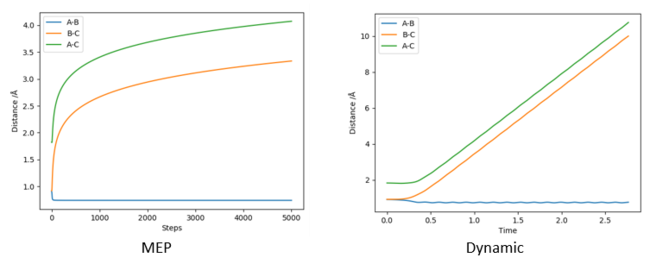
Figure 9 - (Right) Internuclear plot for H + H2 system using dynamic calculations
Reactive and Unreactive Trajectories for H2
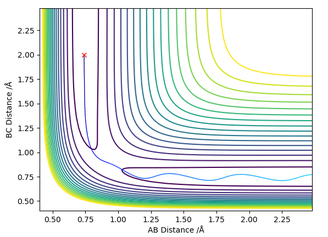
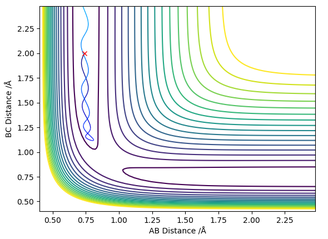
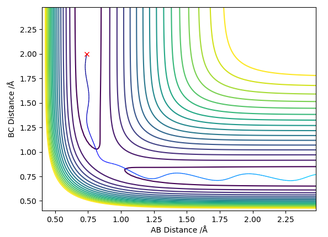
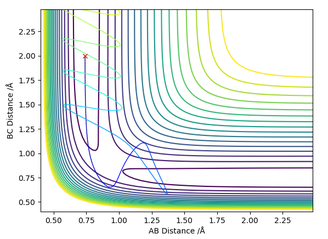
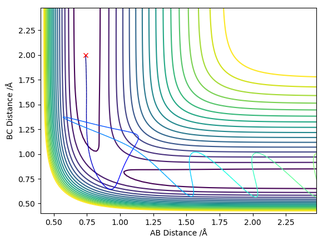
The initial conditions for this investigation would be RHAHB = 0.74 Å, RHBHC = 2.0 Å, with pHAHB = p1 and pHBHC = p2 which are varied as shown in Table 1.
As seen in table 1, the assumption that a molecule possessing energy larger than the activation energy barrier can react is not always true. In the fourth case, even when the momentum of p1 and p2 were high, reaction did not necessarily occur. In contrast, reactions can occur for lower energy systems as seen in cases 1 and 3.
Transition State Theory
Transition rate theory (TST) is a model that accounts for chemical reaction rates by considering the mechanistic interactions between the reactants, transition states, and products. [4]
1) Atoms in the reactant state are Boltzmann distributed.
2) Once the reactant crosses the activation energy barrier, it will form the product and not reform the starting reactant again.
3) Particles behave classically, and quantum phenomena such as quantum tunneling are not anticipated.
4) The reactants are in equilibrium with the activated complex.
5) The Born-Oppenheimer approximation holds in this model
The main limitation of TST in this investigation is assumption 2) and 3): That the particles behave classically, and that once a particle crosses the activation energy barrier, no reaction occurs. The simulation in case 4 shows the flaws of such an assumption as the particles can 'bounce-back' to form the reactants due to the high vibrational energy present even though it has already crossed the transition state and activation energy barrier. This phenomenon of barrier re-crossing is not considered by TST.
When Energy is higher than activation energy barrier, TST predicts successful reaction when in fact, we know from our simulation this is not necessarily the case due to re-crossing. Predicted rates here are higher than the experimental values observed.
The second phenomena ignored by TST is quantum tunneling, which can occur for low activation energy barriers. When energy is lower than activation energy barrier, TST predicts that the reactants would not be able to form products, when in fact, tunneling can occur for low activation energy reactions and lead to product formation. This is not predicted by TST model, causing the predicted rate to be smaller than observed when the reactants have low energy. [5]
Ng611 (talk) 11:56, 22 May 2019 (BST) Excellent answer! In essence, you have two competing effects, tunnelling and TS recrossing, which affect the reaction rate in different ways. Which effect dominates is a tough question and probably needs to be determined experimentally
Excercise 2: F - H - H System
PES Inspection
F + H2 and H + HF reaction energetics
H2 + F -> HF + H is an exothermic reaction as energy is released from this reaction. Fluorine, the most electronegative element has an attractive PES slope (valley) that attracts the H2 molecule towards it. This can be seen from the trajectory of the reaction on the contour plot. The Hydrogen molecule gains kinetic energy and is from the fall in potential energy moving from the H-H bond to the H-F bond. This is because the H-H bond is 436 kJ/mol [6], weaker than the H-F bond strength of 565 kJ/mol. [7] The energetics of the reaction is related to the strength of the bonds formed compared to the strength of the bonds broken. Since the H-F bond formed is stronger than the H-H bond broken, the reaction is exothermic. Another indicator of the energetics of the reaction would be the PES shown in figures 11 and 13. The reactants are seen to be at higher potential energy than the products, which is a sign that the reaction will lose potential energy, and is exothermic.
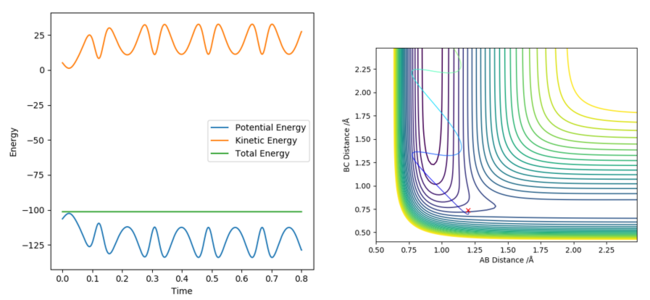
Figure 11 - (Right) Contour plot for F + H2 showing the PES and the attractive nature of the region surrounding Fluorine
Approximate Position of Transition State
Hammond's postulate states that the transition state of a reaction resembles the reactants or the products depending on which one it lies closer to energetically. For an exothermic reaction like H2 + F -> HF + H, the reactants lie closer energetically to the transition state of the reaction than the products. Hence, the transition state for this reaction: [H-H-F]‡ complex should resemble the reactants and its geometries. By approximating the H-H bond in the transition state to remain approximately constant, the H-F bond length was adjusted until approximately '0' force was attained in the GUI, along with a positive and negative eigenvalue. The H-F bond length of the transition state was found to be 1.8103 Å and the H-H bond length was approximated as 0.74489 Å.
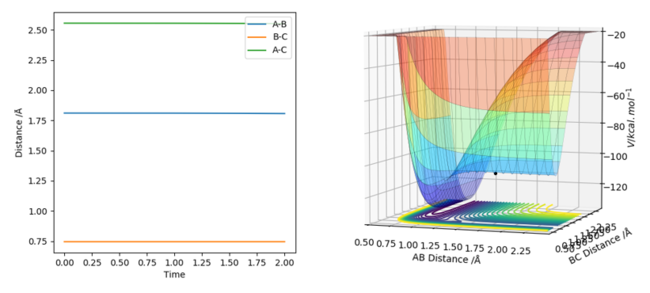
Figure 13 - (Right) Surface plot for F + H2 showing the stationary saddle point of the transition state
Calculating activation energies
The activation energy is given by the difference in energy between the transition state and the reactants. This can be found by slightly perturbing the transition state either in the direction of the forward or backward reaction and estimating assuming that the product will be formed at long time intervals.
Initial Conditions for the forward reaction: RHF = 1.8301 Å, RHH = 0.7463 Å.
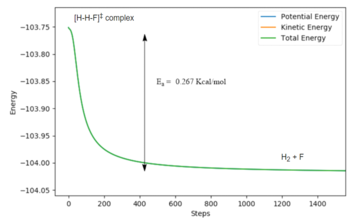
For the forward reaction H2 + F -> HF + H: Activation Energy = -103.751 -(-104.018) = 0.267 kcal/mol. This is close to literature values for the activation energy of 0.3 kcal/mol. [8]
Initial Conditions for the reverse reaction: RHF = 1.8065 Å, RHH = 0.7447 Å .
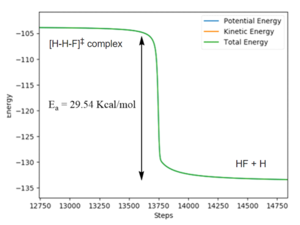
For the reverse HF + H reaction: Activation Energy: -103.87 -(-133.41) = 29.54 kcal/mol
The higher activation energy for the reverse reaction compared to the activation energy of the forward reaction is a sign that the reaction is exothermic. Subtracting the reverse reaction activation energy from the forward reaction activation energy gives the energy change of the forward reaction.
ΔE = 0.267 - 29.54 = -29.3 kcal/mol
This value is reasonably close to the enthalpy change reported by Polanyi and co.: -31.5 kcal/mol [9]. The deviations in activation energies and enthalpy change is likely due to the fact that the system has been arbitrarily perturbed a small distance away from the transition state, and this small distance could have led to deviation in energy from the energy of the transition state. It could also be due to the limitations of the approximations and theories used in this LEPS (London-Eyring-Polanyi-Sato) model.
Ng611 (talk) 11:58, 22 May 2019 (BST)Good answer! A minor note on style, I would use "et al." instead of "and co", as et al. is the standard way of writing this.
Reaction Dynamics
Mechanism for the release of reactive energy
Initial Conditions for investigating reaction parameters. RHF: 1.81 Å, RHH distance: 0.74 Å. pHF and pHH are set to be 0.
The H2 molecule travels in a relatively straight projectile initially, with little vibration. After the Collision with F in the attractive potential surface, the newly formed HF molecule hits a steep wall of the valley of the PES and becomes vibrationally excited with excess kinetic energy from the exothermic reaction.
This might be observed with spectroscopic or calorimetric techniques to detect the IR radiation emitted after de-excitation. Spectroscopic techniques may be able to detect emissions when vibrationally excited states decay, and if the vibrational states involved in spectroscopic measurements feature changes in dipole moment (To satisfy gross selection rule) to be detectable. Polanyi and co. have used infrared chemiluminescence to measure the rotational, vibrational and translational energies of the products of the exothermic reaction to match experimental rate constants and activation energies to the values determined by dynamic calculations. [10]
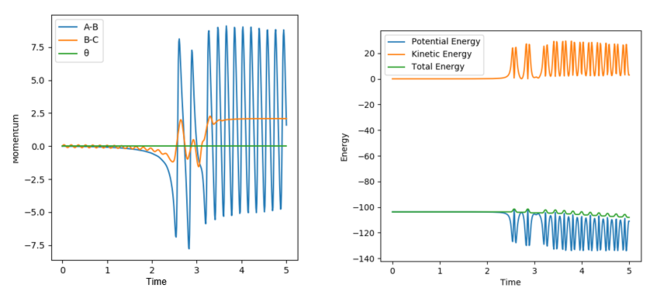
Figure 17 - (Right) Energy vs Time plot for F + H2 showing the oscillatory behaviour of the vibrationally excited products after reaction
For Calorimetry, when an exothermic reaction occurs, the enthalpy change can be detected as heat changes using set-up like Bomb Calorimeters to monitor the thermodynamics of the reaction. [11]
Ng611 (talk) 11:59, 22 May 2019 (BST) Excellent!
Polanyi's Rules
Polanyi's Rules state that vibrational excitation favours the reaction if the reaction is endothermic. (late TS along the reaction pathway according to Hammond's Postulate) and translational energy inhibits the reaction if the reaction is exothermic (early TS along the reaction pathway according to Hammond's Postulate). [12] Intuitively, one might think that higher vibrational excitation favours a reaction by providing excess kinetic energy to overcome the reaction barrier. However, in the case of H2, the opposite can happen as demonstrated in the simulation below.
Simulation 1:
H2 + F -> HF Forward Reaction
RHH = 0.74 Å, RHF = 1.8065 Å, pFH = -0.5, pHH = -2.99
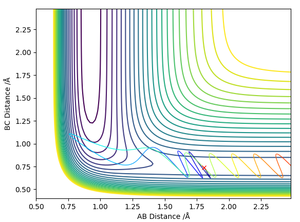
The Simulation showed that the excited vibrational states hindered the forward exothermic reaction as anticipated by Polanyi's Rules. The PES reveals that the product region is attractive (due to the lower potential of electronegative fluorine), as indicated by the contours that attract the H2 molecule. This attractive region attracts the reactants to form the products. This is likely due to the oscillatory motion causing the molecule to hit a region of high repulsive energy along the PES valley causing repulsion of the reactants back away from the activation energy barrier. This prevents the forward reaction.
Simulation 2:
H2 + F -> HF Forward Reaction
RHH = 0.74 Å, RHF = 1.8065 Å, pFH = -0.8, pHH = -0.1
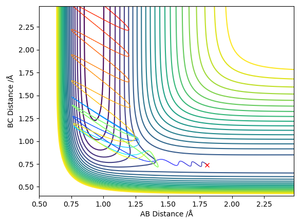
A successful reaction has now occurred, the lower vibrational energy has actually aided reaction, by allowing the H2 molecule to smoothly pass through the activation energy barrier and prevented the excessive vibrational energy from causing reformation of the starting reagents. Worth noting the vibrationally excited product formed after a successful exothermic reaction.
Simulation 3:
HF -> H2 + F Reverse Reaction
RHF = 0.91996 Å, RHH = 2.0000 Å, pFH = 0.1, pHH = -3
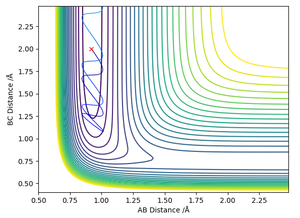
The reaction is unsuccessful due to the low vibrational energy of the reactants, and they lack the kinetic energy to surmount the activation energy barrier.
Simulation 4:
HF -> H2 + F Reverse Reaction
RHF = 0.91996 Å, RHH = 2.0000 Å, pFH = 8, pHH = -0.1
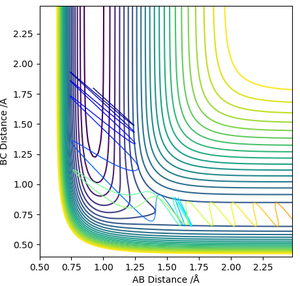
In the reverse endothermic reaction, the PES surface would be reversed, where the products will have higher potential energy and is now a repulsive field. The additional vibrational energy in Simulation 1 which hindered the forward exothermic reaction would prove to be useful for climbing the slope of the high activation energy barrier. This is because the oscillation is now hitting the high energy valleys of the PES, allowing it to surmount the activation energy barrier and pass the saddle point to form products. The products will now be de-excited vibrationally compared to the reactants.
The 4 simulations illustrate Polanyi's Rules for late and early TS.
Ng611 (talk) 12:00, 22 May 2019 (BST) Great answer!
Bibliography
- ↑ G. Thomas, R. Finney and M. Weir, Calculus and analytic geometry, Addison-Wesley, Boston, 2003.
- ↑ G. Strang and K. Borre, Linear algebra, geodesy, and GPS, Wellesley-Cambridge Press, Wellesley, Mass., 1997.
- ↑ D. Sheppard, R. Terrell and G. Henkelman, The Journal of Chemical Physics, 2008, 128, 134106.
- ↑ D. Truhular, W. Hase and J. Hynes, Chemischer Informationsdienst, 1983, 14.
- ↑ I. Levine and I. Levine, Physical Chemistry, McGraw-Hill, New York, 2008.
- ↑ P. Atkins and J. De Paula, Atkins' Physical chemistry, Oxford University Press, Oxford, 2006.
- ↑ P. Atkins and J. De Paula, Atkins' Physical chemistry, Oxford University Press, Oxford, 2006.
- ↑ D. Truhlar, B. Garrett and N. Blais, The Journal of Chemical Physics, 1984, 80, 232-240.
- ↑ J. Polanyi and K. Woodall, The Journal of Chemical Physics, 1972, 57, 1574-1586.
- ↑ J. Polanyi and K. Woodall, The Journal of Chemical Physics, 1972, 57, 1574-1586.
- ↑ P. Atkins and J. De Paula, Atkins' Physical chemistry, Oxford University Press, Oxford, 2006.
- ↑ P. Atkins and J. De Paula, Atkins' Physical chemistry, Oxford University Press, Oxford, 2006.

