MRD:01106385
Analysis of an H2 + H system
The system under study is one where a H2 molecule collides with another H atom. The distance between the atoms in the H2 (B and C) molecule will be referred to as r1 and the distance between the H atom (B) that will bind to the other H (A) is r2. The momentum p1 will refer to the momentum between B and C and p2 will refer to the momentum between A and B.
Transition structures and minima of a potential energy surface
(Question 1) The transition structure is a saddle point in the potential energy surface (PES). It is where r1 = r2. The gradient at both the transition state and the minimum of the PES is 0. The transition state can be distinguished as it is a saddle point and the energy goes down most steeply along the minimum energy path linking reactants and products either side of this point. Therefore, if the geometry is changed slightly to either the products or reactants the trajectory of the PES will roll towards the products or reactants respectively. This can be done by starting a trajectory near to where the transition state should be and seeing whether they roll to the products or reactants and this will allow you to locate the transition state.
Ng611 (talk) 19:29, 24 May 2018 (BST) What are the two directions the curvature should be evaluated along to confirm that it is a TS?
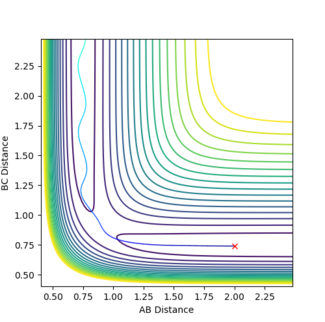
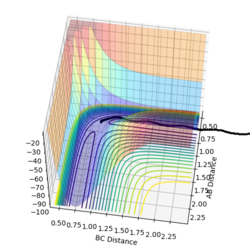
(Question 2) Since the transition state must be when r1 = r2, this was set for this system with both being set to 1, also p1 and p2 were set to zero. By studying the PES it was seen that the trajectory oscillated on the ridge. The transition state itself will be the middle of this oscillation as there should be no/little kinetic energy at this state so other values of r1 and r2 were used until there was no oscillation. The best estimate for rts was found to be 0.9077 Å as can be seen in figure 1.

Minimum energy path (MEP) and Dynamic trajectories
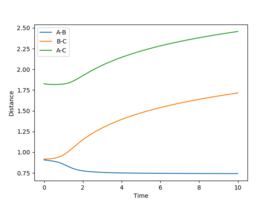
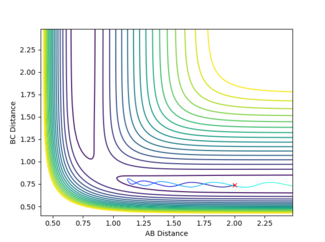
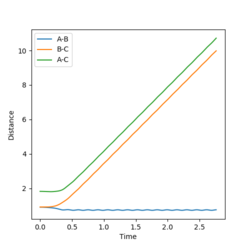
(Question 3) An MEP calculation was carried out for this system with r1 = rts + 0.01 and r2 = rts and the momenta remaining as zero. This calculation results in a trajectory on the PES that simply follows the floor from the transition state to initial product formation with no oscillation occurring as it is happening in infinitely slow motion. This is seen in figure 2. This is also seen in figure 3 where the starting point is the transition state and the r1 increases to 1.71481 Å (orange line) and r2 decreases to 0.742235 Å (blue line).
However, this calculation is not a realistic view of the reaction since the atoms have mass and will have inertial motion in the gas phase. Therefore, a dynamic calculation is more realistic. The surface plot for this can be seen in figure 4 and there are oscillations here because the reaction is occurring at the normal speed and the reaction goes to completion from the transition state and the B-C bond is completely broken. The internuclear distances also oscillate as seen in figure 5, with r1 increasing exponentially to 9.98331 Å and r2 decreasing at first and then oscillating between 0.724084 and 0.756415 Å. The final momenta p1 and p2 equal 2.48096 and 1.30276 respectively.
If the same calculations were done with r2 = rts + 0.01 and r1 = rts, the opposite results will happen as the reaction will run in the other direction from the transition state and will go towards the product.
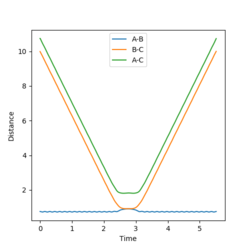
By using the last geometry from the dynamic calculation above and reversing the signs of the momenta values, the reaction will be reversed and r1 will decrease back to the transition state value and r2 will increase back to the transition state value. This can be seen in figure 6.
Reactive and unreactive trajectories
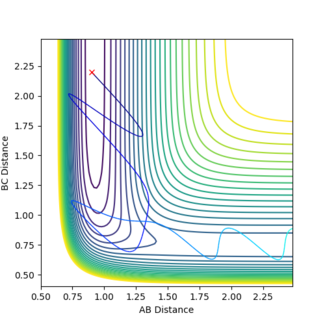
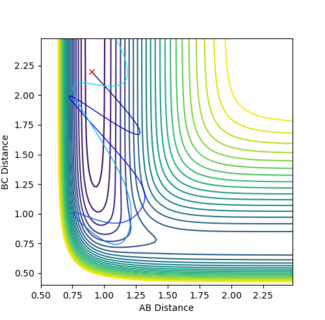
(Question 4) Hypothesis: "By increasing the momenta of both AB and BC, p2 and p1 respectively, and keeping the same starting positions of r1 = 0.74 and r2 = 2.0, the trajectory should always be reactive and have enough kinetic energy to overcome the activation barrier"
The following table tests this hypothesis:
From this table the hypothesis is evidently incorrect as the momenta was increased from the initial values of the momenta for each reaction run, however reactions 2 and 4 were unreactive.
Transition state theory
(Question 5) There are three main assumptions for transition state theory:[1]
- The atoms in the reactant state have energies that are Boltzmann distributed. This should be satisfied if the system has had enough time to thermally equilibrate.
- An incoming flux of reactants should be thermally equilibrated.
- Once the system attains the transition state, with a velocity towards the product configuration, it will not reenter the initial state region again.
Ng611 (talk) 19:31, 24 May 2018 (BST) Another key assumption that you should consider mentioning is that TS theory assumes classical behaviour. Are there any quantum mechanical effects that will influence the reaction rate?
From the results in the table above, one can safely say that predicted reaction rates will be an overestimate of what is calculated experimentally. This is because the reaction is assumed to take place with classical mechanical rules which doesn't occur as shown by reactions 4 and 5 with the activation barrier being recrossed and the initial state region is reentered which breaks assumption 3 spectacularly. This will lead to a longer reaction time than predicted.
Ng611 (talk) 19:31, 24 May 2018 (BST) Good section!
Analysis of an F - H - H system
Classifying reactions of the system
(Question 6) The reaction of F + H2 is exothermic because H-F is a stronger bond than the H-H bond due to a larger electronegativity difference between atoms. This causes energy to be released into the surroundings as the enthalpy of formation of HF compensates for the enthalpy of dissociation of H2. However, the reaction of HF + H is endothermic because of the opposite reasons which leads to heat being taken in from the environment into the system to break the HF bond as the enthalpy of formation of the H-H bond doesn't compensate for it.[2]
Locating the transition state
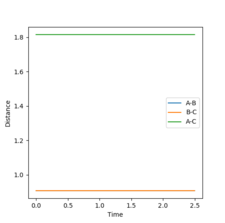
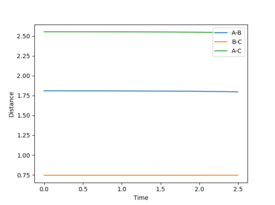
(Question 7) This was done using Hammond's postulate which states that the transition state of a reaction resembles the reactants in an exothermic reaction and the products in an endothermic reaction.[3] Therefore by optimising the distances between the atoms in the system to be close to the reactants in the exothermic reaction of F + H2 the transition state will be seen if the momenta of both molecules is kept to zero. This is seen in figure 7 as there is no oscillation when the atoms are separated by the distances of 1.81 and 0.745 Å for AB and BC respectively. This will be the same for both reactions because the reactants for the exothermic reaction in this system are the same as the products of the endothermic reaction (H2 + F).
Activation energies for the reactions of the system
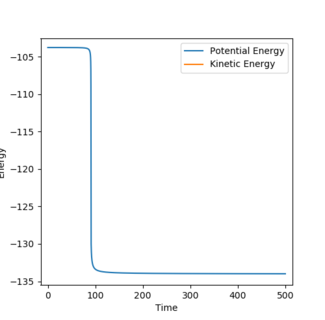
(Question 8) The activation energy is given as the energy between the minima of the reactants and the maxima of the transition state, therefore, it can be calculated by subtracting the reactant energy from the transition state energy. The energy of the transition state in this system is -103.752 Kcal/mol. By carrying out MEP calculations when the bond lengths were altered by 0.01 to resemble the reactants of the reactions the energy of the reactants can be seen from an energy vs time plot as seen in figures 8 and 9.
H2 + F activation energy: -103.752 - (-103.948) = 0.196 Kcal/mol
HF + H activation energy: -103.752 - (-133.992) = 30.24 Kcal/mol

Reaction dynamics
Mechanism of release of the reaction energy
A reactive trajectory for the H2 + F reaction was found using the following conditions:
rH-F = 2.2 Å, rH-H = 0.7 Å, pH-F = -3.0, pH-H = -1.4
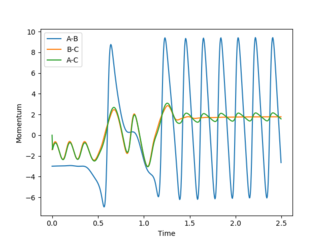
(Question 9) As discussed earlier this is an exothermic reaction and will result in a release of energy to the environment. As can be seen from figure 10 the vibrations of the product HF molecule are much larger than the vibrations of the reactant molecule. This is due to the energy that is released is not lost but is conserved into kinetic energy which increases the amplitude of the oscillations of the molecules in the reaction as can be seen in figure 11.
This can be verified experimentally using IR spectroscopy since overtone bands would be produced corresponding to higher vibrational states.

Polanyi's empirical rules
(Question 10)These rules state that vibrational energy is more efficient in promoting an endothermic reaction (late activation barrier) than translational energy, and vice versa for an exothermic reaction (early activation barrier).[4]
In this system, since, as discussed earlier, the F + H2 reaction is exothermic, and as stated in Hammond's postulate the transition state will resemble the reactants which means there is an early activation barrier. Therefore, according to Polanyi an increase in translational energy should result in a reactive trajectory. This was tested by increasing p2 (translational energy) and decreasing p1 (vibrational energy) for this reaction.
In figure 12 p1 is 0.85 and p2 is -5.5 and a reactive trajectory is produced. The opposite is seen in figure 13 where p1 is 1.0 and p2 is -5.0. So by changing the momenta by just 0.15 and 0.5 respectively the trajectory becomes unreactive. This shows that this reaction obeys Polanyi's rules by being a reaction with an early activation barrier that is only reactive in systems of high translational energy.
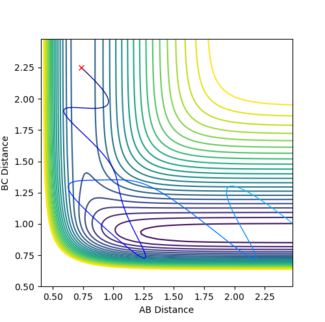
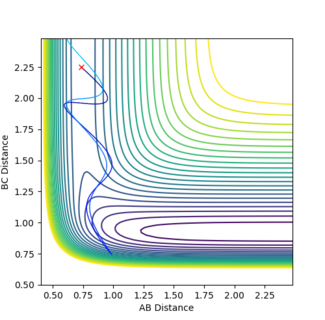
The HF + H reaction is, as discussed earlier, an endothermic reaction, and as stated in Hammond's postulate the transition state will resemble the products which means there is a late activation barrier. Therefore, according to Polanyi an increase in vibrational energy should result in a reactive trajectory. This was tested by increasing p1 (vibrational energy) and decreasing p2 (translational energy) for this reaction.
In figure 14 p1 is 7.5 and p2 is -1.82 and a reactive trajectory is produced. The opposite is seen in figure 15 where p1 is 7.0 and p2 is -2. So by changing the momenta by just -0.5 and -0.18 respectively the trajectory becomes unreactive. This shows that this reaction obeys Polanyi's rules by being a reaction with a late activation barrier that is only reactive in systems of high vibrational energy.
Ng611 (talk) 19:34, 24 May 2018 (BST) Good second section and well-written report. Well done.
References
- ↑ T. Bligaard, J.K. Nørskov, in Chemical Bonding at Surfaces and Interfaces, 2008.
- ↑ Petrucci, R., Herring, F., Madura, J. and Bissonnette, C. (n.d.). General chemistry, 2015.
- ↑ Clayden, J., Greeves, N. and Warren, S. Organic chemistry. Oxford: Oxford University Press, 2012
- ↑ Zhang, Z., Zhou, Y., Zhang, D., Czakó, G. and Bowman, J. The Journal of Physical Chemistry Letters, 3(23), pp.3416-3419, 2012.

