MRD:01075185
H + H2 reaction system investigation
What value do the different components of the gradient of the potential energy surface have at a minimum and at a transition structure? Briefly explain how minima and transition structures can be distinguished using the curvature of the potential energy surface
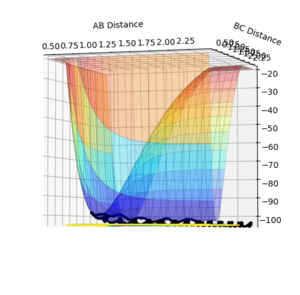
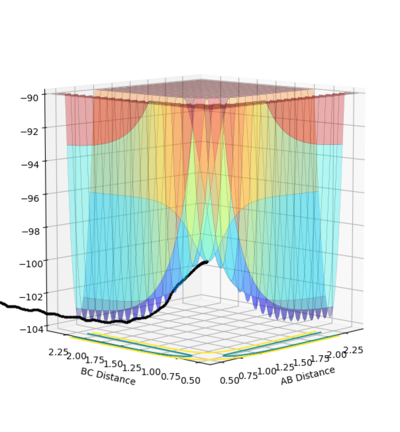
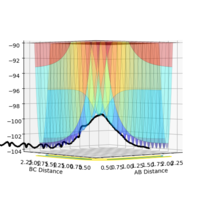
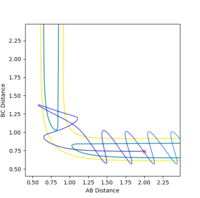
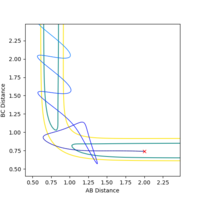
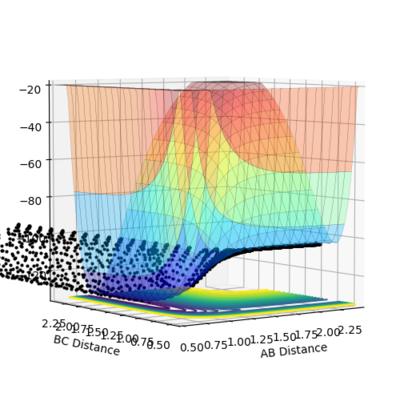
An image of the potential energy curve of the reaction of H and H2:
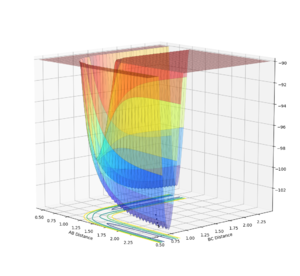
An image of the potential energy curve expanded with reduced number of steps:
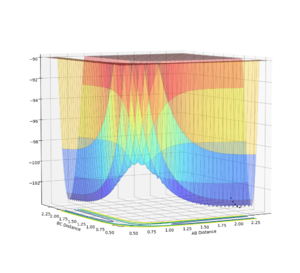
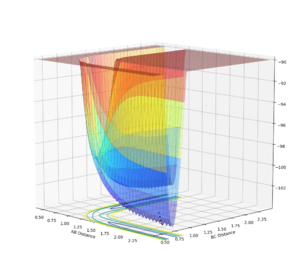
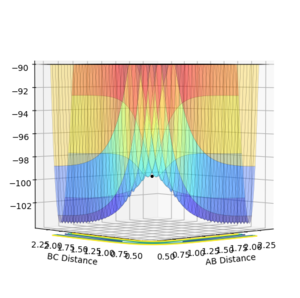
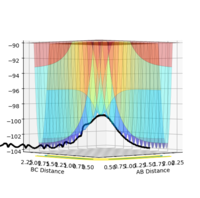
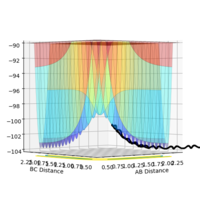
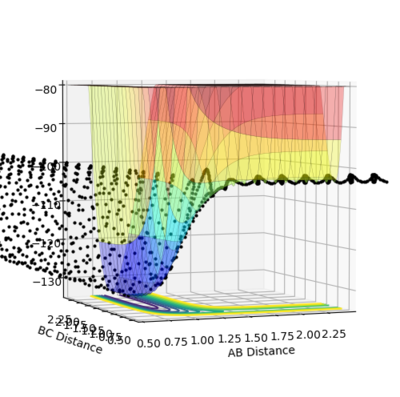
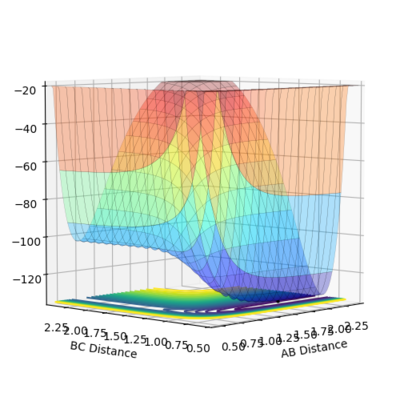
In order to view the transition point being a maximum and a minimum at the same time, the image can be viewed in different diagonal perspective which are represented in the two images below:
Image showing PES curve at maximum in its transition state:
Image showing PES curve at minimum in its transition state:
In these two diagonal views of the PES at the transition state, the curve is at its maximum and minimum at the same time and thus it can be concluded that it is a saddle point.
However for the starting and the ending point of the reactive pathway which can be better viewed by trail of black dots in the first image, the PES curve is at minimum (first derivative is 0 and the second derivative is positive) viewing from perspective of either axis.
So to answer the question 'What value do the different components of the gradient of the potential energy surface have at a minimum and at a transition structure? Briefly explain how minima and transition structures can be distinguished using the curvature of the potential energy surface.',
Ultimately, one can distinguish between transition state and reactant and product by looking curvature of the PES or more specifically at the second derivative of the PES curve. If the second derivative of the curve can be either positive or negative, meaning that it is a maximum and a minimum from looking at different diagonal perspective, the reaction is at its transition state. If the second derivative of the curve is at a minimum from the view of either axis, the reaction is at its reactant state or have reached the product state.
This finding can be explained in terms of the reaction coordinate. In the diagonal view which represents the minimum of the PES curve at its transition state, moving diagonally in either direction refers to the distance of AB and BC both getting larger or shorter. When the distance gets shorter it means that the three hydrogen atoms are being squeezed into each other which makes it unstable thus exponentially increasing the potential energy. The distance of AB and BC both getting larger refers to breaking the semi bond between AB and BC that had formed in the transition state thus once again having an exponential rise in the potential energy.
In the diagonal view of the PES which shows that it is a maximum, going diagonally to the left refers to the distance of AB getting shorter while the distance of BC getting larger, at the point where the 2 bonds are at equal distance to each other and B are forming a semi bond with both A and C (the transition state), if we go diagonally to the left, the distance of AB would get closer and BC get larger thus forming a AB bond and breaking and BC bond which is getting towards the product which is at the minimum and is stable. Going diagonally right would do the opposite, going back to the reactant which is still stabler then the transition state where there is a H3 semi tri-atomic state that is unstable.
Jas213 (talk) 20:53, 28 May 2018 (BST) A very long, visual and wordy reply. Being more concise and giving some equations would have made it much easier to follow.
Finding the best estimate of the transition state position (rts) and the explanation for it
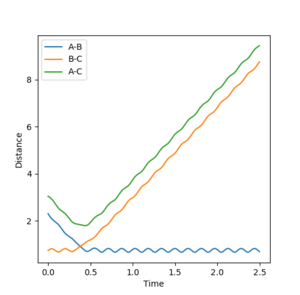
At the transition state the bond distance between AB and BC would be equal and once again would be at the saddle point of the PES curve. If the transition state is not located to a good approximation, the inter-nuclear vs time plotting would show large oscillation between distance of AB and BC as the reaction pathway would be rising and falling along the potential well of the PES curve (in the point of view where the PES is a minima). However in a relatively good approximation, the same plotting would show less oscillation and thus would be plotted almost as if there is a single dot on the exact transition state saddle, point of the PES curve.
From looking at the inter-nuclear distance vs time graph of the original reaction pathway, I made an approximation of what the distance between AB and BC would be in around the transition state.
The inter-nuclear distance vs time graph shows the distance AB and BC are very similar in around 0.961. By setting the initial condition with 0 momentum for both AB and BC and just changing the distance between AB and BC where both should be same in the transition state, I concluded that about 0.9075 angstroms is a very good approximation of the distance between AB and BC in the transition state.
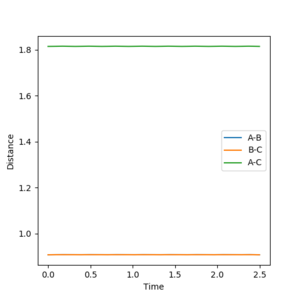
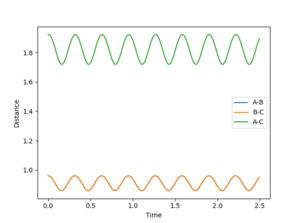
The inter-nuclear distance vs time plot at distance of 0.9075 vs 0.961, respectively:
As the distance between AB and BC are the same as set in the initial condition (the transition state), the orange line is covering over the blue line which explains why blue line is not seen. The green line represents the distance between AC which should be double the either distance between AB or BC, once again as set in the initial condition. This value is 1.8150 angstroms. The plot shows that the 0.961 angstroms approximation is not as good as the 0.9075 angstroms approximation as there are oscillations clearly showing in the plot.
The PES curve at this distance:
At this distance with having 0 momentum of AB and BC, the PES curve does not show an oscillating black curve, instead shows a single black dot and the inter-nuclear distance vs time graph resembles almost a straight line with very less oscillation meaning that this is a good approximation of the transition state. *All distances are represented in angstroms
Comment on how the mep and the trajectory you just calculated differ
Image of dynamic and mep calculation trajectory, respectively:
As the reaction path for dynamic calculation, the reaction pathway is more wavy, in an oscillatory manner, while the reaction path for mep calculation shows a smooth reaction pathway which simply follows the valley floor of PES curve. The mep calculation also requires many steps to receive a full reaction pathway, it required 9000 steps to get the above plot compared to 553 steps to get the reaction pathway using dynamic calculation method.
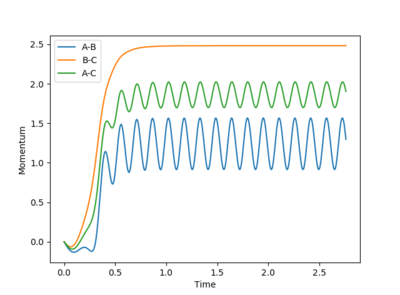
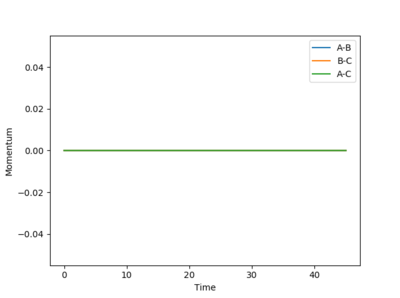
Image of dynamic and mep calculation momentum vs time plot, respectively:
The momentum is zero throughout for the mep calculation while the momentum oscillates for the dynamic calculation plot. This shows that although mep calculation method is useful in characterising a given chemical reaction it does not provide a realistic picture. The mass of the atoms are assumed to be zero in the mep calculation thus the momentum m x v being zero throughout. However in a realistic chemical reaction, every atoms have a mass (thus a momentum) and vibrational energy.
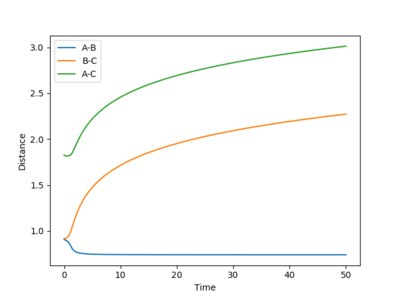
Image of dynamic and mep calculation inter-nuclear distance vs time plot, respectively:
While the inter-nuclear distance between AB are oscillating in the dynamic calculation, that of mep calculation shows a straight line. This shows that the mep calculation completely ignores vibrational energy of a molecule. The exact same conclusion can be made from the oscillating momentum vs time plot from dynamic calculation as oscillatory momentum refers to vibrational motion in our chemical reaction.
Jas213 (talk) 20:57, 28 May 2018 (BST) Very good and detailed explanation. I like that you stated the difference in the number of steps need as well.
Reactive and unreactive trajectories: Complete the table by adding a column with the total energy, and another column reporting if the trajectory is reactive or unreactive. For each set of initial conditions, provide a plot of the trajectory and a small description for what happens along the trajectory
Jas213 (talk) 20:59, 28 May 2018 (BST) Now that more detailed descriptions of the trajectories would be beneficial and show your understanding, you're being surprisingly short. Also stating the initial conditions of the experiment would have been great.
Jas213 (talk) 20:59, 28 May 2018 (BST) A conclusion of what you learnt from this table would have been expected.
State what are the main assumptions of Transition State Theory. Given the results you have obtained, how will Transition State Theory predictions for reaction rate values compare with experimental values?
There are two main assumptions made in the transition state theory. The first is that the atoms in the reactants state will have energies corresponding to the Boltzmann distribution. The second is that once the transition state is attained, the system will undoubtedly proceed to the products not re-enter the initial reactant states. The penultimate set of conditions in the table of total energy with different momentum shows that the second assumption does not reflect some reactions. The transition state is attained, yet the system re-enters the initial reactant state instead of proceeding to the product state. The plot shows that at high momentum, there is such a high energy that the reaction pathway no longer follows along the valley of the PES curve and as a result, the possibility of transition state bumping back into the initial reaction state arises.
Ultimately, the rate of reaction predicted using transition state theory would be faster than that of experimental values. Due to barrier recrossing phenomena, which is not accounted for in the transition state theory, the experimentally-determined rate of the reaction would be slower. As the penultimate set of initial conditions suggest, the reaction might not proceed to the final product state after attaining the transition state, ending up having a non-evaluate-able reaction rate as there are no products formed.
Jas213 (talk) 21:01, 28 May 2018 (BST) Correct, but where are your references for TST?
F - H - H reaction system investigation
F+ H2 reaction system investigation
F+H2 reaction PES curve:
The reaction trajectory shows that the reaction of F + H2 system is exothermic. The product is much lower in energy than the reactant meaning that the energy is released in the reaction process, thus exothermic (i.e. the bond strength of H-F is much stronger than that of H-H). Unlike the previous H + H2 reaction, the transition state is less visible in the PES curve. *Hammond's postulate states that the structure of the transition state resembles that of the species that is closer to in energy. In an exothermic reaction (same case as for F + H2 system here), the transition state is much closer in energy to the reactant, thus its transition state can be approximated along the reaction trajectory near the initial reactant states. This also means that the activation energy is very small for this reaction.
F+H2 transition state approximation, inter-nuclear distance vs time plot:
The approximation was made at F-H distance (or AB distance as run in the program) 1.810 angstroms and H-H distance (or BC distance) 0.746 angstroms. The inter-nuclear distance vs time plot shows almost a straight line for the distances between F-H and H-H meaning that the transition state was properly approximated. These distances are also consistent with the Hammond's postulate as the H-H bond is just very slightly displaced from 0.74 angstroms (the bond distance of H2 molecule). The transition state resembles the initial reaction state very much.
F+H2 reaction energy vs time curve:
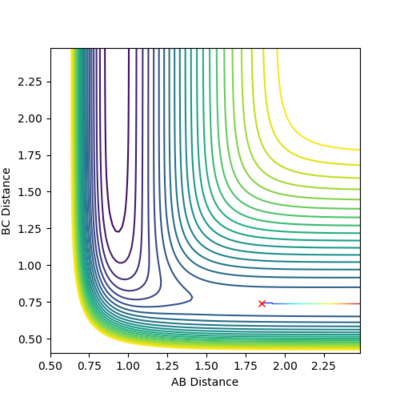
F+H2 reaction contour plot that corresponds to the reaction pathway of the energy vs time curve:
As the contour plot suggests, the initial conditions that I have used to identify the activation energy (F-H distance of 1.85 angstroms and H-H distance of 0.742 angstroms) encourages the reaction pathway to start approximately around from the transition state back towards the initial reaction state. This means that the starting point of the energy vs time graph is the energy of the transition state which gradually falls to the energy of the initial reaction state.
The difference in the energy between the transition state and the initial reactant state (or the activation energy) for F+H2 reaction is calculated to be approximately 0.204 kcal/mol. In order to calculate a more accurate value of activation energy, inter-nuclear distances that are much closer to the transition state and that is sloping towards the initial state at the same time(F-H distance of 1.87 angstroms and H-H distance of 0.741 angstroms) was used. With having 200,000 steps of calculation, the calculated activation energy was 0.233 kcal/mol which is 0.029 kcal/mol higher than the initial calculation.
The other method to calculate the activation energy is to set the inter-nuclear distance between F-H very large (e.g. 10000 angstroms) and that of H-H as 0.74 angstroms which is the normal bond length of H2 molecule. The potential energy recorded at this state (with just having 1 step calculation to record to energy at that exact point) would be the theoretical initial reaction state energy. The difference in the potential energy between this theoretical energy and the transition state energy (which could be simply calculated using set conditions for transition state that was approximated earlier) would give us the theoretical activation energy. This was calculated 0.254 kcal/mol. However, one should not forget that the transition state position is 'approximated', thus it would be incorrect to say that this is the theoretical transition energy. It would simply be the best approximation of the transition state energy that we can make within the approximations made in the earlier stage.
H + HF reaction system investigation
Before interpreting the data, it is important to note that this reaction is the reverse process of the previously investigated reaction, F+H2 -> H+HF
H+HF reaction PES curve:
It is identical to the PES curve of F+H2 reaction but with swapped over axis. The AB distance which represented the inter-nuclear distance between F-H is now the inter-nuclear distance between H-H and the same applies for the BC distance. The reverse process (H+HF) is endothermic and thus by applying Hammond's postulate, one can expect to find the transition state along the reaction trajectory of the final product state which is the exact same as the initial reactant state of the reaction F+H2. This approximation was already made in the previous section that is 1.810 angstroms (H-F, BC distance in this reverse process) and 0.746 (H-H, AB distance in this reverse process).
H+HF reaction energy vs time plot:
Since the reaction H+HF to form H2 and F is the reverse process of F+H2, the energy vs time plot of the previous reaction is used to calculate the activation energy. The energy difference is the enthalpy change of the reaction, not the activation energy of the reaction. Thus the activation energy for F+H2 reaction has to be added to the enthalpy change of the reaction which is represented by the height difference of the energy vs time plot to find the activation energy of the reverse process.
The enthalpy of reaction is calculated to be 29.996 kcal/mol and the activation energy of F+H2 was calculated in the previous section as 0.204 kcal/mol. This ultimately gives the activation energy of H+HF reaction as 30.200 kcal/mol.
Jas213 (talk) 21:05, 28 May 2018 (BST) Very good in-depth discussion of working on how both Ea were obtained.
Reaction dynamics F-H-H system
Now for the F+H2 reaction dyanmics:
In light of the fact that energy is conserved, discuss the mechanism of release of the reaction energy. How could this be confirmed experimentally?
According to the law of conservation of energy, in a closed system the amount of energy is fixed. It can neither be created nor destroyed but can only change form from one to another. In our exothermic F+H2 reaction, the potential energy dropped to form a much stabler H+HF product. The potential energy that the initial reactant sate had was not destroyed in the process of our reaction but transformed into translational and vibrational energy of our product.
F+H2 reactive trajectory momentum vs time graph and PES curve, respectively:
These graphs were attained from inter-nuclear distance of 2.3 angstroms F-H (AB) and 0.74 angstroms H-H (BC) with momentum of -0.8 and 0.1, respectively. This is an experimentally-proven reactive trajectory that successfully crosses the activation barrier (as proven in the trajectory of the PES curve) to form the product. The momentum vs time graph shows that the potential energy of the product AB (HF) transformed into translational and vibrational energy. The momentum of AB (our product HF) didn't have any largely visible oscillation initially (kinetic energy) but started to oscillate in the transition and the final product state. The potential energy of our initial reactant state converted into the kinetic energy of our final product state and as a result, increased the temperature of the system.
Discuss how the distribution of energy between different modes (translation and vibration) affect the efficiency of the reaction, and how this is influenced by the position of the transition state
While investigating the H+H2 system, barrier recrossing phenomena was first observed where the system had enough energy (greater than the activation energy) yet the reaction would not proceed towards the product state. Firstly for the F+H2 reaction system, multiple sets of initial conditions with the same inter-nuclear distance between them yet with different momentum were explored. The inter-nuclear distances of 2.3 angstroms F-H and 0.74 angstroms for H-H was used with varying momentum.
| p(HH) | p(FH) | Plot of trajectory | Reactivity of trajectory | |
|---|---|---|---|---|
| 0.1 | -0.8 | 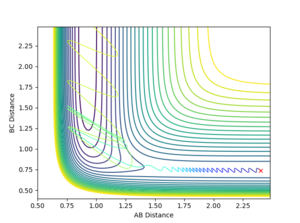 |
Reactive | |
| 0.1 | -0.5 | 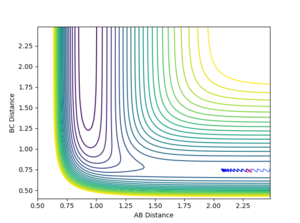 |
Non-reactive | |
| 3 | -0.5 |  |
Non-reactive, barrier recrossing phenomena is observed |
The table shows that in a simple one-step exothermic reaction where by Hammond's postulate the transition state closely resembles the structure of the reactant (early barrier), the translational energy is more efficient than the vibrational energy in making the reaction reactive. When the momentum between two Hs is increased from 0.1 to 3 while having constant momentum between F and H, the reaction undergoes barrier recrossing and remains unreactive. However when the momentum between F and H was increased by 0.3 (negative value corresponds to the atoms moving towards each other), the reaction trajectory successfully passed the potential barrier and has formed the product.
Although it is not entirely true, it can be approximated that the momentum between F and H in this F+H2 reaction trajectory is more related to the translational energy than vibrational energy and the vice versa for momentum between H and H. When the momentum between H-H was increased from 0.1 to 3, the reaction trajectory oscillates hugely which infers that the H-H momentum is more vibrational and the F-H momentum is more translational. Finally, from this approximation, it can be concluded that the translational energy makes the dominant contribution in reactivity in an exothermic reaction.
Jas213 (talk) 21:09, 28 May 2018 (BST) whose rules does this agree with?
Now for the endothermic cas: H+HF
The inter-nuclear distances were set as 0.917 angstroms for H-F which is its normal bond length and 2.40 angstroms for H-H. In an endothermic process, the transition state resembles the product by Hammond's postulate and is a late barrier.
| p(HH) | p(FH) | Plot of trajectory | Reactivity of trajectory | |
|---|---|---|---|---|
| -10 | -1 | 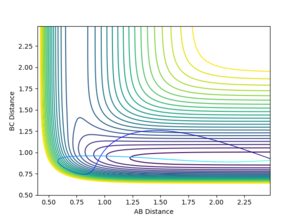 |
Non-reactive | |
| -1 | -12 | 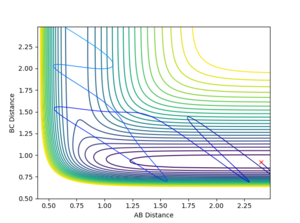 |
Reactive |
For the reaction H+HF system, the opposite trend could be observed. The momentum between HF is more relevant to the vibration than the translation as they are bonded to each other. When there is a high translation with low vibration, the reaction trajectory does not pass the potential barrier. However when the vibration is high and translation is low, the reaction proceeds to the final product state. It is important to note that this is a relationship shown empirically and would definitely not be the absolute case for every A+BC reaction system. Nevertheless, it gives a general idea of which energy type, either translational or vibrational, is more efficient in making the either exothermic or endothermic reaction happen.
Jas213 (talk) 21:11, 28 May 2018 (BST) For someone who is that detailed in the replies, it is crazy that you left out to mention that your observations are in agreement with "Polanyi's rules".
Bibliography
Brouard.chem.ox.ac.uk. (2018). [online] Available at: http://brouard.chem.ox.ac.uk/teaching/dynlectures4to6.pdf [Accessed 18 May 2018].
J. I. Steinfeld, J. S. Francisco, W. L. (n.d.) ' Statistical Approach to Reaction Dynamics: Transition State Theory', in J. I. Steinfeld, J. S. Francisco, W. L (ed.) Chemical Kinetic and Dynamics. : , pp. .
Wiki.ch.ic.ac.uk. (2018). CP3MD - ChemWiki. [online] Available at: https://wiki.ch.ic.ac.uk/wiki/index.php?title=CP3MD [Accessed 14 May 2018].

