MRD:01056483
H + H2 system

On a potential energy surface diagram, how is the transition state mathematically defined? How can the transition state be identified, and how can it be distinguished from a local minimum of the potential energy surface?
The Transition state is defined as the maximum on the minimum energy path between the reactants and the products. Mathematically, this occurs at a saddle point where the first order partial derivative in any direction is 0, the second order partial derivative along the reaction coordinate is <0 and along the orthogonal coordinate is >0. In contrast, a local minimum would have a second order partial derivative >0 for both.
Ng611 (talk) 16:09, 7 June 2019 (BST) Good, a diagram displaying the two vectors you describe would help but otherwise this is a good answer. Don't be afraid of adding in some equations!
Report your best estimate of the transition state position (rts) and explain your reasoning illustrating it with a “Internuclear Distances vs Time” plot for a relevant trajectory.
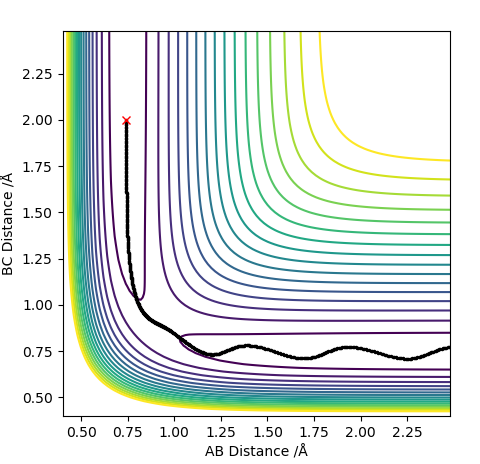
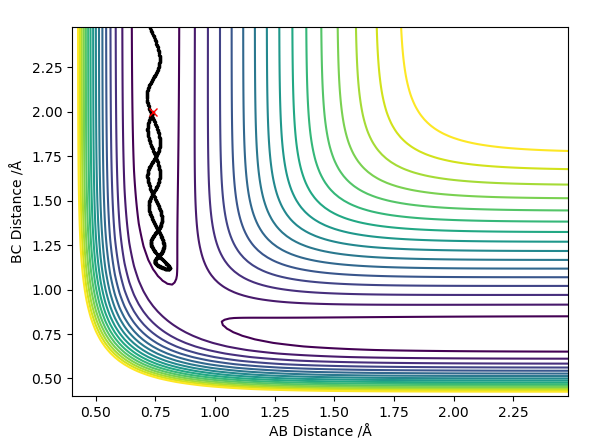
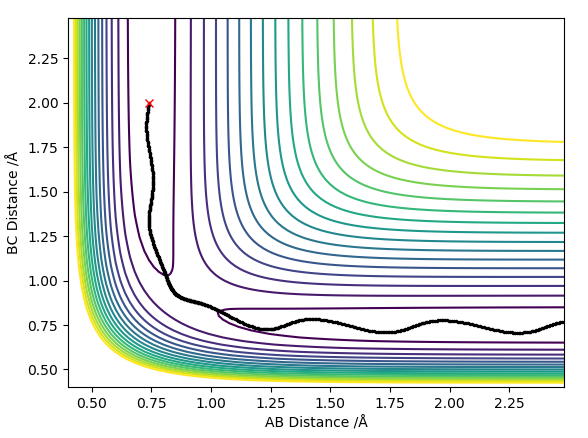
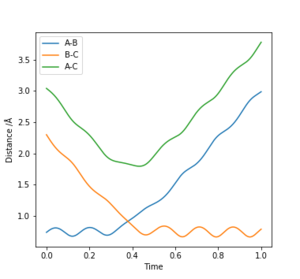
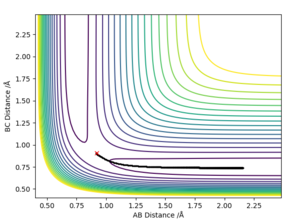
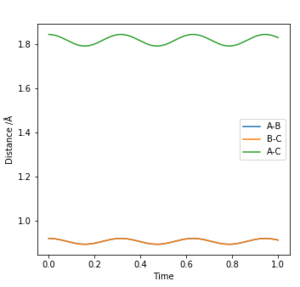
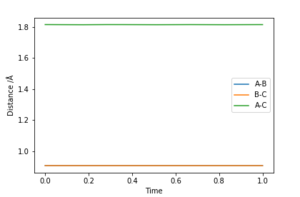
The best estimate of the transition state position rts was found to be rts = 0.908 Å. This was found through trial and error, by starting trajectories on the ridge r1 = r2 with p1 = p2 = 0. The transition state must have r1 = r2 since the H + H2 surface is symmetric, and since the transition state occurs at a maximum a trajectory begun at rts with no momentum will not move. Therefore, the inter-nuclear distance would remain constant with time. The initial guess was made using the conditions shown in figure 1 by estimating the distance at which the lines AB and AC cross to be 0.921 Å. This still showed oscillation initially (figure 2) and separation at higher step counts, as opposed to the stationary state observed in figure 3, with r1 = r2 = 0.908 Å.
Comment on how the mep and the trajectory you just calculated differ.
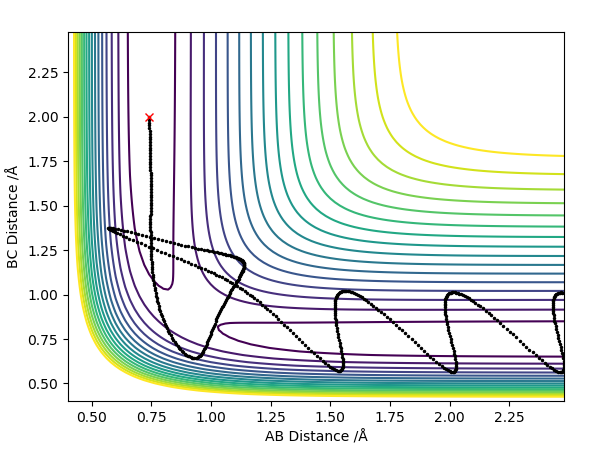
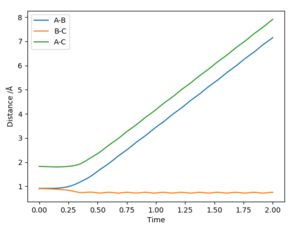
With a small initial displacement from the transition state, r1 = 0.918 Å and r2 = 0.908 Å, and no initial momentum, the minimum energy path was calculated as shown in figure 4. It differed from the dynamic trajectory (figure 5) in that there were no oscillations as it followed its path to H1 + H2-H3. In reality, the atoms do not follow the mep since there is vibrational energy in the bond. This causes them to oscillate about the mep. This is again reflected in the plots of inter-nuclear distance vs time, with the dynamic trajectory (figure 6) showing oscillation in the line BC. Here, there is also a linear increase of distance between atoms A and B after around T = 0.4, since A is a free particle and continues with the same velocity in the absence of external force. Conversely, the mep distance plot shows the rate of change of distance levelling off, which is unrealistic.
Ng611 (talk) 16:12, 7 June 2019 (BST) Unrealistic but highly useful. Can you think about why?
Since the H + H2 surface is symmetric, when the initial conditions are set to r1 = 0.908 Å and r2 = 0.918 Å instead, the same results are observed but with C escaping as a free particle and A and B bonded.
At T = 2, the final values for position and momentum were:
r1 = 7.1549 Å
r2 = 0.7555 Å
p1 = 2.4806 kgm/s
p2 = 1.1256 kgm/s
Setup a calculation where the initial positions correspond to the final positions of the trajectory you calculated above, the same final momenta values but with their signs reversed. What do you observe?
In this case, it was observed that the particles travelled back along the above path and eventually reached the transition state.
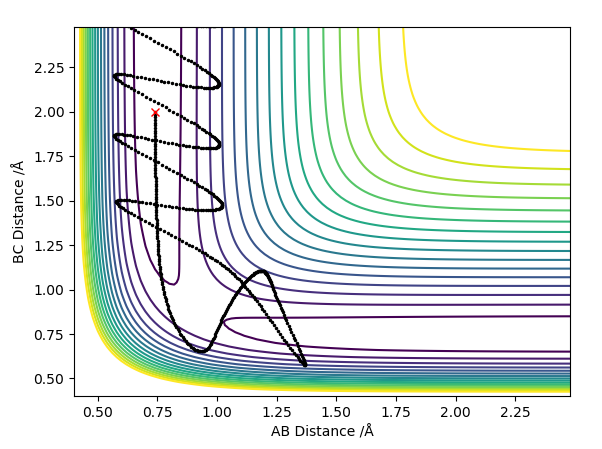
Complete the table by adding the total energy, whether the trajectory is reactive or unreactive, and provide a plot of the trajectory and a small description for what happens along the trajectory. What can you conclude from the table?
From the table it can be concluded that not all trajectories with sufficient momenta to overcome the activation barrier will result in the formation of products, since the barrier can be recrossed.
State what are the main assumptions of Transition State Theory. Given the results you have obtained, how will Transition State Theory predictions for reaction rate values compare with experimental values?
The main assumptions of Transition State Theory are:
1) Nuclear and electronic motion can be separated, equivalent to the Born-Oppenheimer approximation.
2) The reactant molecules are distributed among their states in accordance with a Boltzmann distribution.
3) Molecular systems that have crossed the TS in direction of products cannot turn around and reform reactants.
4) In the TS, motion along the reaction coordinate may be separated out from other motions and treated as a translation.[1]
Given the results above, it is clear that these assumptions do not always hold true since the TS was regenerated in the fourth and fifth examples. Therefore, the experimental rate of reaction is likely to be lower than that predicted by Transition State Theory due to some "go back" over the barrier.
Ng611 (talk) 16:13, 7 June 2019 (BST) Excellent. Can you think of anything else that would lead to deviations from TS theory? (protip: think about quantum mechanical effects)
F-H-H system

By inspecting the potential energy surfaces, classify the F + H2 and H + HF reactions according to their energetics (endothermic or exothermic). How does this relate to the bond strength of the chemical species involved?
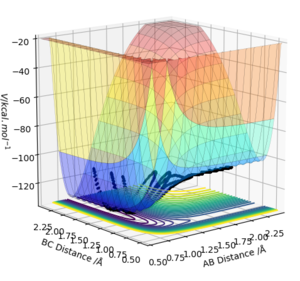
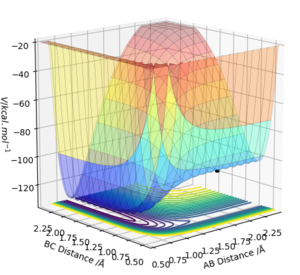
Figure 7 and figure 8 show the potential energy surfaces for F + H2 and H + HF respectively. By inspection of figure 7, it can be seen that the F + H2 reaction is exothermic as there is a large drop in energy when the distance AB is low, i.e. when F and H are bonded. This also implies that the F-H bond is far stronger than the H-H bond. The reverse reaction H + HF is exothermic, as can be seen in figure 8, where again the energy is far lower when F and H are bonded and so a large increase in energy is required for the forward reaction.
Locate the approximate position of the transition state.
Hammond's postulate states that the transition state resembles that of the structure closest to it in energy. In this case, that structure is H2 so the TS will occur when r2 is small (considering the exothermic reaction). Through trial and error, the transition state was located at r1 = 1.81354 Å and r2 = 0.74 (figure 9). The energy of this transition state was observed to be -103.742 kcal/mol.
Report the activation energy for both reactions.
By performing a mep with 5000 steps and inspecting the energy vs time plot, it was possible to calculate the activation energy of each reaction. That of the endothermic reaction was found to be -103.742-(-133.881)=30.139 kcal/mol, the energy of the F-H molecule (-133.881 kcal/mol) given by figure 10, and that of the exothermic reaction was found to be just 0.075 kcal/mol, the energy of H2 given as -103.817 kcal/mol after 5000 steps by figure 11.


Ng611 (talk) 16:14, 7 June 2019 (BST) Good!
In light of the fact that energy is conserved, discuss the mechanism of release of the reaction energy. Explain how this could be confirmed experimentally.
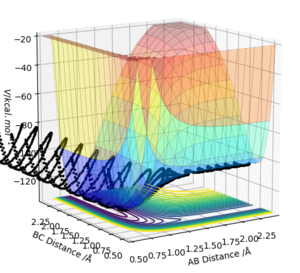
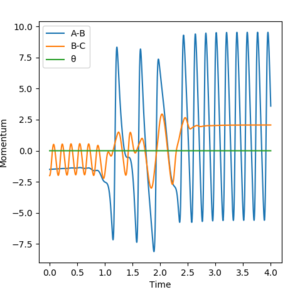
Figure 12 shows a surface plot of the reactive trajectory found for r1=2.3 Å, r2= 0.74 Å, p1= -1.5 kgm/s and p2 = -2 kgm/s. Figure 13 shows a Momenta vs time plot for the same reaction. As can be seen in both figures, there are far larger vibrations in the H-F molecule once formed than in H2. The potential energy released by the reaction has been converted into vibrational energy in the H-F molecule, and this could be confirmed experimentally using IR spectroscopy: there is a net dipole moment in the product HF but not in the reactants, so one would expect to see a peak corresponding to the HF vibration in the product since excitation by light causes a change in its dipole moment.
Ng611 (talk) 16:16, 7 June 2019 (BST) what you describe would confirm the presence of HF, but not the degree of vibrational excitation. What would you see in your IR spectrum to confirm vibrational excitation?
Discuss how the distribution of energy between different modes (translation and vibration) affect the efficiency of the reaction, and how this is influenced by the position of the transition state.
The Polanyi empirical rules state that vibrational energy is more efficient in promoting a late-barrier reaction than translational energy, whereas the reverse is true for an early-barrier reaction.[2]
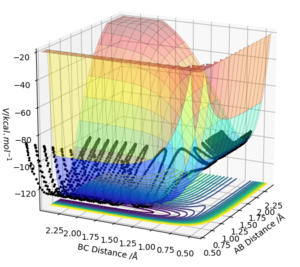
Here, the F + H2 reaction has an early transition state, whereas the H + HF reaction has a late transition state. According to the Polanyi empirical rules, the F + H2 reaction should be heavily promoted by an increase in translational energy rather than vibrational energy. This is confirmed by calculations: as seen in figures 14 and 15, when p1 is low at -0.5 kgm/s, a very high vibrational energy is required for a successful reaction: a value of p2 as high as 2.9 kgm/s does not yield a successful reaction, but 3 kgm/s finally does. In contrast, a small increase in p1 to -0.8 kgm/s gives a successful reaction even with p2 = 0.1 kgm/s (figure 16). Therefore, an increase in translational energy is far more efficient in promoting the exothermic reaction.


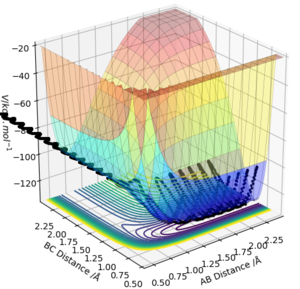
Conversely, the H + HF reaction is far more efficient with an increase in vibrational energy, as shown in figures 17 and 18. For low vibrational energies it was very difficult to generate a successful reaction, however a low p1 value of -0.8 kgm/s gave a successful reaction for p2 = 7 kgm/s.
Ng611 (talk) 16:22, 7 June 2019 (BST) I'm not sure about your units for momentum, a momentum of 7 kgm/s in a single H atom (with a mass of about 1.6e-27 kg) would require your atom to move at about 7x10^27 m/s (or about 10 quintillion times the speed of light).
Ng611 (talk) 16:22, 7 June 2019 (BST) Great trajectories. Good job!

References
- ↑ S.Yaliraki, "Molecular Reaction Dynamics", Lecture 4, Imperial College London, November 2018
- ↑ Zhang, Z., Zhou, Y., Zhang, D. H., Czakó, G. and Bowman, J. M. (2012) ‘Theoretical study of the validity of the polanyi rules for the late-barrier Cl + CHD3 reaction’, Journal of Physical Chemistry Letters, 3(23), pp. 3416–3419. doi: 10.1021/jz301649w.

