MRD:01043697emw15
Molecular Reaction Dynamics
Emily Widjaja (01043697) 2nd Year Computational Labs
Hi Emily :)--Sw2711 (talk) 17:08, 11 May 2018 (BST)
exercise 1: H + H2 system analysis I think you accidentally created a link here--Sw2711 (talk) 17:09, 11 May 2018 (BST)
What values do different components of the gradient of potential energy surface have at minimum and at transition structure? Briefly explain how minima transition state structures can be distinguished using the curvature of the potential energy surface.


While transition state structures are difficult to observe experimentally since they are transient species with a very short lifetime, their formation and breakdown along the reaction pathway on the potential energy surface with regards to different coordinates such as bond lengths and angles can be studied to deduce information about the transition state structure.
In the H+ H2 system analysis, the angle of incidence is set to zero. The transition state coincides with the potential energy minima at the AB and BC internuclear distances (fig 1.1) and the energy maxima (saddle point fig 1.2) when looking at the 3D coordinates along the intrinsic reaction coordinate (the lowest energy pathway connecting H, H2 and the transition state) on the Potential energy Surface (PES). Yep. I think you understand the concept. --Sw2711 (talk) 17:23, 11 May 2018 (BST)The local minima along the PES before the saddle point is the energy of the reactants and local minima after is the products. (1)
At these points, the differentiation of potential energy with respect to internuclear separation must be zero. Using the marble analogy, this means that is a marble is placed at any of these stationary points it will remain balanced until it is given a change in energy.
To distinguish between the transition state and the minima along the intrinsic reaction coordinate, we take the second derivative. If a positive value is obtained, it is the transition state but if the value is negative, it corresponds to a local minima.
In terms of the maths here, this is not very true. You need to check the second partial derivative with respect to both of your x and y components. See whether this video helps.video--Sw2711 (talk) 17:23, 11 May 2018 (BST)
Locating the Transition State
Report your best estimate of the transition state position (rts) and explain your reasoning illustrating it with a “Internuclear Distances vs Time” plot for a relevant trajectory.


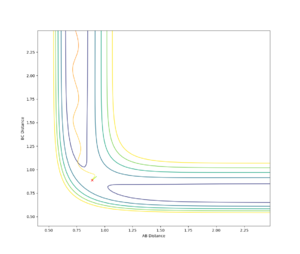
If the starting point is somewhere along the potential well it will roll down into the energy minima to obtain the most negative potential energy which corresponds to the most stable structure. If the starting point is at the transition state exactly, unless there is some energy input, it will stay there. Thus to find the location of the transition state the approximate internuclear separation was found from the intersection of r(ab) and r(bc) in fig 1.4 at around 0.8. this was then optimized at iterations of 0.01 on a contour plot until the starting point changes direction for a change of 0.00001Å (fig 1.5). The transition state found to be at 0.88825Å.
Are you sure? If as you said ‘it will stay there’, we shouldn’t expect any oscillation in fig1.3. In your fig1.3, it clearly formed AB bond and C is rolling away. A consistent oscillation with no intersection in the distance doesn’t mean it is a TS. If you try from 0.88 -> 1.1 A, it is probably all quite similar. --Sw2711 (talk) 17:31, 11 May 2018 (BST)
Calculating the Reaction Path: Looking at the Trajectories
Comment on how the mep and the trajectory you just calculated differ. What it meant is to compare the trajectories using MEP and dynamics. What is the difference?--Sw2711 (talk) 17:41, 11 May 2018 (BST)
The MEP is the minimum energy pathway taken to form the products from the reactants via the transition state. This is dependent on the transition state as there is a downward slope before and after the transition state saddle point - since this determines how much energy is required to reach and overcome this point.
MEP is the minimum energy pathway’ -> Yes. ‘..taken to form the products from the reactants via the transition state’ -> Not quite. For MEP we are looking for the gradient of the surface at a point. For example, this is the trajectory where you place a ball at some point on the energy surface without kicking it. Which way would this ball roll. Try the first example (r1 = 0.74, r2 = 2.3, p1 = 0, p2 = -2.7) and compare using MEP and dynamics, you will see what I mean.--Sw2711 (talk) 17:41, 11 May 2018 (BST)


The dependency was investigated by altering the location of the transition state found by 0.01Å. This was done to see how the path would differ with this slight alteration (fig 1.7) compared to when r1= rts and r2= rts. As we can see the slight deviation affects whether or not the reaction will proceed - moving the position of Hydrogen A by an incremental amount away from the position of transition state reduces the energy of the system so that it no longer has the energy to proceed to the products as shown in fig 1.7.
Reactive and unreactive trajectories
Complete the table by adding a column with the total energy, and another column reporting if the trajectory is reactive or unreactive. For each set of initial conditions, provide a plot of the trajectory and a small description for what happens along the trajectory.
For the initial positions r1 = 0.74 and r2 = 2.0, we alter the momentum to see the effect of momentum on whether a trajectory will be reactive or unreactive.
| P1 | P2 | Surface Plot | Total Energy | Reactivity |
|---|---|---|---|---|
| -1.25 | -2.5 | 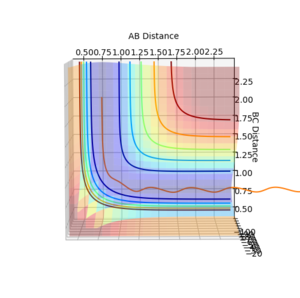 |
-99.018 | Reactive. As atom A approaches the non-vibrating B-C molecule, the trajectory leads towards the A-B products that vibrate. Thus the reaction occurs. |
| -1.5 | -2.0 | 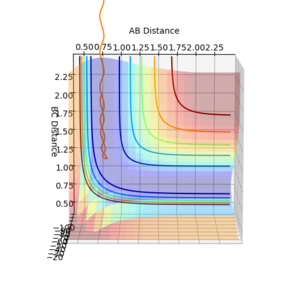 |
-100.456 | Unreactive. As atom A approaches the vibrating B-C molecule, the energy of the system is not sufficient to overcome the activation energy barrier so the reaction does not occur. |
| -1.5 | -2.5 |  |
-98.956 | Reactive. As atom A approaches the B-C molecule, the B-C bond begins to lengthen earlier and the trajectory of the reaction heads towards the products path. Thus the reaction occurs. |
| -2.5 | -5.0 | 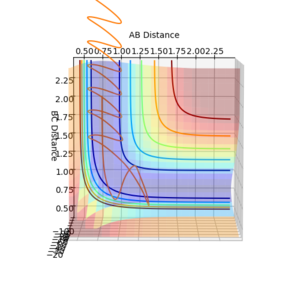 |
-84.956 | Unreactive. As atom A approaches the non-vibrating B-C molecule, B-C begins to vibrate and the A-B-C transition state forms. However there is not sufficient energy in the system to overcome the activation energy into the products. Thus, A moves back away from B-C and the reaction does not occur.
If it passes the TS, then there is sufficient energy. Maybe this is just not the right type of energy. That’s why the system re-crosses the TS. And for all five examples, you mentioned non-vibrating molecule in case1, 4, 5. This is not quite true, even if it doesn’t seem to appear in the trajectories. For example, it could be just because the translational energy is too big that the molecule doesn’t have time to complete the oscillation. Otherwise it is fine--Sw2711 (talk) 17:53, 11 May 2018 (BST) |
| -2.5 | -5.2 | 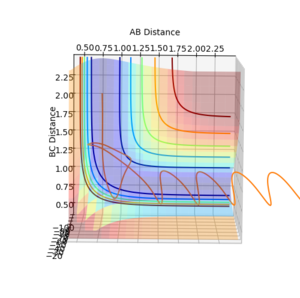 |
-83.416 | Reactive. As atom A approaches the non-vibrating B-C molecule, B-C begins to vibrate and the A-B-C transition state forms. The energy in this case is sufficient to move the transition state into the products, so C dissociates and A-B forms. |
Main Assumptions of Transition State Theory
State what are the main assumptions of Transition State Theory. Given the results you have obtained, how will Transition State Theory predictions for reaction rate values compare with experimental values?
There are 3 main assumptions of transition state theory (2):
1. That the reacting atoms obey the laws of classical mechanics
2. That the system will go through the saddle point on the PES. (This is found along the slice with the lowest energy as discussed above)
3. That the activated complex will be in equilibrium with the reactant molecules and not the products (since at that point the energy barrier has not yet been overcome)
These assumptions are not perfect with experimental results in reality since it wrongly assumes that as long as the reactant molecules form the activated complex, the reaction should follow through into the products. Thus the predicted reaction rates would be higher than experimentally observed.
You are correct for what you have commented. You can also easily refer it back to your tests above. Clearly case 4 has enough energy to overcome the activation energy but it doesn’t form the product. --Sw2711 (talk) 18:12, 11 May 2018 (BST)
Also importantly, the classical treatment of the reactant molecules ignores the quantum mechanical phenomenon of tunnelling. Where a small number of molecules without the sufficient energy to go over the activation energy barrier can actually tunnel through the energy barrier instead.
exercise 2: F-H-H System analysis
PES Inspection
Classify the F + H2 and H + HF reactions according to their energetics (endothermic or exothermic). How does this relate to the bond strength of the chemical species involved?


Due to the strength of the HF bond, the reaction between F + H2 -> H + HF is highly exothermic, with a very low activation energy. I need some evidence from the program. --Sw2711 (talk) 18:17, 11 May 2018 (BST) However the reverse reaction is highly endothermic due to the high energy input required to break the HF bond. The Hammond's postulate (3) dictates that the transition state will either resemble the reactants when exothermic or products when endothermic. Since like in the forward reaction where the activation energy required is very small, very little rearrangement of the starting material is required to reach the transition state.
By this line of reasoning, when F approaches H2, in the very early transition state, the internuclear separation of the two hydrogens should still resemble the H2 diatomic with a separation of 0.74Å. The separation of HF at the transition state can then be estimated using the plot of internuclear separation over time (fig 2.1) and energy time (fig 2.2) plots to see when it remains constant at the TS. A-B separation was adjusted and found to be 1.87Å at the transition state.
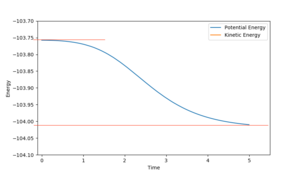
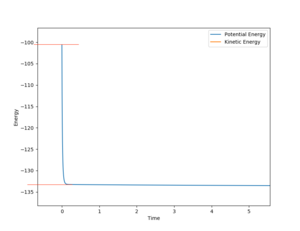
In order to get the avtivation energy of the forward reaction, we keep the position of F-H at the transition state at 1.87Å and shift the position of H-H flightly away, lengthening the bond to 0.743Å.
Reading from the graph (fig 2.3), the activation energy of the forward reaction to form HF + H = 0.26 Kcal/mol
Reversing the conditions and reading from the graph (fig 2.4), the activation energy of the reverse reaction to form H2 + F = 31.5 Kcal/mol
Reaction Dynamics
Mechanism of release of the reaction energy
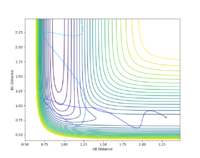


Looking into the forward reaction of F + H2 -> HF + H, we would expect to observe from this exothermic reaction a release of energy into the surroundings though the conversion of potential energy into kinetic energy. The set of reaction conditions for the trajectory chosen (fig 2.5) to illustrate this are as follows in the table below:
| AB Distance | BC Distance | AB Momentum | BC Momentum |
|---|---|---|---|
| 2.3 | 0.8 | -7.0 | -0.8 |
Looking at the energy-time graph (fig 2.6), the kinetic and potential energy fluctuations over the reaction coordinate are perfectly out of phase with each other. This is in agreement with the conservation of energy - indicating that the total energy of the system remains constant. However, the increase in average kinetic energy after the reaction as shown by the increased amplitude of oscillations for kinetic energy supports the argument that energy is converted to kinetic energy in this reaction - resulting in a quantifiable release of energy in this exothermic reaction. This can be experimentally measured via calorimetry.
However, delving deeper into why energy is converted from the potential to kinetic form - observe the internuclear momenta-time graph (fig 2.7). The blue line illustrating the H-F vibrations oscillate much more vigorously than the initial H-H molecule (shown by the orange line). This there is an increase in vibrational energy resulting in the increase of kinetic energy at the cost of potential energy.
Good attempt of explanation here--Sw2711 (talk) 18:26, 11 May 2018 (BST)
Polanyi's emipirical rules (5) [1]
I think you made an attempt to make a proper wiki reference. So I am making an example here. Please check the source code here as well as the source code at the bottom of this wiki page--Sw2711 (talk) 18:34, 11 May 2018 (BST)
Polanyi's empirical rules come up with a general explanation of how different forms of energy affect the rates of reactions. Significant to this Molecular Reaction Dynamics course, the rules more specifically state that vibrational energy is more efficient than translational energy in activating a late barrier transitions - characteristic of endothermic reactions in line with the Hammond's postulate. The reverse being true for early barrier transitions characteristic of exothermic reactions (4).


Using the examples shown in fig 2.8 and fig 2.9, Polanyi's rules are shown to work for the early barrier exothermic reaction of F + H2 -> HF + H. In the first case (fig 2.8) the kinetic energy is effective in overcoming the activation energy barrier while in the second case (fig 2.9) the high vibrational energy (exhibited by the larger amplitude H-H oscillations) is ineffective in overcoming the barrier. For reference, the momentum of H-H in the first case is set at 0.1 and in the second case at 2.5.


Now looking at the reverse reaction of HF + H -> H2 + F, this is an endothermic reaction with a late barrier transition. With reference to fig. 2.10 and fig 2.11 Polanyi's rules are shown to work since the high vibrational energy is effective in overcoming the barrier in the first example (fig 2.10) while the high kinetic energy is ineffective in overcoming the barrier in the second case (fig 2.11). The momentum of H-F in the first case is set at 0.1 and in the second case at 3.0 in these endothermic late barrier examples.
I think this part is good too--Sw2711 (talk) 18:29, 11 May 2018 (BST)
References
(1) Lewars EG. Computational Chemistry Introduction to the Theory and Applications of Molecular and Quantum Mechanics. http://www.giovannibachelet.it/EGL-CC.pdf. Accessed May 4, 2018.
(2) Atkins P, De Paula J. Atkins’ Physical Chemistry. 10th ed.; 2014.
(3) Hammond’s Postulate - Chemistry LibreTexts. https://chem.libretexts.org/Reference/Organic_Chemistry_Glossary/Hammond’s_Postulate. Accessed May 4, 2018.
(4) Zhang Z, Zhou Y, Zhang DH, Czakó G, Bowman JM. Theoretical Study of the Validity of the Polanyi Rules for the Late-Barrier Cl + CHD 3 Reaction. J Phys Chem Lett. 2012;3(23):3416-3419. doi:10.1021/jz301649w.
(5) Polanyi JC. SOME CONCEPTS IN REACTION DYNAMICS. 1986. https://www.nobelprize.org/nobel_prizes/chemistry/laureates/1986/polanyi-lecture.pdf. Accessed May 4, 2018.
