MRD:01508610
EXERCISE 1: H + H2 system
Coordinates
We will be looking at collision and reaction between diatomic molecule of hydrogen and an atom of H in a linear configuration in the gas phase. In simple terms, the atom A collides with the molecule B-C and forms a new molecule with B, while C is detached as a separate atom. The interatomic distances between A and B, B and C are labelled as rAB and rBC respectively. Nice! I like these diagrams you have drawn. Mak214 (talk) 18:25, 29 May 2020 (BST)
Dynamics from the transition state region
On a potential energy surface diagram, how is the transition state mathematically defined? How can the transition state be identified, and how can it be distinguished from a local minimum of the potential energy surface?
• The molecular geometry and chemical reaction dynamics are analysed with a potential energy surface (PES) where the necessary points can be evaluated and classified according to first and second derivatives of the energy with respect to position, V(r), which respectively are the gradient and the curvature. Stationary points are those with zero gradient (∂V(ri)/∂ri=0) and have physical meaning: energy minima (or local minima of the PES) correspond to physically stable chemical species (such as reactant and product) and saddle points representing transition states, the maximum on the lowest energy pathway (or minimum energy path) that linking reactant and product.
• Mathematically, a saddle point is a point on the surface of a function where the slopes in orthogonal directions are all zero, but which is not a local extremum of the function. The transition state is a first-order saddle point. In this H + H2 system, the surface is symmetrical, which means that the transition state must be exactly half way between the reactants and products. In another words, the transition state lies somewhere on the diagonal line where the distances rAB and rBC are equal.
• The hydrogen atoms will have no movement at the saddle point since the force on atoms (i.e. the negative derivative of PES with respect to the coordinate ri where the force acting on) will be zero at transition state. Consequently, if one starts a trajectory exactly at the transition state, with no initial momentum, it will remain there forever. Therefore, the method to identify the transition state position from a PES is to change the values of rAB and rBC until the forces along AB and BC are both zero. In fact, forces are negative on one side of the PES and positive one the other side. The transition state is located where forces across zero. Great. Thank you. Mak214 (talk) 18:25, 29 May 2020 (BST)
Trajectories from rAB = rBC: locating the transition state
Report your best estimate of the transition state position (rts) and explain your reasoning illustrating it with a “Internuclear Distances vs Time” plot for a relevant trajectory.
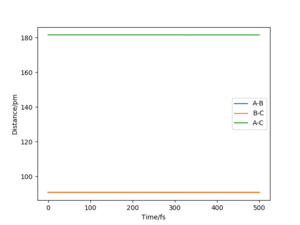
• By testing different initial conditions with rAB = rBC, and p1 = p2 = 0.0 g.mol-1.pm.fs-1, the transition state position (rts) is found to be the point where distances rAB and rBC are equal to 90.78 pm. At that position, forces are both -0.001 KJ.mol-1.pm-1 (close to zero).
• Since the H + H2 surface is symmetrical, the transition state must have rAB = rBC. If we start a trajectory on the ridge rAB = rBC there is no gradient in the direction at right angles to the ridge, thus the trajectory will oscillate on the ridge and never fall off.
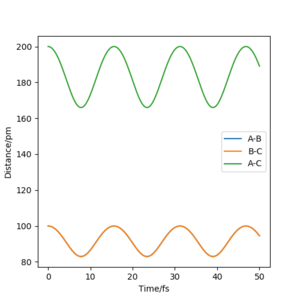
• To verify the transition state position, “Internuclear Distances vs Time” plots for some relevant rAB = rBC trajectories are shown below. In these graphical display the values of rAB(t), rBC(t) and rAC(t) are given (Y axis) against time t (X axis). At transition state, distance rAB and rBC (and thus rAC) are constant since all three atoms are stationary at the saddle point. The potential energy is maximized while the kinetic energy is zero. This geometry is transition structure.
• In contrast, when initial conditions increased to rAB = rBC =100 pm, it shows an oscillatory behaviour for the whole trajectory corresponding to the vibration of atom A and atom C, since there are both potential and kinetic energy. The distance rAB and rBC are overlapped, since they have the same amplitude of vibration and the vibrations are symmetrical around atom B. The distance rAC) has doubled the amplitude of vibration (i.e. the sum or superposition of the amplitude). The oscillatory behaviour is changed after the transition state, at t≈270 fs, to a dissociation pattern where rAB (and thus rAC) keeps increasing with a slight oscillatory behaviour while rBC remained at the same level with a higher vibrational frequency. This means that the atom A leaves away from the molecule B-C with the translational energy while molecule B-C is left with vibrational energy, which resembles the reactant. Well done. A clear response. Good use of these figures to show what you did. Mak214 (talk) 18:26, 29 May 2020 (BST)
Trajectories from rBC = rts+δ, rAB = rts
Comment on how the mep and the trajectory you just calculated differ.
The reaction path (minimum energy path or mep) is calculated with these initial conditions involving: • rBC = rts+1 pm = 91.78 pm; • rAB = rts = 90.78 pm; • pBC = pAB = 0 g.mol-1.pm.fs-1; • then change the calculation type from dynamics to MEP; • increase the number/size of steps to 5000/0.1(fs).
Then repeat the calculation with the same initial conditions used to calculate the reaction path, but change the calculation type back to Dynamics.
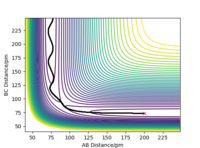
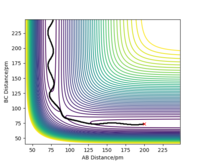
The calculated trajectories are shown in contour plots below, which both start from the transition state and simply follows the valley floor to HC + HA-HB. The mep is a smooth curve with no oscillatory behaviour, while the dynamic trajectory is an oscillatory curve.
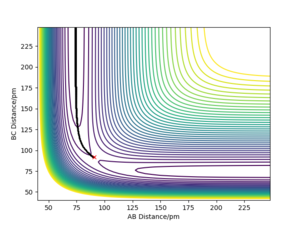
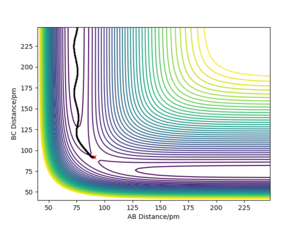
The mep has the property that any point on the path is at an energy minimum in all directions perpendicular to the path. The mep can also be described as the union of steepest descent paths from the saddle points to the minima (that is why the mep passes through at least one first-order saddle point.) Reference is needed here. We reset the momenta to zero at every timestep for the MEP calculation which means the system will always fall into the nearest minimum - If you started on a saddle point and had no momentum you shouldn't go anywhere! Mak214 (talk) 18:31, 29 May 2020 (BST)
From the “Internuclear Distances vs Time” diagrams below, it shows a constant increasing rate of rBC (and thus rAC) after the transition state in Dynamic trajectory, whereas it shows a reducing rate of the increase of the rBC (and thus rAC) in the mep. In addition, the molecule A-B has slight vibrational (or oscillatory) behaviour but has no vibration in the mep.


As mentioned before, the variation of momentum p (the forces acting on a given interatomic coordinate ri) will depend on the derivative of the potential energy surface with respect to that coordinate. Simply, the momenta over time, p(t), is the gradient of V(r).

Reference for this equation? Mak214 (talk) 18:31, 29 May 2020 (BST)
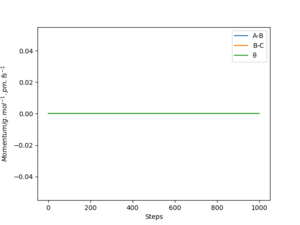
From the “Momenta vs Time” diagrams below, the momenta of all atoms are zero in the mep since the momenta/velocities are always reset to zero in each time step when calculating the mep. while it have various values in Dynamic trajectory: the momentum of A-B decreases to slightly negative values and then rises to ≈2.5 g.mol-1.pm.fs-1 and keeps oscillating; whereas the momentum of B-C, similarly, decreases to negative values and then increases dramatically to and remains at ≈5 g.mol-1.pm.fs-1.
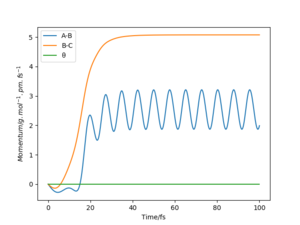
If we change the initial conditions to: • rBC = rts = 90.78 pm; • rAB = rts + 1 pm = 91.78 pm. The “Internuclear Distances vs Time” and “Momenta vs Time” plots will look like this:


The “Internuclear Distances vs Time”and “Momenta vs Time” plots of both the mep and Dynamic trajectory have exactly the same pattern as those plots before the initial conditions are changed, except that line A-B (representing rAB) and line B-C (representing rBC) are interconverted. This means that the reaction proceeds in the same way but opposite direction (towards the valley floor to HA + HB-HC).

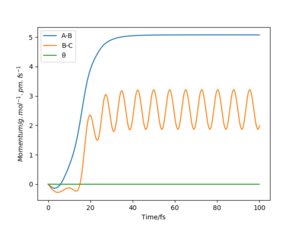
Take note of the final values of the positions r1(t) r2(t) and p1(t) p2(t) for your trajectory for large enough t.
• step number = 5000
• step size = 0.1 fs
• rBC = 74.77117297476231 pm
• rAB = 3777.013307800053 pm
• pBC = 1.9461593911826354 g.mol-1.pm.fs-1
• pAB = 5.073830709923566 g.mol-1.pm.fs-1
The atom A is extremely far from the molecule B-C and keeps moving away. The energies are: • kinetic energy = +19.657 KJ.mol-1
• potential energy = -434.999 KJ.mol-1
• total energy = -415.342 KJ.mol-1
Setup a calculation where the initial positions correspond to the final positions of the trajectory you calculated above, the same final momenta values but with their signs reversed. What do you observe?
The energy terms are the same as above, but in this case, the reverse sign of momenta results in the reserve of the moving direction of the free atom (atom A in this case). The atom A is very far from the molecule B-C and it keeps approaching the molecule B-C.
Reactive and unreactive trajectories
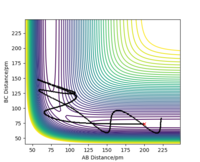
For the initial positions rBC = 74 pm and rAB = 200 pm, run trajectories with the following momenta combination and complete the table. Complete the table below by adding the total energy, whether the trajectory is reactive or unreactive, and provide a plot of the trajectory and a small description for what happens along the trajectory. What can you conclude from the table?
From this table, you can observe that some trajectories have a total energy greater than the activation energy and still do not react. Therefore, for the reaction to proceed, there are two conditions should be met:(1) the total energy is lager than the activation energy; (2)the interaction between atoms should be appropriate for the collision to happen with correct energy and direction. For instance, if the approaching atom A move opposite to the molecule B-C, there will be no collision and the reaction will definitely not occur. OK. Mak214 (talk) 18:31, 29 May 2020 (BST)
- (The transition state is found to be at rAB= 230.0 pm; rBC=74.0 pm; forces along AB and AC = +0.015 and +0.012 respectively; KE = 0; PE = total E = -434.471.)
Transition State Theory
Given the results you have obtained, how will Transition State Theory predictions for reaction rate values compare with experimental values?
Transition state theory (TST) explains the reaction rates of elementary chemical reactions. The theory assumes a special type of chemical equilibrium (quasi-equilibrium) between reactants and activated transition state complexes. These are three properties of TST:
1.Rates of reaction can be studied by examining activated complexes near the saddle point of a potential energy surface. The details of how these complexes are formed are not important. The saddle point itself is called the transition state.
2.The activated complexes are in a special equilibrium (quasi-equilibrium) with the reactant molecules.
3.The activated complexes can convert into products, and kinetic theory can be used to calculate the rate of this conversion.
TST is used primarily to understand qualitatively how chemical reactions take place. Simply, the Transition State Theory (TST) tells whether a reaction will happen if cross the TS barrier.
So the difference here is that our program is working with a single molecule, the TST deals with a bulk system with a Boltzmann speed distribution. The main differences between experimental and predicted rate constant values will be due to (1) ignoring barrier recrossing and (2) ignoring QM behaviour. What will the effect of these phenomena be on the real rate of reaction relative to one predicted by TST?? More discussion is needed here. And references please! Mak214 (talk) 18:52, 29 May 2020 (BST)
EXERCISE 2: F - H - H system
F + H2 --> HF + H
A F atom (A) approaches a hydrogen molecule (B-C) to forms a new HF molecule (A-B) and a separate H atom (C).
PES inspection
By inspecting the potential energy surfaces, classify the F + H2 and H + HF reactions according to their energetics (endothermic or exothermic). How does this relate to the bond strength of the chemical species involved?
Locate the approximate position of the transition state.
In order to classify the reaction based on energies, the total energies of reactant and that of product should be identified first by using mep calculation (in order to exclude kinetic energy) starting with a small displacement from the TS and with a high enough number of steps. It will go towards the formation of either the products or the reactants and the potential energy will tend to a constant value which is the total energy of the product/reactants depending which direction the displacement was.
The total energies of reactant and that of product are calculated to be:
• reactant: E(H2) = -435.099 KJ.mol-1;
• product: E(HF) = -560.402 KJ.mol-1.
Since the energy of the product is lower than that of reactant, this is an exothermic reaction. This makes sense with the concept of bond strength in which the H-F bond (565 KJ.mol-1) is much stronger than H-H bond (432 KJ.mol-1) and thus there will be more energy released during the formation of H-F bond.
The transition state is still a maximum or a saddle point on the PES, and found to be at:
• rAB = rH-F = 182 pm;
• rBC = rH-H = 74.2 pm;
• pAB = pBC = 0 g.mol-1.pm.fs-1;
• force along AB = +0.003 ≈0 KJ.mol-1.pm-1;
• forces along BC = +0.089 ≈0 KJ.mol-1.pm-1;
• the total energy = -433.969 KJ.mol-1.
Good. Well done. Mak214 (talk) 18:54, 29 May 2020 (BST)
Because the activation energy for one of the reactions is so small, it is not easy to locate the transition state immediately. Use the Hammond postulate to guide your search.
Report the activation energy for both reactions.
The activation energy of the forward reaction is so small (1.13 KJ.mol-1), the Hammond postulate is introduced. Hammond postulate is a hypothesis which states that the transition state of a reaction resembles either the reactants or the products, to whichever it is closer in energy. In an exothermic reaction, the TS is closer to the reactants than to the products in energy. Therefore, the TS resembles the reactant in the reaction. In an exothermic reaction, the TS is closer to the products than to the reactants in energy and therefore, the TS resembles the products.
In F-H-H system, the activation energy is very similar to the energy of the reactant and hence the TS resembles reactant in this case. Therefore, this reaction (F + H2 --> HF + H) is exothermic in forward direction and thus endothermic in backward direction.
In order to classify the reaction based on energies, the total energies of reactant and that of product should be identified first by using mep calculation (in order to exclude kinetic energy) starting with a small displacement from the TS and with a high enough number of steps. It will go towards the formation of either the products or the reactants and the potential energy will tend to a constant value which is the total energy of the product/reactants depending which direction the displacement was.
• mep calculation: number of steps = 5000
Since the transition state is found to be at rAB = rH-F = 182 pm and rBC = rH-H = 74.2 pm, we either change rAB or rBC to achieve the formation of either reactants or products. Here is an example:
The reaction reacts towards the products when initial conditions are:
• rAB = rH-F = 165 pm;
• rBC = rH-H = 74.2 pm;
The "contour plot" indicating the reaction direction clearly and "Energy vs time" diagram which shows a decrease (lower in energy) of potential energy (and also the total energy) from -434.194 to -560.402 KJ.mol-1 are illustrated below.


Based on this mep calculation, the total energies of reactant and that of product are calculated to be:
• reactant: E(H2) = -435.099 KJ.mol-1;
• product: E(HF) = -560.402 KJ.mol-1.
Consequentially, since the TS energy = -433.969 KJ.mol-1, the forward reaction (F + H2 --> HF + H) has an activation energy of [-433.969-(-435.099)]=1.13 KJ.mol-1; the backward reaction (HF + H --> F + H2)has an activation energy of [-433.969-(-560.402)]=126.433 KJ.mol-1. The latter is much larger than the former. Very good. Mak214 (talk) 18:54, 29 May 2020 (BST)
Reaction dynamics
Identify a set of initial conditions that results in a reactive trajectory for the F + H2, and look at the “Animation” and “Momenta vs Time”
In light of the fact that energy is conserved, discuss the mechanism of release of the reaction energy. Explain how this could be confirmed experimentally.
For example, when initial conditions fulfil rAB = 160 pm and 0 < rBC < 76 pm, the trajectory are reactive.
The released energy is concerted thermally into electromagnetic radiations (photons). The relaxed potential energy well of electrons have photon absorption and emission between ground state E(0) and the first excited state E(1) and most of the electrons are populated in ground state. While the excited potential energy well involves more possible higher excited states, such as E(0) to the second excited state E(2), E(1) to E(2) which is called overtone. The overtone will contribute to a second absorbance peak at lower wavenumbers in IR spectra. Most importantly we want to distinguish between vibrational and translational energy. Mak214 (talk) 18:59, 29 May 2020 (BST)
The emission of photons can be detected by a special type of IR called a Quantum Well Infrared Photodetector (QWIP) which is an infrared photodetector.
Setup a calculation starting on the side of the reactants of F + H2, at the bottom of the well rHH = 74 pm, with a momentum pFH = -1.0 g.mol-1.pm.fs-1, and explore several values of pHH in the range -6.1 to 6.1 g.mol-1.pm.fs-1 (explore values also close to these limits). What do you observe? Note that we are putting a significant amount of energy (much more than the activation energy) into the system on the H - H vibration.
Setting initial conditions as: • rHH = 74 pm; • rFH = 180 pm; • pFH = -1.0 g.mol-1.pm.fs-1;
The value of pHH is varied from -6.1 to +6.1 and the resulting "Internuclear Distance.vs.Time" diagams used to show the trajectories are displayed below:
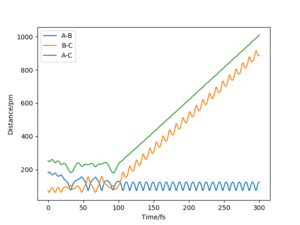
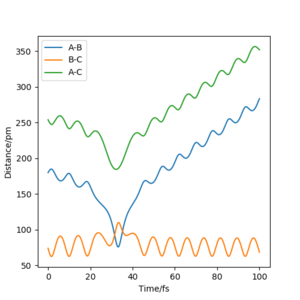
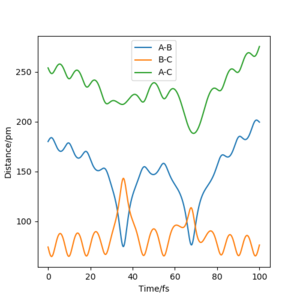
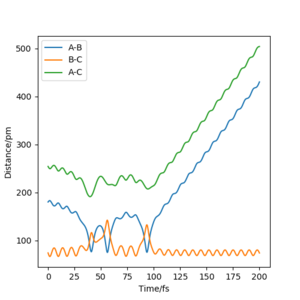
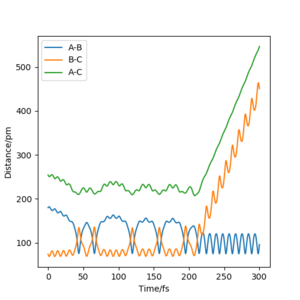
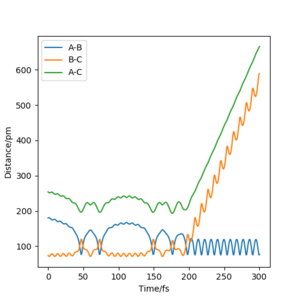

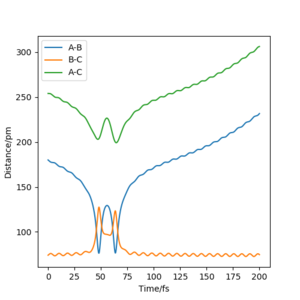
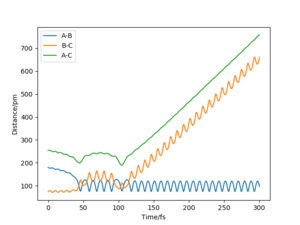
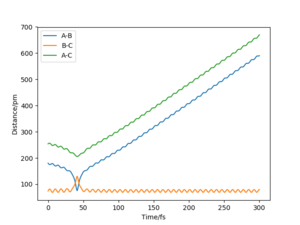
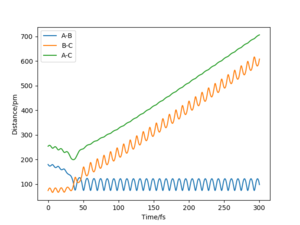
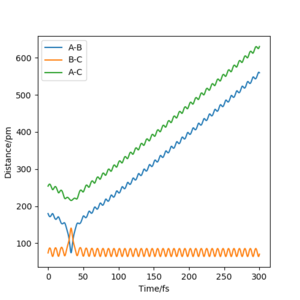
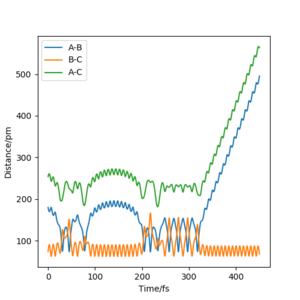

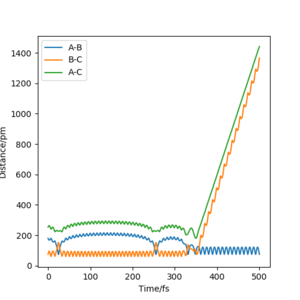
In general, the excess of energy put into the system gives rise to the significant increase in the vibrational energy of H-H. when pHH is negative, the smaller the value (more positive) the more barrier recrossing. When pHH is positive, in most cases there is one barrier recrossing only except when p=+1,+5,+6.1. Even though some barrier recrossing occurs (F atom collides with H atom for several times), it doesn't necessarily mean that the reaction will proceed to form the product HF and a separated atom H.
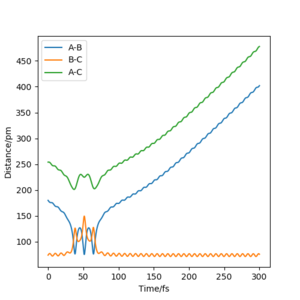
For the same initial position, increase slightly the momentum pFH = -1.6 g.mol-1.pm.fs-1, and considerably reduce the overall energy of the system by reducing the momentum pHH = 0.2 g.mol-1.pm.fs-1. What do you observe now?
The new trajectory is showm in the "Internuclear Distance.vs.Time" diagams below. The vibrating molecule H-H moves towards F and collides with it, making the atom B (H atom) bouncing in-between for three times and then return back to the other H atom to reform the vibrating hydrogen molecule.
Let us now focus on the reverse reaction, H + HF.
The cases studied are an illustration of Polanyi's empirical rules. Discuss how the distribution of energy between different modes (translation and vibration) affect the efficiency of the reaction, and how this is influenced by the position of the transition state.
As mentioned before, the relaxed potential energy well of electrons have photon absorptions and emissions between ground state E(0) and the first excited state E(1) and most of the electrons are populated in ground state. While the excited potential energy well involves more possible higher excited states, such as E(0) to the second excited state E(2), E(1) to E(2) which is called overtone. The overtone will contribute to a second absorbance peak at lower wavenumbers in IR spectra. Each energy state correspond to a translational energy while the vibrational levels are smaller in energy difference and located around translational energy states.
Polanyi's empirical rules states that vibrational energy is more efficient in prompting a late-barrier reaction (that is, a transition state resembling the products) than translational energy, whereas the reverse is true for an early barrier reaction. This sentence is a direct quote from an external source, it should therefore be between quotation marks and clearly referenced, otherwise you are committing plagiarism. You also did the same thing, quoting without referencing, with a sentence from the lab script earlier in the report. Please be very careful with this. João (talk) 15:25, 4 June 2020 (BST)
Translational energy is better at promoting exothermic reactions, because the trajectory can just fall into the lower energy region. Vibrational motion might make it harder for the trajectory to cross the barrier because it is in a different direction than the mep. If the reactants have vibrational motion, then they will try to move up the valley near the transition state, and just fall back to the reactants state. OK. Mak214 (talk) 18:59, 29 May 2020 (BST)
Good report - see a couple of comments. You need to be in the habit of referencing literature throughout your work to back up your discussion. Mak214 (talk) 18:59, 29 May 2020 (BST)


