MO hyc116
BH3
standard information
Calculation type: Optimisation
Calculation Method: B3LYP
Basis set: 6-31G(d,p)
Summary table
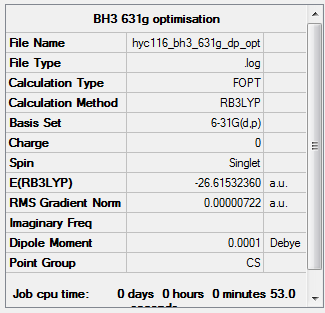
The above summary table was obtained after the 2nd optimisation of BH3 (after the initial optimisation using the 3-21G basis set). Notice how the symmetry is incorrect and shown as Cs. This is because the symmetry was manually broken at the beginning by changing the bond length of B-H bonds. The point group was manually adjusted and the molecule was optimised again before the frequency analysis and the new summary table is attached below.
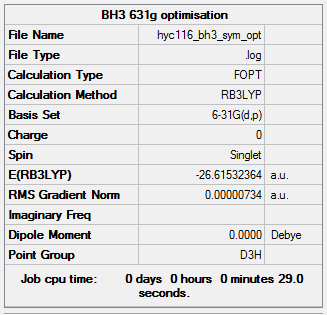
The above summary table was obtained from the optimisation after adjusting the symmetry. The point shown in this summary table is D3h, which is the correct for BH3.
Items table
Below is the items table taken from the optimisation with the correct point group.
Item               Value     Threshold  Converged?
 Maximum Force            0.000015     0.000450     YES
 RMS     Force            0.000010     0.000300     YES
 Maximum Displacement     0.000058     0.001800     YES
 RMS     Displacement     0.000038     0.001200     YES
Frequency log file
Frequencies
Low frequencies ---  -10.3498   -3.4492   -1.2454   -0.0055    0.4779    3.2165
Low frequencies --- 1162.9519 1213.1527 1213.1554
jmol of BH3
optimised BH3 |
Vibrational spectrum
| wavenumber (cm-1) | Intensity (arbitrary units) | symmetry | IR active? | type |
|---|---|---|---|---|
| 1163 | 93 | A2' ' | Yes | Out of plane bend |
| 1213 | 14 | E' | Very slight | Bend |
| 1213 | 14 | E' | Very slight | Bend |
| 2582 | 0 | A1' | No | Symmetric stretch |
| 2716 | 126 | E' | Yes | Asymmetric stretch |
| 2716 | 126 | E' | Yes | Asymmetric stretch |
IR spectrum
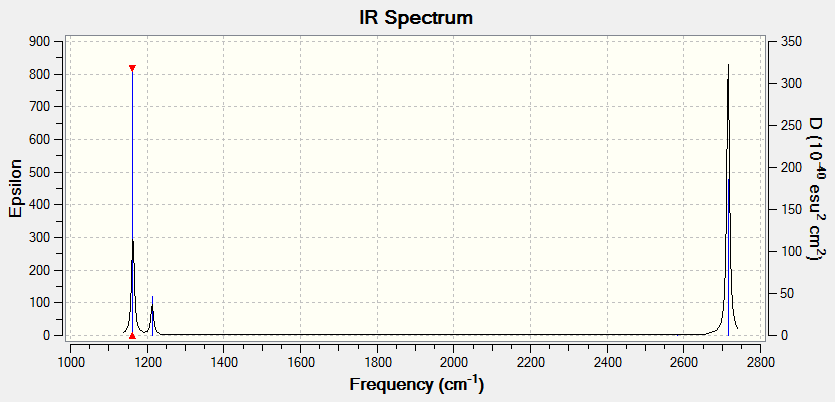
There are only three peaks on the IR spectrum of BH3, despite that there are 6 vibrational modes for the molecule. As shown in the table above, the symmetric stretching mode with A1 symmetry at 2582 cm-1 is not IR active; naturally, that vibrational mode doesn’t give a peak on the IR spectrum. As shown from the table, two pairs of vibrational modes, the bond angle deformation/bend at 1213 cm-1 and the asymmetric bond stretch at 2716 cm-1, are degenerate with the symmetry label E. This means that they have the same energy, and hence give the same wavenumber on the IR spectrum. Each pair of degenerate vibrational modes give rise to one peak. This leaves three peaks, as confirmed by the IR spectrum above.
Molecular orbitals of BH3
The above molecular orbital diagram was taken from Dr Patricia Hunt's Lecture 4 Tutorial Problem Model Answers.[1] Diagrams of the "real" MOs were obtained from Gaussian.
There is no significant difference between the LCAO MOs and the real ones. Features such as orbital phases are shown clearly on both the LCAO MOs and the real MOs, illustrating the bonding/anti-bonding characters of the molecular orbitals. This suggests that the the qualitative MO theory is highly accurate and useful when studying the molecular orbitals of molecules.
Ng611 (talk) 12:59, 5 June 2018 (BST) You're absolutely right to say that there are no significant differences between qualitative MO theory and the calculated MOs. However, there are subtle differences that should be highlighted. Otherwise, a very well done MO analysis.
Associated energies: ammonium borane
NH3
Calculation type: Optimisation
Calculation Method: B3LYP
Basis set: 6-31G(d,p)
Summary table
Items table
Item               Value     Threshold  Converged?
 Maximum Force            0.000006     0.000450     YES
 RMS     Force            0.000004     0.000300     YES
 Maximum Displacement     0.000012     0.001800     YES
 RMS     Displacement     0.000008     0.001200     YES
Frequency log file
Frequencies
Low frequencies ---   -8.5646   -8.5588   -0.0047    0.0454    0.1784   26.4183
Low frequencies --- 1089.7603 1694.1865 1694.1865
jmol of NH3
optimised NH3 |
NH3BH3
Calculation type: Optimisation
Calculation Method: B3LYP
Basis set: 6-31G(d,p)
Summary table
Items table
Item               Value     Threshold  Converged?
 Maximum Force            0.000121     0.000450     YES
 RMS     Force            0.000057     0.000300     YES
 Maximum Displacement     0.000501     0.001800     YES
 RMS     Displacement     0.000293     0.001200     YES
Frequency log file
Frequencies
Low frequencies ---   -0.0574   -0.0501   -0.0074   21.6276   21.6377   40.3839
Low frequencies ---  265.9973  632.3725  640.1275
jmol of NH3BH3
optimised NH3BH3 |
Association energy
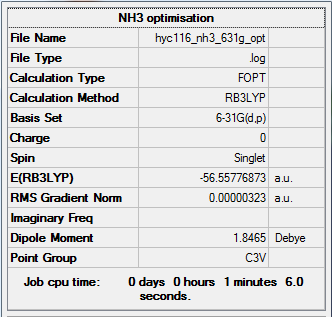
E(BH3) (using the optimisation with the correct symmetry) = -26.61532363 a.u. = -26.61532 a.u. (5 d.p.)
E(NH3) = -56.55776873 a.u. = -56.55777 a.u. (5 d.p.)
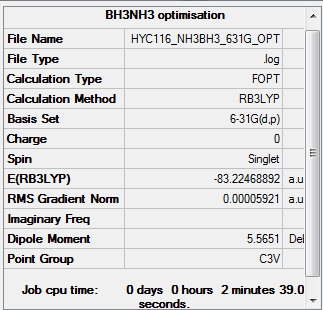
E(NH3BH3) = -83.22468892 a.u. = -83.22469 a.u. (5 d.p.)
Carrying out calculations using numbers which has already been rounded up can possibly result in errors in the last digit. Hence, here the calculations were carried out using the numbers provided from the optimisations (i.e. with more decimal places than necessary); the answer was then rounded up to the desired accuracy.
ΔE = E(NH3BH3)-[E(NH3)+E(BH3)]
ΔE = -83.22468892 - (-56.55776873 + -26.61532363) = -0.05159656 a.u.
ΔE = -0.05160 a.u. (5 d.p.)
Converting energy from a.u. to kJ/mol
An atomic unit for energy is Hartree, which is equal to 2625.5 kJ/mol.
[2]
So ΔE in kJ/mol = -0.05159657 * 2625.5 = -135.46676828 kJ/mol
ΔE = -135 kJ/mol (nearest integer)
The energy difference calculated above comes from the formation of the B-N dative bond. It is a relatively weak bond. According to a bond energy data sheet provided by the University of California,[3] the bond energy of the C-C bond of an ethane molecule is 368 kJ/mol. This is a fair comparison to the NH3BH3 molecule as the two molecules have the same structure, only with the carbon atoms on ethane swapped for Boron and Nitrogen in NH3BH3
Ng611 (talk) 13:01, 5 June 2018 (BST) Correct calcualtion and good consideration given to the accuracy of the reported result. Try to use peer-reviewed paper sources where possible though.
Using a mixture of basis-sets and pseudo-potentials
BBr3
Calculation type: Optimisation
Calculation Method: B3LYP
Basis set: Boron: 6-31G(d,p) ; Br: LANL2DZ
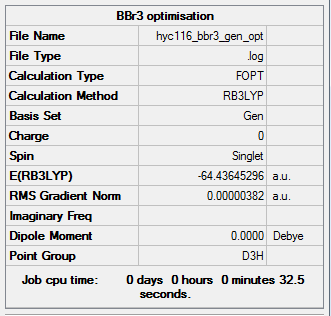
Larger calculations are often sent to a web-server to run on a high-performance computer instead of a desktop. In order to experience and learn to use a web-server, the optimisation and the frequency analysis for BBr3 were both sent and done on a server instead of the desktop. The calculation results were downloaded from the web-server once they were finished.
Summary table
Items table
Item               Value     Threshold  Converged?
 Maximum Force            0.000008     0.000450     YES
 RMS     Force            0.000005     0.000300     YES
 Maximum Displacement     0.000036     0.001800     YES
 RMS     Displacement     0.000023     0.001200     YES
Frequency log file
Attached above is the frequency file saved onto the computer from the SCAN server portal. The frequency file was also published on the chemistry database DSpace. DOI:10042/202442
Frequencies
Low frequencies ---   -0.0137   -0.0064   -0.0046    2.4315    2.4315    4.8421
Low frequencies ---  155.9631  155.9651  267.7052
jmol of BBr3
optimised BBr3 |
Mini project: Aromaticity
Benzene
Calculation type: Optimisation
Calculation Method: B3LYP
Basis set: 6-31G(d,p)
Summary table
Items table
Item               Value     Threshold  Converged?
 Maximum Force            0.000193     0.000450     YES
 RMS     Force            0.000079     0.000300     YES
 Maximum Displacement     0.000830     0.001800     YES
 RMS     Displacement     0.000294     0.001200     YES
Frequency log file
Frequencies
Low frequencies ---   -3.5606   -3.5606   -0.0089   -0.0043   -0.0043   10.0905
Low frequencies ---  413.9582  413.9582  621.1416
jmol of C6H6
optimised Benzene |
Borazine
Calculation type: Optimisation
Calculation Method: B3LYP
Basis set: 6-31G(d,p)
Summary table
Items table
Item               Value     Threshold  Converged?
 Maximum Force            0.000085     0.000450     YES
 RMS     Force            0.000033     0.000300     YES
 Maximum Displacement     0.000250     0.001800     YES
 RMS     Displacement     0.000074     0.001200     YES
Frequency log file
Media:HYC116_BORAZINE_FREQ.LOG
Frequencies
Low frequencies ---  -12.6626  -12.6626   -8.9272   -0.0211   -0.0104   -0.0104
Low frequencies ---  289.1112  289.1112  403.8613
jmol of Borazine
optimised Borazine |
Charge distribution
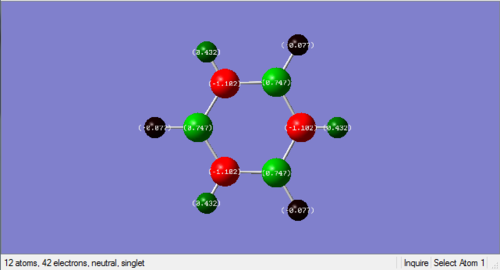
An NBO charge analysis was carried out on both the optimised benzene and borazine. Visualisations of the charge distribution are shown in the table below, with the colour range going from -1.102 to 1.102 for both molecule. This large scale was chosen as it allows direct comparison of the charge on any atoms in these two molecules and shows the relative magnitude of charges on all these atoms. Negative charges are shown in red, and positive charges are shown in green. A neutral charge is displayed in black, so the smaller a charge is (positive or negative), the darker its colour representation is. Larger charges are shown in brighter colours. The charges are also displayed on the atoms as numbers with a neutral charge being zero. Negative charges are shown as negative number and positive charges are shown as positive numbers.
| Benzene | Borazine | |
|---|---|---|
| Visualisation of charge distribution |  |
 |
| Charge | Carbon: -0.239
Hydrogen: 0.239 |
Nitrogen: -1.102
Boron: 0.747 Hydrogen (bonded to N): 0.432 Hydrogen (bonded to B): -0.077 |
| Discussion | From the visualisation, it is shown that there is a slightly negative charge on the carbon atoms, and a positive charge of the same magnitude on the hydrogen atoms. All the carbon atoms have the same charge as they are in identical environments. The same applies to all the hydrogen atoms. This is due to the highly symmetrical structure of benzene. Since the same colour scale was used for both benzene and borazine, and the charges are much smaller in magnitude on atoms in benzene than atoms on borazine, the colours on the charge distribution visualisation is much darker. | Polar bonds between nitrogen and boron are demonstration from the above visualisation. From the colours displayed on the charge distribution visualisation as well as the charge values, it is shown that nitrogen has a relatively large negative charge, while boron has a positive charge. This is due to the difference in electrogenativity between these atoms: nitrogen atoms are more electronegative than boron and tends to attract electrons towards themselves. It is worth noting that the hydrogen atoms do not all have the same charge. The hydrogen atoms bonded to boron have a slightly negative charge, and the ones bonded to nitrogen have a small positive charge.
The fact that the same colour scale was used for both molecules comes in helpful here. It allows the charges on atoms to be compared directly. For example, just from looking at the colours, one can tell that or example, even though both carbon and nitrogen are electronegative, nitrogen is much more electronegative, which is quantitatively shown by Pauling's electronegativity scale.[4] |
Ng611 (talk) 13:04, 5 June 2018 (BST) Good discussion of the effects of electronegativity on the overall charge distribution. Some other points to consider (though by no means an exhaustive list): What do the partial charges sum to, and is there any difference in partial charge for atoms related by symmetry? You briefly discuss symmetry with regards to benzene, but it's also important in Borazine.
Comparative MOs of Benzene and Borazine
Ng611 (talk) 13:08, 5 June 2018 (BST) A good comparison of MOs. I like the fact that you've assigned symmetry labels here -- you should also provide the overall character of the orbital (sigma, pi, etc) and discuss the constituent AOs that make up the MO (LCAO diagrams would be useful here) to strengthen this section further still.
Aromaticity: discussion
Aromatic compounds display properties such as their high stability and bond lengths between typical single and double bonds. A simple understanding of aromaticity involves the overlap of p orbitals perpendicular to the cyclic plane; the delocalisation of electrons on the pi system is identified to be responsible of the stability of aromatic systems. Aromatic compounds can be identified by the Huckel’s rule, which states that conjugated planar cyclic molecules with (4n +2) π electrons are aromatic. Both benzene and borazine obey the Huckel’s rule and fit the conventional description of aromaticity. [5]
However, it is proved in recent years that the conventional criteria do not necessarily have to be obeyed for a compound to be aromatic. For instance, it has been shown that some non-planar compounds, for example, meta- and para- cyclophanes, display aromaticity. This suggests that the criteria for aromaticity is not simply structural, and these advances give rise to concepts such as quasiaromaticity and pseudoaromaticity. Recent advances show that there are quantum mechanics basis on the idea of aromaticity.[6]
Ng611 (talk) 13:13, 5 June 2018 (BST) This is a promising paragraph, but a great deal more detail is needed. You mention that "there are quantum mechanics basis on the idea of aromaticity.", but you should discuss this in more detail. Specifically, what is the "quantum mechanical basis"? Perhaps also some more discussion on experimental findings would strengthen this section further.
In conclusion, while the overlap of pi orbitals provides a simple understanding for aromaticity, it is not a sufficient description for aromaticity. There is also sigma orbital and quantum mechanics contribution to aromaticity.
Ng611 (talk) 13:13, 5 June 2018 (BST) A very good piece of work. Try your best to add detail and exposition to your discussions to demonstrate your understanding of the material. Otherwise, very well done!
References
- ↑ P. Hunt, "Lecture 4 Tutorial Problem Model Answers", 2 (2018)
- ↑ https://cccbdb.nist.gov/hartree.asp (Accessed: 22.05.2018)
- ↑ https://labs.chem.ucsb.edu/zakarian/armen/11---bonddissociationenergy.pdf (Accessed: 24.05.2018)
- ↑ http://www.tutor-homework.com/Chemistry_Help/electronegativity_table/electronegativity.html (Accessed: 24.05.2018)
- ↑ Clayden, J., Greeves, N. & Warren, S. G. Organic chemistry. (Oxford University Press, 2012)
- ↑ Palusiak, M. & Krygowski, T. M. Application of AIM Parameters at Ring Critical Points for Estimation of π-Electron Delocalization in Six-Membered Aromatic and Quasi-Aromatic Rings. Chemistry - A European Journal 13, 7996–8006 (2007).

