MO:JGH116
Borane: BH3
Key Data
The following calculation was performed using a B3LYP/6-31G(d,p) basis set:
Item Table
        Item               Value     Threshold  Converged?
 Maximum Force            0.000158     0.000450     YES
 RMS     Force            0.000079     0.000300     YES
 Maximum Displacement     0.000622     0.001800     YES
 RMS     Displacement     0.000311     0.001200     YES
The file for this calculation is here.
Frequencies
Low frequencies ---   -0.2456   -0.1129   -0.0054   44.0270   45.1846   45.1853
Low frequencies --- 1163.6049 1213.5924 1213.5951
Borane: BH3 |
Vibrations for BH3
For any non-linear molecule, there are 3N-6 vibrational modes, where N is the number of atoms in the molecule. Here, BH3 has 4 atoms, and so we predict there to be 6 vibrational modes. These were calculated and are tabulated below:
| Wavenumber (cm-1) | Intensity (arbitrary units) | Symmetry | IR Active? | Type |
|---|---|---|---|---|
| 1163.60 | 92.48 | A2 | Yes | Bend (Out of plane) |
| 1213.59 | 14.08 | E' | Yes | Bend |
| 1213.60 | 14.08 | E' | Yes | Bend |
| 2580.15 | 0 | A1' | No | Symmetric Stretch |
| 2713.12 | 126.40 | E' | Yes | Asymmetric Stretch |
| 2713.12 | 126.39 | E' | Yes | Asymmetric Stretch |
The predicted IR spectrum is as below:
In this spectrum, there only appear to be three peaks, which seems to contradict the number of vibrational modes. However, one of these vibrational modes at 2590 cm-1 is not IR active. Therefore, 5 of the 6 modes would be expected to be IR active. Of these 5, there are also degenerate vibrational modes at 1214 and 2713 cm-1. The degeneracy means only 3 peaks are expected on the IR spectrum.
MO diagram of BH3: Comparison of LCAO and Calculated MOs
The MO diagram for BH3 is shown below[1]. The calculated MOs are shown alongside LCAOs for that MO:
As it can be seen, the LCAO to represent the molecular orbitals for this small molecule accurately represents the calculated molecular orbitals. This shows that the qualitative use of MO theory is accurate and useful to describe these systems.
Smf115 (talk) 16:22, 28 May 2018 (BST)Clear inclusion of the MOs on the diagram. While the useful nature of qualitative MO theory has been highlighted, the differences between the calculated and qualitative MOs, such as the difference in AO contirbutions which are particularly visible in 3a1', could have been discussed.
Ammonia: NH3
Key Data
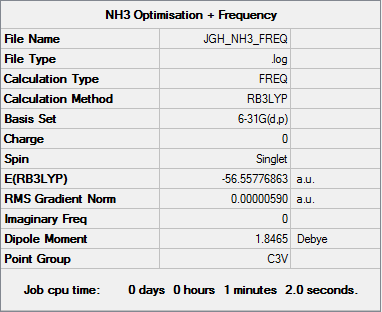
The following calculation was performed using a B3LYP/6-31G(d,p) basis set:
Item Table
         Item               Value     Threshold  Converged?
 Maximum Force            0.000013     0.000450     YES
 RMS     Force            0.000006     0.000300     YES
 Maximum Displacement     0.000040     0.001800     YES
 RMS     Displacement     0.000013     0.001200     YES
The file for this calculation is here.
Frequencies
  Low frequencies ---   -8.5223   -8.4750   -0.0037    0.0334    0.1918   26.4067
 Low frequencies --- 1089.7616 1694.1862 1694.1866
Ammonia: NH3 |
Vibrations for NH3
For any non-linear molecule, there are 3N-6 vibrational modes, where N is the number of atoms in the molecule. Here, NH3 has 4 atoms, and so we predict there to be 6 vibrational modes. These were calculated and are tabulated below:
| Wavenumber (cm-1) | Intensity (arbitrary units) | Symmetry | IR Active? | Type |
|---|---|---|---|---|
| 1089.76 | 145.42 | A1 | Yes | Bend |
| 1694.19 | 13.55 | E | Yes | Bend |
| 1694.19 | 13.56 | E | Yes | Bend |
| 3461.00 | 1.06 | A1 | Almost not | Symmetric Stretch |
| 3589.47 | 0.27 | E | Almost not | Asymmetric Stretch |
| 3589.47 | 0.27 | E | Almost not | Asymmetric Stretch |
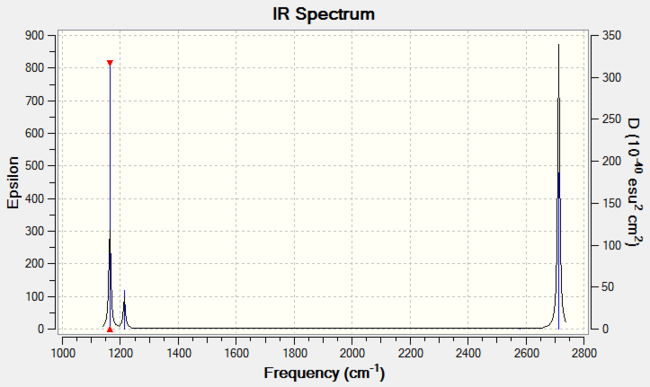
The predicted IR spectrum is as below:
In this spectrum, there only appear to be two peaks, which seems to contradict the number of vibrational modes. However, three of these vibrational modes at 3461 and 3589 cm-1 very low intensities, and so, when compared to the other vibrational modes, they are practically not IR active. Therefore, 3 of the 6 modes would be expected to be IR active. Of these 3, there is also a degenerate vibrational mode at 1694 cm-1. The degeneracy means only 2 peaks are expected on the IR spectrum.
Ammonia Borane complex: H3N-BH3
Key Data
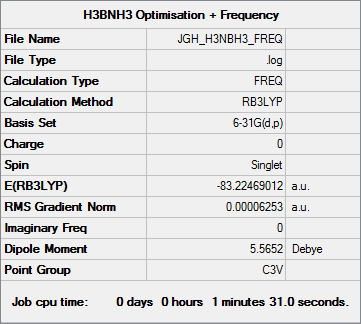
The following calculation was performed using a B3LYP/6-31G(d,p) basis set:
Item Table
          Item               Value     Threshold  Converged?
 Maximum Force            0.000113     0.000450     YES
 RMS     Force            0.000063     0.000300     YES
 Maximum Displacement     0.000612     0.001800     YES
 RMS     Displacement     0.000351     0.001200     YES
The file for this calculation is here.
Frequencies
 Low frequencies ---   -0.0618   -0.0458   -0.0065   21.6077   21.6136   40.3575
 Low frequencies ---  265.9921  632.3727  640.1263
Ammonia Borane: H3N-BH3 |
Vibrations for H3B-NH3
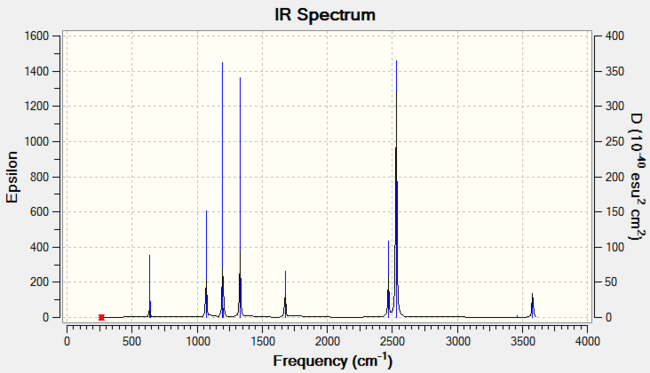
| Wavenumber (cm-1) | Intensity (arbitrary units) | Symmetry | IR Active? | Type |
|---|---|---|---|---|
| 265.98 | 0 | A2 | No | Torsion |
| 632.37 | 13.99 | A1 | Yes | Stretch |
| 640.13 | 3.54 | E | Almost not | Rocking |
| 640.13 | 3.54 | E | Almost not | Rocking |
| 1069.48 | 40.54 | E | Yes | Bend |
| 1069.48 | 40.54 | E | Yes | Bend |
| 1196.73 | 108.99 | A1 | Yes | Bend (out of plane) |
| 1203.60 | 3.50 | E | Almost not | Bend |
| 1203.60 | 3.50 | E | Almost not | Bend |
| 1330.13 | 113.62 | A1 | Yes | Bend (out of plane) |
| 1676.63 | 27.54 | E | Yes | Bend |
| 1676.63 | 27.54 | E | Yes | Bend |
| 2470.40 | 67.27 | A1 | Yes | Symmetric Stretch |
| 2530.42 | 231.34 | E | Yes | Asymmetric Stretch |
| 2530.42 | 231.32 | E | Yes | Asymmetric Stretch |
| 3462.54 | 2.51 | A1 | Almost not | Symmetric Stretch |
| 3579.42 | 27.92 | E | Yes | Aymmetric Stretch |
| 3579.42 | 27.92 | E | Yes | Asymmetric Stretch |
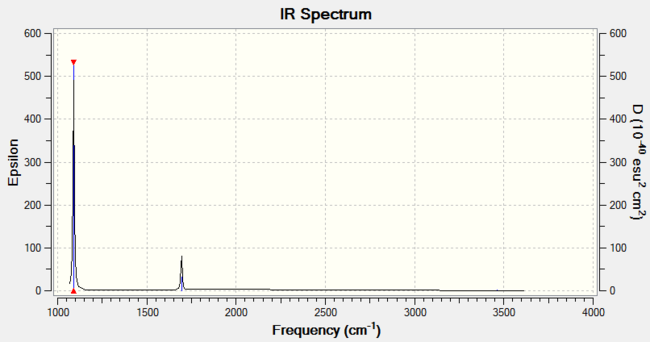
The predicted IR spectrum is as below:
Ammonia-Borane Dative Bond Strength
NH3 + BH3 → H3N-BH3
The strength of the dative covalent B-N bond in this complex can be calculated from the difference in bond energies of the products and the reactants of the above reaction:
E(BH3) = -26.61532 a.u.
E(NH3) = -56.55776 a.u.
E(H3NBH3) = -83.22469 a.u.
∴ ΔE = E(B-N) = -83.22496 - {-56.55776 - 26.61532} a.u. = -0.05188 a.u. = -136.21 kJ mol-1
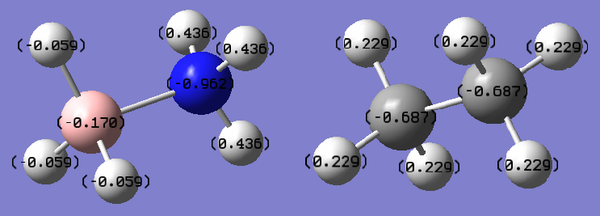
This is a weaker bond than both a N-N single bond (167 kJ mol-1) and a B-B single bond (293 kJ mol-1). Dative covalent bonds are weaker than normal covalent bonds, and tend to be polar. in this case, this is because the N atom is more electronegative than the B atom, pulling electron density towards it. This can be seen in comparing the charge distribution in atoms in H3N-BH3 (left) with that of an isoelectronic and isostructural molecule, ethane (right).
| Atom | Charge (arbitrary units) |
|---|---|
| N | -0.962 |
| HN | 0.436 |
| B | -0.170 |
| HB | -0.059 |
| Atom | Charge (arbitrary units) |
|---|---|
| C | -0.687 |
| H | 0.229 |
Ethane is a very symmetrical molecule (point group D3d), with the carbon atoms in identical environments, as well as the six hydrogen atoms. Carbon is slightly more electronegative than hydrogen (𝜒C=2.55, 𝜒H=2.2), and this is reflected in the charge distribution of the molecule - the carbon atoms have the same negative charge (-0.687), and the hydrogen atoms have the same positive charge (0.229).
In contrast, Ammonia-Borane has reduced symmetry (point group C3v) because of the difference between the nitrogen and boron atoms involved in the molecule. Nitrogen is more electronegative than boron (𝜒N=3.04, 𝜒H=2.04), so the electron density is mostly pulled away from the boron towards the nitrogen atom, hence the higher magnitude of charge on the atom. The high electronegativity of nitrogen also explains the higher charge on the hydrogen atoms bonded to the nitrogen, HN.
Smf115 (talk) 16:19, 28 May 2018 (BST)Very nice to see the charge analysis between NH3BH3 and ethane with good discussion on the relative electrnegativities within the molecules.
Boron Tribromide: BBr3
Key Data
The following calculation was performed using a B3LYP/6-31G(d,p) basis set for the Boron centre and the LANL2DZ pseudopotential for the Bromide ligands.
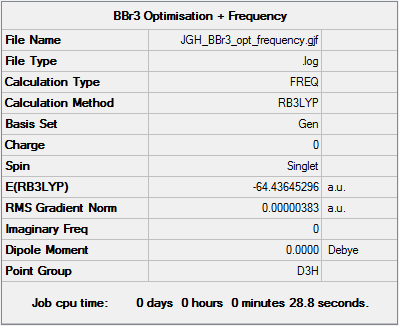
The file can be found on DSpace at DOI:10042/202462
Item Table
          Item               Value     Threshold  Converged?
 Maximum Force            0.000008     0.000450     YES
 RMS     Force            0.000004     0.000300     YES
 Maximum Displacement     0.000036     0.001800     YES
 RMS     Displacement     0.000018     0.001200     YES
The file for this calculation is here.
Frequencies
 Low frequencies ---   -0.0137   -0.0064   -0.0047    2.4315    2.4315    4.8421
 Low frequencies ---  155.9631  155.9651  267.7052
Boron Tribromide: BBr3 |
Vibrations for BBr3
For any non-linear molecule, there are 3N-6 vibrational modes, where N is the number of atoms in the molecule. Here, BBr3 has 4 atoms, and so we predict there to be 6 vibrational modes. These were calculated and are tabulated below:
| Wavenumber (cm-1) | Intensity (arbitrary units) | Symmetry | IR Active? | Type |
|---|---|---|---|---|
| 155.96 | 0.084 | E' | No | Bend |
| 155.96 | 0.084 | E' | No | Bend |
| 267.71 | 0 | A1' | No | Symmetric Stretch |
| 377.64 | 3.65 | A2" | No | Bend (Out of plane) |
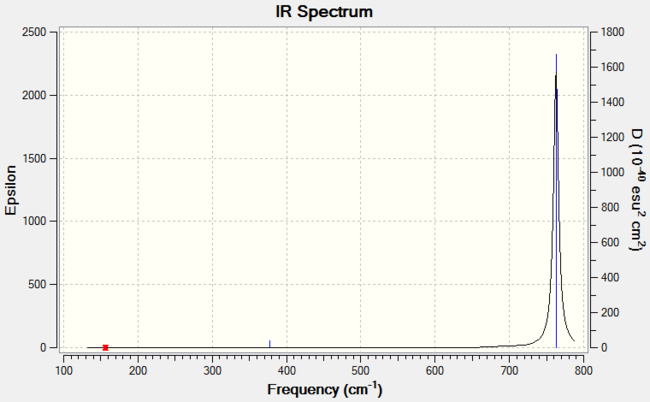
| 762.84 | 319.52 | E' | Yes | Asymmetric Stretch |
| 762.89 | 319.55 | E' | Yes | Asymmetric Stretch |
The predicted IR spectrum is as below:
Ionic Liquids: Designer Solvents
Tetramethylammonium ion: [N(CH3)4]+
Key Data
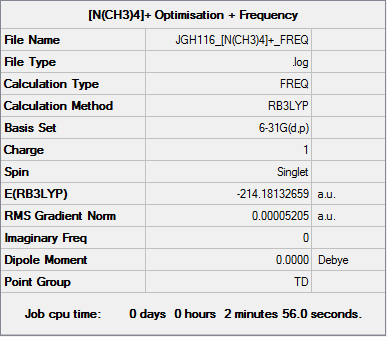
The following calculation was performed using a B3LYP/6-31G(d,p) basis set:
Item Table
         Item               Value     Threshold  Converged?
 Maximum Force            0.000091     0.000450     YES
 RMS     Force            0.000052     0.000300     YES
 Maximum Displacement     0.000762     0.001800     YES
 RMS     Displacement     0.000402     0.001200     YES
The file for this calculation is found here.
Frequencies
 Low frequencies ---    0.0010    0.0015    0.0015   35.2559   35.2559   35.2559
 Low frequencies ---  217.2586  316.3846  316.3846
Tetramethylammonium ion |
Tetramethylphosphonium ion: [P(CH3)4]+
Key Data
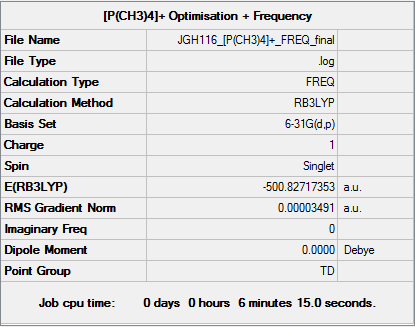
The following calculation was performed using a B3LYP/6-31G(d,p) basis set:
Item Table
         Item               Value     Threshold  Converged?
 Maximum Force            0.000069     0.000450     YES
 RMS     Force            0.000035     0.000300     YES
 Maximum Displacement     0.000218     0.001800     YES
 RMS     Displacement     0.000114     0.001200     YES
The file for this calculation is found here.
Frequencies
 Low frequencies ---   -0.0009    0.0024    0.0024   50.6093   50.6093   50.6093
 Low frequencies ---  188.2350  213.2379  213.2379
Tetramethylphosphonium ion |
Comparison of Charge Distributions
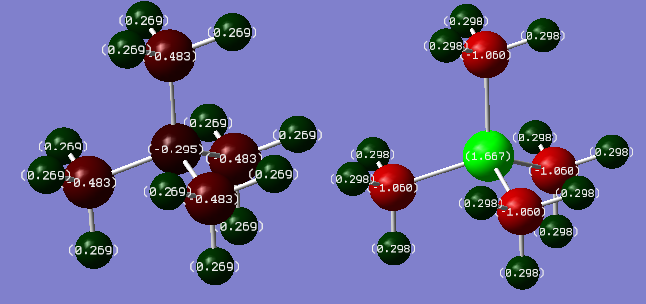
The charge distributions of the two ions were calculated and are shown below. Green denotes a positive charge, and red denotes a negative charge:
| Atom | Charge (arbitrary units) |
|---|---|
| N | -0.295 |
| C | -0.483 |
| H | 0.269 |
| Atom | Charge (arbitrary units) |
|---|---|
| P | 1.667 |
| C | -1.060 |
| H | 0.298 |
These two molecules are analogues, differing only by their central atom. In [N(CH3)4]+, the N atom has a charge of -0.295, whereas in [P(CH3)4]+, the P atom has a charge of +1.667. The important difference seen here is the sign of the charge. The N atom has a negative charge on it because it is more electronegative than carbon (𝜒N=3.04, 𝜒C=2.55), pulling electron density towards it, away from the carbon atoms. In constrast, the P atom has a positive charge on it because it is less electronegative than carbon (𝜒P=2.19, 𝜒C=2.55), therefore the carbon atoms pull electron density away from the P atom, resulting in a large, positive charge.
Carbon is more electronegative than hydrogen (𝜒C=2.55, 𝜒H=2.20), and so the carbon atoms in these molecules would be expected to have a negative charge. This is indeed the case in both molecules, with the charge on the carbon atoms in [N(CH3)4]+ being -0.483, and the charge on the carbon atoms in [P(CH3)4]+ being -1.060. The charge on the carbon atoms in [P(CH3)4]+ is over twice that of the carbon atoms in [N(CH3)4]+ because of the electronegativity of the centres. By inspecting their electronegativitie relative to carbon, (𝜒N=3.04, 𝜒P=2.19, 𝜒C=2.55) the N atom pulls electron density away from the carbon atoms towards itself, whereas the C atoms in [P(CH3)4]+ pull electron density away from the phosphorus centre reducing their negative charge. Therefore, the charge on the C atoms in [P(CH3)4]+ is significantly greater in magnitude than the charge on the C atoms in [N(CH3)4]+.
The hydrogen atoms are two bonds away from the central atom, and are therefore fairly unaffected by the change in the central atom. The net charge on the hydrogen atoms in [N(CH3)4]+ is 3.228, whereas the net charge on the hydrogen atoms in [P(CH3)4]+ is 3.576. There is not a significant difference between the two, showing that the change in central atom does not significantly affect the charge on the external atoms.
All electronegativities are from this website.
Tetraalkylammonium ion: [NR4]+
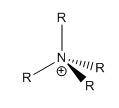
The tetraalkylammonium ion, [NR4]+ is usually depicted with the positive charge localised on the nitrogen centre. The nitrogen atom has four bonds, one more than its usual three bonds and a lone pair. Hence, with a fourth bond, it is logical to place the positive charge on the nitrogen atom. However, the calculated charge distribution of [N(CH3)4]+ does not reflect this. In this ion, the nitrogen atom carries a slight negative charge of -0.295. This indicates that the psotive charge is not actually localised to the central nitrogen atom, as normally depicted. In fact, the positive charge is distributed evenly and carried by the surrounding hydrogen atoms.
For the phosphorus analogue of the tetraalkylammonium ion (tetraalkylphosphonium), the charge distribution above shows that the central phosphorus atom possesses a positive charge. However, this is surrounded by four carbon atoms each with a negative charge of -1.060. Therefore, the effective positive charge is carried by the surrounding hydrogen atoms.
Smf115 (talk) 19:13, 1 June 2018 (BST)Great charge analysis with details of the electronegativities given and discussed. To improve, while I think you're correct explaining the usual charge depiction on [NMe4]+ it could be a bit clearer explaining it as a result from formal electron counting.
Molecular Orbitals of [N(CH3)4]+
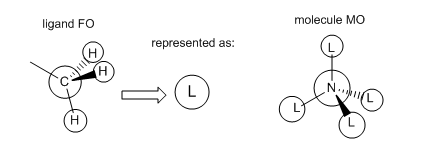
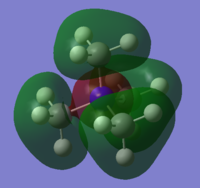
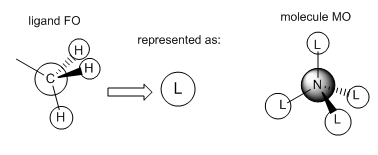
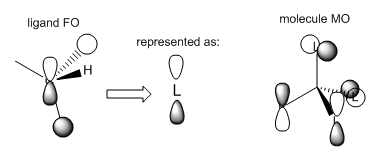
The molecular orbitals of [N(CH3)4]+ were calculated and visualised. The valence orbitals were found to start from MO 6, as the energy rose significantly between MOs 5 and 6 from -10...... to -1.19638 a.u. Three of the occupied MOs were visualised and compared to their LCAO approximations below:
Smf115 (talk) 19:10, 1 June 2018 (BST)Good choice of MOs covering a range of character and nice additional comment on the contributions and intro statement on the valence orbitals. The LCAOs and FOs are alrgely correct and clearly presented. However, in MO 16 the FO depicted is correct for the ligands which have no contirbution from one of the hydrogens. Not all four of the CH3 are the same though and some have contributions from all three of the H's, the corresponding FO for this ligand is then the other e' FO from your BH3 MO diagram. Therefore, there shoudl actually be two different FOs depicted here, otherwise excellent analysis!
Smf115 (talk) 19:10, 1 June 2018 (BST)Overall, a good wiki report with a strong project section.
References
- ↑ Dr. P Hunt, Molecular Orbitals Lecture Course, Imperial College London, November, 2017.


