MM2 CID:01180527
Introduction
Optimisations on an NH3 molecule were conducted using Gaussian. Key findings and information are presented in subsequent sections.
Key Data from NH3 Optimisations
Parameters and Derived Information
| Molecule | NH3 |
| Calculation Method | RB3LYP |
| Basis Set | 6-31G(d.p) |
| Final Energy Type | E(RB3LYP) |
| Final Energy Value | -56.55776873 a.u. |
| RMS Gradient Norm | 0.00000485 a.u. |
| Point Group | C3v |
| Bond Length | 1.01798Å |
| Bond Angle | 37.129o |
Item Table
        Item               Value     Threshold  Converged?
Maximum Force            0.000004     0.000450     YES
RMS     Force            0.000004     0.000300     YES
Maximum Displacement     0.000072     0.001800     YES
RMS     Displacement     0.000035     0.001200     YES
The data from the raw *log file can be found here.
Optimised Molecule
Ammonia |
Frequency Analysis & Atomic Charges
Frequency Analysis
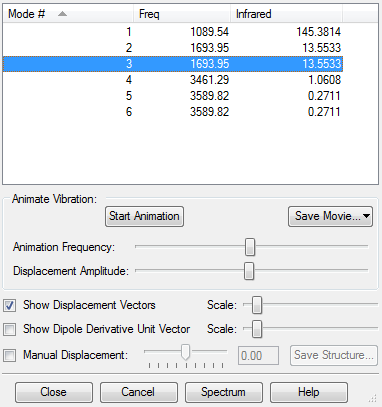
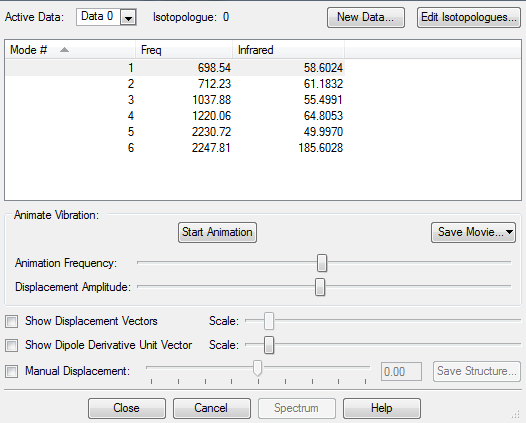
The following answers make reference to the modes presented in the screen capture above (ie: numbers 1-6 representing the different modes as specified above)
| Modes expected | 6 |
| Degenerate Modes | 2 and 3 |
| 5 and 6 (Asymmetric Stretches) | |
| Bending Modes | 1, 2, 3 |
| Stretching Modes | 4, 5, 6 |
| Symmetric mode | 4 |
| Umbrella mode | 1 |
| IR bands expected | 2 |
Only 2 IR bands are expected despite all 6 modes causing a change in dipole moment because
(i) modes 2 and 3 are degenerate so will not produce separate bands
(ii) the intensity of the IR bands for modes 4,5,6 are too small to be significantly noticeable on the spectrum
Atomic Charges
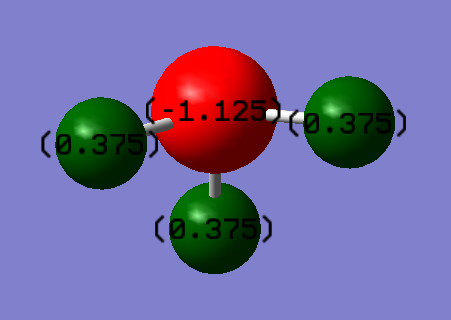
The charges on the NH3 molecule are as follow: +0.375 on the H atoms and -1.125 on the N atom, in accordance with expected values. Expected charges on N and H would be negative and positive respectively as a result of electronegativity differences causing more electrons to reside towards the N atom in the N-H bond.
Reaction Energies
N2 and H2 Optimisations
| N2 | H2 | |
|---|---|---|
| Calculation Method | RB3LYP | RB3LYP |
| Basis Set | 6-31g(d,p) | 6-31g(d,p) |
| Final Energy Value (a.u.) |
-109.52412868 | -1.17853936 |
| RMS Gradient Norm (a.u.) |
0.00000060 | 0.00000017 |
| Point Group | D∞h | D∞h |
| Bond Length (Å) | 1.10550 | 0.74279 |
| Bond Vibrating Frequency |
2457.33 | 4465.68 |
N2 Item Table:
        Item               Value     Threshold  Converged?
Maximum Force            0.000001     0.000450     YES
RMS     Force            0.000001     0.000300     YES
Maximum Displacement     0.000000     0.001800     YES
RMS     Displacement     0.000000     0.001200     YES
H2 Item Table:
        Item               Value     Threshold  Converged?
Maximum Force            0.000000     0.000450     YES
RMS     Force            0.000000     0.000300     YES
Maximum Displacement     0.000000     0.001800     YES
RMS     Displacement     0.000001     0.001200     YES
Calculating Haber-Bosch Reaction Energies
| E(NH3) | -56.55776873 a.u. |
| 2*E(NH3) | -113.11553746 a.u. |
| E(N2) | -109.52412868 a.u. |
| E(H2) | -1.17853936 a.u. |
| 3*E(H2) | -3.53561808 a.u. |
| ΔE=2*E(NH3)-[E(N2)+3*E(H2)] | -0.0557907 a.u = -146.48 kJ mol-1 |
Since the reaction is exothermic, this suggests that NH3 is more stable energetically than the gaseous reactants N2 and H2.
Choice of Small Molecule: F2
Key Data
| Molecule | F2 |
| Calculation Method | RB3LYP |
| Basis Set | 6-31G(d.p) |
| Final Energy Type | E(RB3LYP) |
| Final Energy Value | -199.49825220 a.u. |
| RMS Gradient Norm | 0.00002378 a.u. |
| Dipole Moment | None |
| Point Group | D∞h |
| Bond Length | 1.40293Å |
Item Table
        Item               Value     Threshold  Converged?
Maximum Force            0.000041     0.000450     YES
RMS     Force            0.000041     0.000300     YES
Maximum Displacement     0.000051     0.001800     YES
RMS     Displacement     0.000071     0.001200     YES
The data from the raw *log file can be found here
Interactive Molecule Image
Fluorine |
Frequency Analysis & Atomic Charges
Frequency Analysis
The vibrational mode shown is a symmetric stretch; no other vibrational modes are present since F2 is a linear diatomic molecule, hence there are only 3N-5 = 3(2)-5 = 1 mode.
However, as the vibration does not cause a change in dipole moment of the F2 molecule, hence no IR bands are expected in an IR spectrum since the molecule is IR-inactive by Gross Selection Rule.
Atomic Charge Distribution
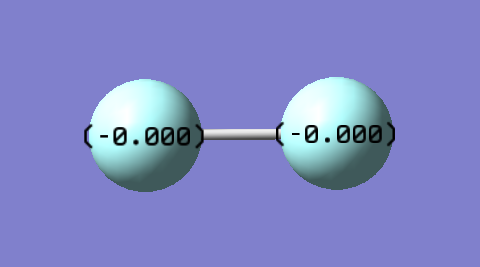
As expected, charges on each F atom in F2 are 0. This is because both F atoms on the bond are equal in electronegativity hence electron distribution in the F2 bond is equal despite F being the most electronegative element. The equal electron distribution results in no charge being created. The molecule is also non-polar as a result.
Molecular Orbitals
Highest Occupied Molecular Orbitals (HOMO)
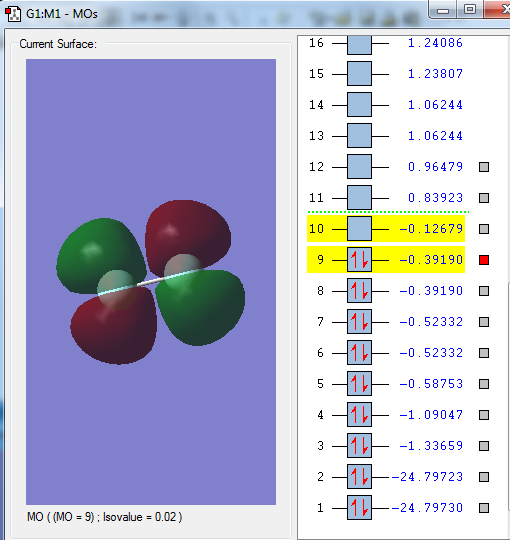
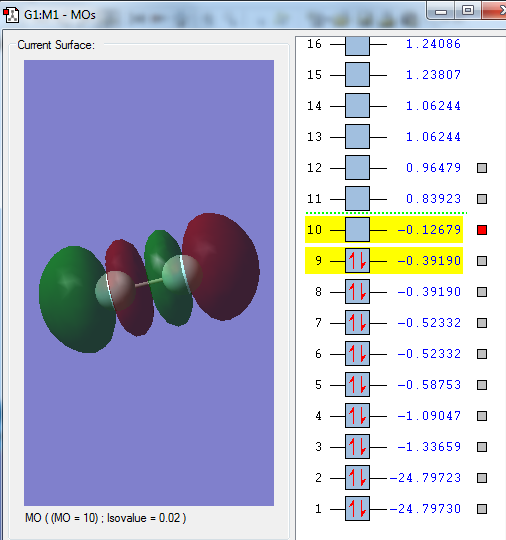
The HOMO of F2 are the π* (pi anti-bonding) orbitals - one formed from interaction between the 2px orbitals and another from 2py orbitals of the constituent F atoms. The HOMO is high is energy and in the HOMO-LUMO energy region.
Lowest Occupied Molecular Orbitals (LUMO)
The LUMO of F2 is the σ* orbital formed from interaction between the 2pz orbitals of the constituent F atoms. The LUMO is high is energy and in the HOMO-LUMO energy region.
A selection of other MOs
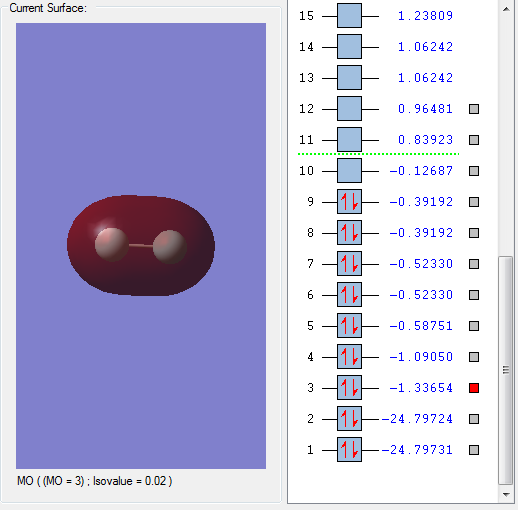
The above MO is the σ bonding MO formed from the interaction between 2s orbitals of the constituent F atoms. This MO is deep in energy. Since it is a bonding MO, it has a positive effect on bonding and is occupied by electrons.
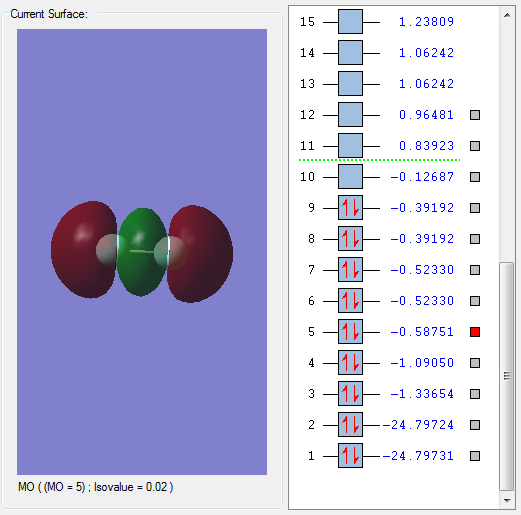
The above MO is the σ bonding MO formed from the interaction between 2pz orbitals of the constituent F atoms. This MO is deep in energy. Since it is a bonding MO, it has a positive effect on bonding and is occupied by electrons.
The above MO is the π bonding MO formed from the interaction between 2py orbitals of the constituent F atoms. It could also be formed from the 2px orbitals since both resulting π MOs are degenerate; it depends on how the cartesian axes are defined. This MO is deep in energy. Since it is a bonding MO, it has a positive effect on bonding and is occupied by electrons.
Independent Study on H2SiO
Key Data
| Molecule | H2SiO |
| Calculation Method | RB3LYP |
| Basis Set | 6-31G(d.p) |
| Final Energy Type | E(RB3LYP) |
| Final Energy Value | -365.90001391 a.u. |
| RMS Gradient Norm | 0.00009788 a.u. |
| Dipole Moment | 3.4344 Debyes |
| Bond Length (Si-H) | 1.48651Å |
| Bond Length (Si-O) | 1.53146Å |
| Bond Angle (H-Si-H) | 111.732o |
| Bond Angle (H-Si-O) | 124.135o |
Item Table
        Item               Value     Threshold  Converged?
Maximum Force            0.000271     0.000450     YES
RMS     Force            0.000111     0.000300     YES
Maximum Displacement     0.000816     0.001800     YES
RMS     Displacement     0.000575     0.001200     YES
Interactive Molecule Image
H2SiO |
Frequency Analysis
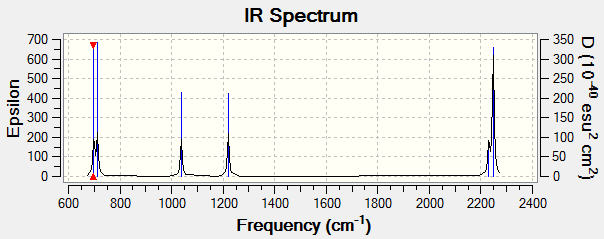
Shown above is the different vibrational modes exhibited by H2SiO. Modes 1, 2 and 3 are purely bending modes. Mode 4 is a combination of a stretch and a bend. Mode 5 and 6 are purely stretching modes. Since H2SiO is a non-linear molecule, hence it has 3N-6 = 3(4)- = 6 modes, and the result is as expected. Since all the vibrations result in a change in the molecule's dipole moment, hence they are all IR active and 6 IR bands are expected. The predicted IR spectrum is shown below.
Atomic Charges
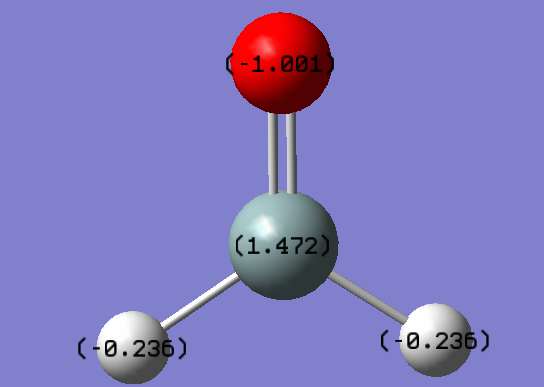
Electronegativities of the elements in H2SiO increases in the order Si<H<O, hence we would expect the charges to decrease (become more negative) in the same order. Therefore the result is as expected.
Molecular Orbitals
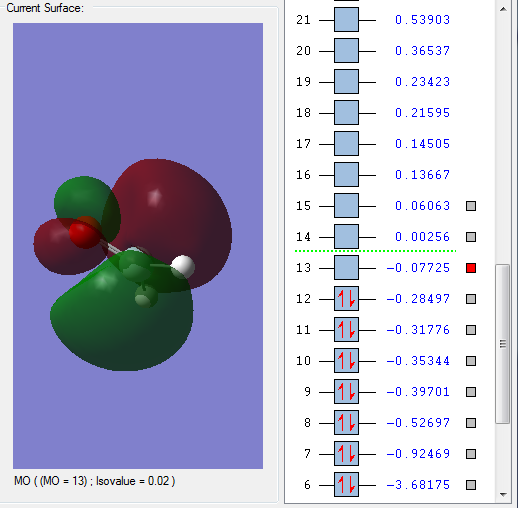
Shown above is the LUMO of H2SiO. It is unoccupied and anti-bonding.
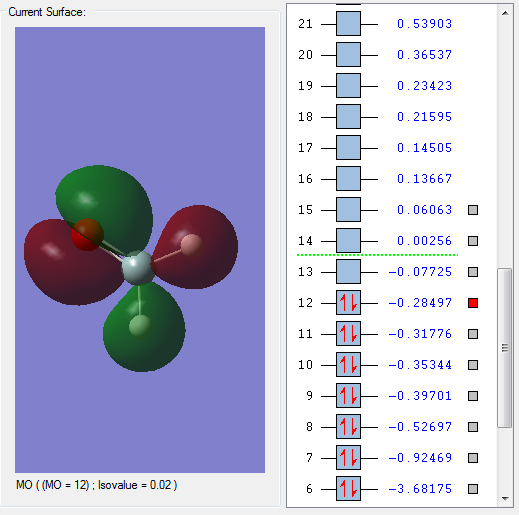
Shown above is the HOMO of H2SiO. It is occupied and anti-bonding.

