MDR YF-1716
Molecular Reaction Dynamics
H + H 2 molecule
Transition structures
On a potential energy surface (PES), a reaction pathway may be identified as a route between two energy minima. Along this pathway, there is an energy maximum, and the geometry at this maximum corresponds to the transition structure. A transition structure can be described as a saddle point.
At all stable points on the PES, the value for the first derivative ∂V(ri)/∂ri, and hence the gradient, is equal to zero. When distinguishing between minima ɑnd maxima, the second derivative can be very useful. For a minimum point, the value for the second derivative ∂2V(ri)/∂ri2 is greater than zero, whilst for a maximum it is less than zero.
In terms of this reaction, we are interested in the saddle point (transition structure) and minima (reactants or products). At point points, the gradient is equal to zero. To tell between the two, the curvature of the PES becomes much more important. A miniumum will remain a minimum point regardless of the direction moved in, however, a saddle point can be either a 'minimum' or a 'maximum' point, depending on the direction. In the reaction pathway, the saddle point is a maximum and in the orthogonal direction it is a mimumum.
Estimating the transition state position
In the case of H + H 2, in the resulting transition state the distances between adjacent nuclei would be equal, r1 = r 2. This distance can be called rts. It can be estimated using a plot of internuclear distance vs time.
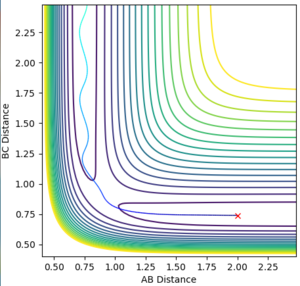
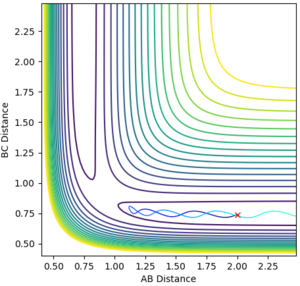
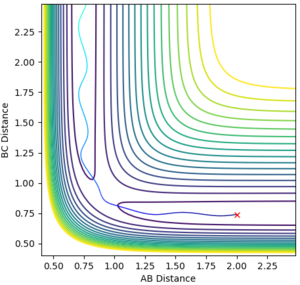
During the estimation, the potential energy of both BC and AB were set to zero. Regardless of this, oscillation is observed in the animation, given that the atoms will follow the gradient of the PES. This means that in the plot of internuclear distance versus time, oscillations would be observed. Through a method of trial and error, the value for the estimate rts was found to be 0.9075. This illustrated by the images below, which show the plot of internuclear distance vs time with values of 0.895, 0.9075 and 0.920 Å respectively.
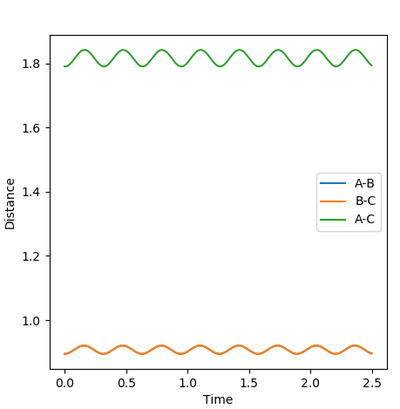

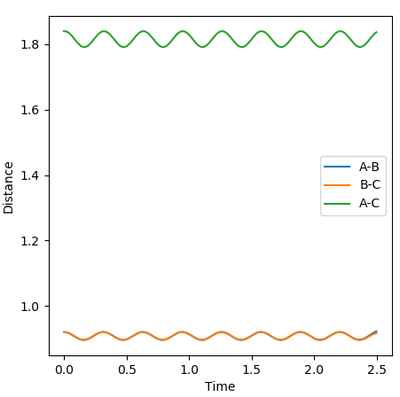
It can be seen that at the estimated value of 0.9075 Å, there are no oscillations, whilst at values +/- 0.125 from the estimated value, oscillations are observed. This is consistent with the theory that oscillations occur just before and just after the transition state, but not during the transition state itself. For the seemingly flat lines obtained on the graph for rts = 0.9075 Å, if the image is 'zoomed in' the lines begin to show a small degree of curvature. This shows that the nature of the value is in fact an estimate and a much higher degree accuracy would be required to locate rts exactly.
Calculating the reaction pathː MEP and Dyanmic
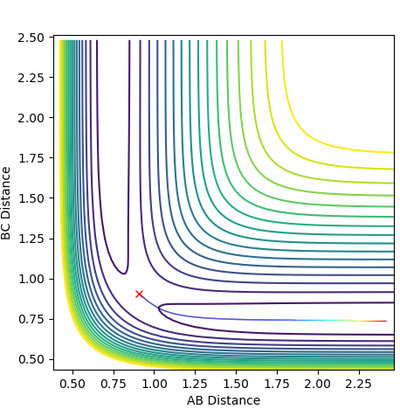
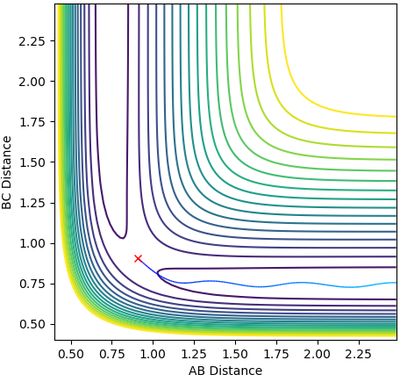
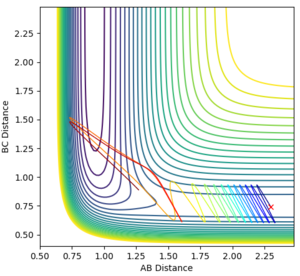
The contour plot produced with MEP shows a more linear trajectory than that produced from dynamic. The MEP is the minimum energy reaction path, and thus there are no oscillations observed. However, in the dynamic plot, the molecule still has energy so vibrations are represented in the form of oscillations.
Mm10114 (talk) 19:12, 31 May 2018 (BST) A good attempt. However, your explanation is pretty scarce. You should explain more clearly why oscillations in MEP are not observed that it can take the minimum energy path. You have kind of said "MEP is MEP and thus there are no oscillations". And in the next part, what kind of "energy"? Be specific.
Reactive or unreactive trajectories
Transition state theory
The assumptions in transition state theory are as follows.
1. Atoms in the reactant state have a boltzmann type distribution 2. After the system is at the transition state, and has a velocity in the direction of the products, it will not return to the initial state region 3. Classical mechanics is applied as opposed to quantum mechanics
The first assumptions requires a thermal equilibrium to be true and could be applied to the reaction modeled above. However, the second and third assumptions can not be applied. We have seen the second assumption breakdown in some of the cases above; where the trajectory reached the transition state and then continued in a 'backwards' direction to the reactants. The third assumption ignores some of the things considered by quantum mechanics, such as tunneling, by the invocation of the Born-Oppenheimer approximation. Classical mechanics would be sufficient for cases where tunneling through the energetic barrier wasn't an option. This could provide an explanation for the last trajectory in the table above.
Given that by the breakdown of these approximations, more reaction pathways are accessible, the experimental rate could be higher than the rates predicted by transition state theory.
Mm10114 (talk) 19:12, 31 May 2018 (BST) A good discussion in relation to the observations you've made during this workshop. However, where did you take these TST assumptions from? You're missing a reference.
F-H-H system
PES inspection
Bond strength is related to several factors, one of which is the electronegativity difference of the atoms. There is a large electronegativity difference in a HF molecule, so the bond would be very short and very strong. In the case of F + H2, a relatively weak H2 bond is broken, and a much stronger HF bond is formed. Breaking a weak bond requires little energy and forming a strong one would release a lot of energy, so this reaction can be predicted to be exothermic. The opposite applies in the case of H + HF, where the stronger bond is broken, requiring a lot of energy and a weaker bond is formed, releasing little energy. Thus this reaction will be endothermic.
Hammond's postulate states that if two species are similar in energy, then it can be assumed that there is little structural rearrangement between the two, hence they are also similar in structure. In an exothermic reaction, the transition state occurs early, so is closer in energy and structure to the reactants. As mentioned above, F + H2 would be an exothermic reaction.
The image below was produced after the approximate location of the transition state, using methods similar to those applied in the H + HH system. The distances were found to have values of r1 = 0.745 Å and r2 = 1.8105 Å, where the distances r1 and r2 correspond to the H-H and F-H separations respectively. There are no oscillations, showing that we are at a stable point.
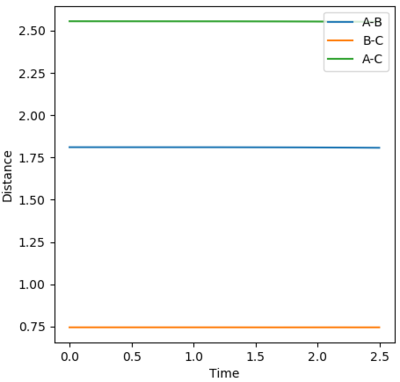
The activation energy is the difference between the transition state and reactant energies. The transition state energy was found to be -103.752 kcal/mol. Performing a MEP where the r1 and r2 distances are slightly offset from the transition state lengths will help to find the activation energy.
In the reaction of F + H2, the activation energy was found to be +0.254 kcal/mol. Whilst in the case of H + HF, activation energy was found to be -0.124 kcal/mol.
Mm10114 (talk) 19:19, 31 May 2018 (BST) Overall your discussion is very good. However, as you have stated the HF bond is strong and the reaction to break it will be highly endothermic. Yet, you report an activation energy of -0.1 kcal/mol. It should worry you that this value is almost equal to 0, and unfortunately it is incorrect.
Reaction Dynamics
The image below shows a plot of internuclear momenta vs time. With the particular set of initial conditions chosen, the plot produced isn't as 'neat' as it could have been. The animation showed that the H2 molecule oscillated before reaching the the fluorine atom. Then one hydrogen atom joined fluorine to form HF, but this broke down and molecular hydrogen was formed again. This is because the product was vibrationally excited to a level high enough where it could reform the reactants. Finally, HF was formed once again and this molecule began to oscillate. These three animation stages can be related to the momenta vs time plot, with the last, regular section relating to the oscillating HF molecule. As mentioned previously, this reaction is exothermic and thus releases energy. This energy is conserved given that it is converted into vibrational energy in the HF bond.
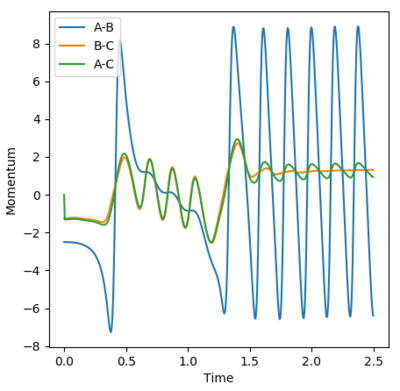
In order to confirm these findings, IR spectroscopy could be used, given that it is based upon vibrational modes. The HH molecule is not IR active, as the vibrations are symmetric and do not cause a change in dipole moment. The HF molecule however, would confirm these findings.
Polanyi's empirical rules
These rules state that when there is a late transition state, vibrational energy would act as a better promoter of the reaction instead of translational energy. However, in the case of an early transition state, the opposite is true (translational energy is a better reaction promoter.
In the case of F + H2, the reaction is exothermic and the transition state occurs early. The opposite is true for H + HF. The table above shows that the trajectories for F + H2 are both unreactive, seemingly not following Polanyi's rules. However, the momentum is related to the kinetic energy by the equation p 2 / 2m. Since the square of both 3 and -3 is 9, these two trajectories appear to be similar. For H + HF, the case where the vibrational energy is higher was the reactive trajectory, following Polanyi's rules.
Mm10114 (talk) 19:19, 31 May 2018 (BST) Good observations, however where is the reference for the Polanyi's rules?
References
G. D. Billing and K. V. Mikkelsen, Introduction to Molecular Dynamics and Chemical Kinetics, Wiley-Interscience, United States, 1996
T. Bligaard and J.K. Nørskov, Chemical Bonding at Surfaces and Interfaces,Elsevier, Amsterdam, 2008, ch. 4, pp. 255-321
Z. Zhang, Y. Zhou, and D. H. Zhang, J. Phys. Chem. Lett., 2012, 3 (23), pp. 3416–3419

