MDR:fgk17phys
MRD
Ferdinand Krammer
Ng611 (talk) 19:39, 30 May 2019 (BST) A very good report with only one or two very minor (insubstantial errors). Well done.
Exercise 1
Q1
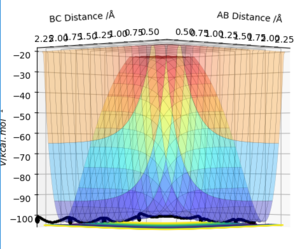
On a potential energy surface diagram, how is the transition state mathematically defined? How can the transition state be identified, and how can it be distinguished from a local minimum of the potential energy surface?
the transition state is the maximum on the minimum energy path way meaning that it is the saddle point on the surface energy diagram which is defined by equations 1,2,3.
equation 1:
equation 2:
equation 3:
ce.
the tranition state can be identified as it is the point at which if the particles are placed at with no initial momentum they will not move so the inter-nuclear distances remains constant and the momentum remains constant
For a local minimum and or when or which means that if the particles where placed at that point with no initial momentum the inter-nuclear distances would not remain constant and nor would the momentum.
Ng611 (talk) 19:30, 30 May 2019 (BST) , not . There's a significant difference. This applies to all the equations here. In all other respects however, you're correct.
Q2
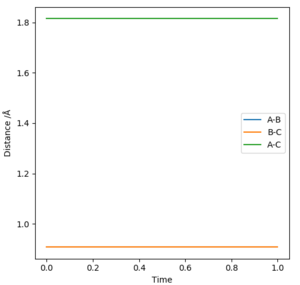
Report your best estimate of the transition state position (rts) and explain your reasoning illustrating it with a “Internuclear Distances vs Time” plot for a relevant trajectory.
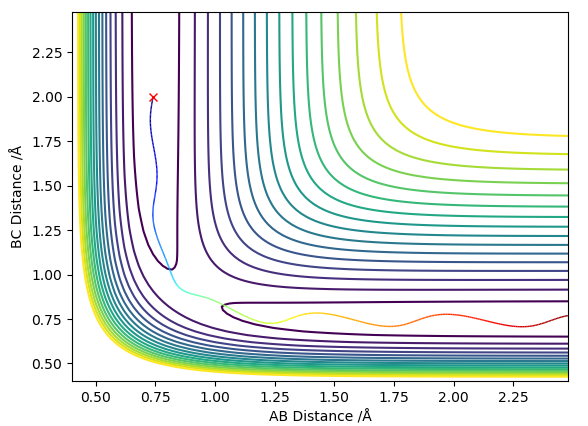
the best estimate of the transition state position is rHH=0.908Å at this point the internuclear distances are no longer changing with time as shown in figure 1. this can be calculated to a greater number of decimal places using this program however to a greater number of decimal places it is no longer accurate as then it is being given to the accuracy of the width of a proton.
Ng611 (talk) 19:34, 30 May 2019 (BST) Nope, a proton has an approximate width of 1 femtometer (10^-15 m); you've quoted your result to an accuracy of 10^-13 meters (100x the width of a proton). Still, you've obtained a good estimate for the TS position, well done.
Q3
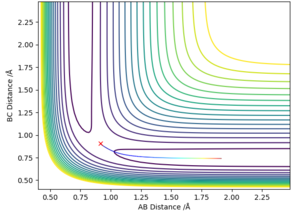
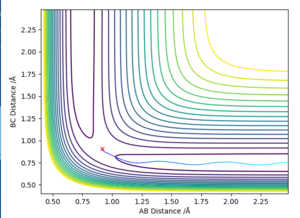
Comment on how the mep and the trajectory you just calculated differ.
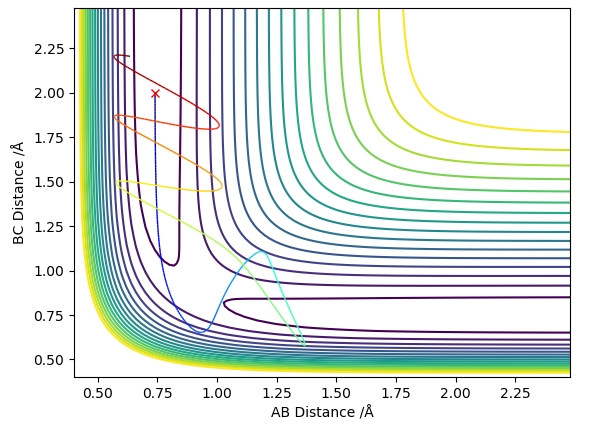
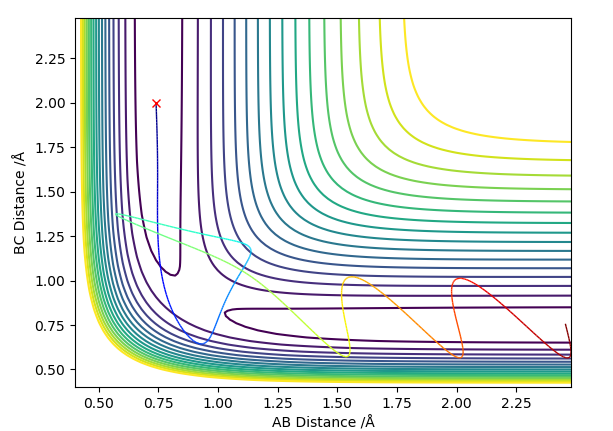
The MEP stays at the local minimum as the particles move away from the transition state (the bottom of the valley) this is as the kinetic energy removed form the oscillations in the simulation resulting in the particles moving at a decreasing energy away from one another with the bond which is formed remaining a constant length (particles B and C don't oscillate (bond length remains at bottom PE)) shown in figure 2. Where as in the dynamic simulation kinetic energy is not being removed meaning that the particles B and D are oscillating as in figure 3. for the MEP plot of momentum against time it can be seen that it is 0.
Q4
Complete the table above by adding the total energy, whether the trajectory is reactive or unreactive, and provide a plot of the trajectory and a small description for what happens along the trajectory. What can you conclude from the table?
from this it can be seen that if the energy is just above the energy of the transition then the reaction will occur however in some cases when the energy is much greater than the energy of the transition state the reaction dose not occur as in the fourth example but at a greater energy the reaction occurs as in the fifth example meaning that the prediction of the transition state theory that if the energy is greater than the activation energy the reaction goes to completion is false as it is possible for the reactants to go to products and then the energy of the products cause the reverse reaction before they have had time to separate.
Q5
State what are the main assumptions of Transition State Theory. Given the results you have obtained, how will Transition State Theory predictions for reaction rate values compare with experimental values?
there are 3 main assumptions and they are that reactants are in equilibrium with the transition state (activated complex), the energy of the particles follows a Boltzmann distribution[1] (this is not relevant to this situation as we are only dealing with 3 molecules however is applicable for a gas) and that once the reactants have formed the products there is no reverse process[2]. In transition state theory this is thought of as reactants forming an activated complex which can either reform the reactants or can form the products however once the products have been formed there is no reveres process [2]. The transition state theory dose not take into account the fact that the Products could have enough energy and take the correct pathway so as to overcome the transition state and form the reactants again this suggests that the total rate of reaction would be slightly less than those that the theory predicts.
Ng611 (talk) 19:36, 30 May 2019 (BST) Good!
Exersies 2
Q6
By inspecting the potential energy surfaces, classify the F + H2 and H + HF reactions according to their energetic (endothermic or exothermic). How does this relate to the bond strength of the chemical species involved?
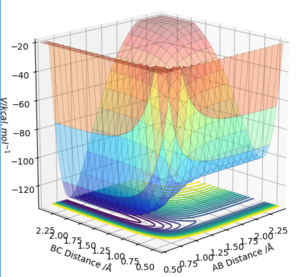
F + H2 → H + HF is exothermic with the reverse reaction being endothermic. weather a reaction is exothermic or endothermic is dependent on the bond energies of the reactants and products. As the HF bond has a lower PE (-134.02 kcal mol-1) it means that a greater amount energy needs to be put in to break it meaning that its formation form H2 and F will be exothermic however to break it it will be endothermic as the H2 bond energy is greater (- 104.02 kcal mol-1). This is seen in the potential surface energy plot as the HF+H minimum is lower than the minimum of H2+F as shown in Figure 4.
Ng611 (talk) 19:36, 30 May 2019 (BST) Good answer.
Q7
Locate the approximate position of the transition state.
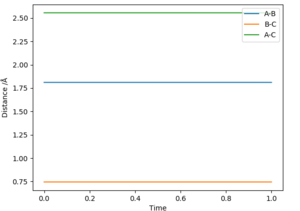
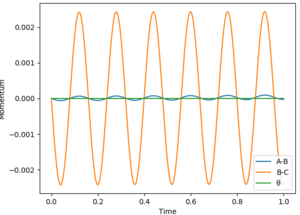
the Transition state is found when rFH is 1.811 Å and rHH is 0.745 Å. This is determined by using Hammond postulate which states that the transition state resembles there reactants or products depending on which it is closer in energy. As the HF+H is lower in energy that the H2+F then the transition state resembles more closely the latter. They were then determined by variying the positions with zero momentum internuclear disstances nolonger varied gratly with time (figure 5) meaning that the average momentum remained constant with time (apeared as a sin wave (figure 6)).
Q8
Report the activation energy for both reactions.
activation energy = E(transition state) - E(reactants)
E(FH)=-134.02 kcal mol-1
E(HH)=-104.02 kcal mol-1
E(transition state)=-103.75 kcal mol-1
therefore the activation energy for H2+F is 0.27 kcal mol-1
and the activation energy for HF+H is 30.27 kcal mol-1 which is what is expected as the latter on is endothermic and therefore would have a higher activation energy
the energies were determined using the MEP at large distances between 2 of the molecues and the bond length between the other 2
Q9
F+H2 In light of the fact that energy is conserved, discuss the mechanism of release of the reaction energy. Explain how this could be confirmed experimentally.
As in the F+H2 reaction energy is conserved, the Potential energy becomes vibrational energy with the HF bond oscillating an increased rate as shown in figures 7 and 8. As there is a change in dipole moment this vibration will be IR active meaning that the experiment could be determined to have occurred if there is a peak in the IR spectrum as H2 is not IR active
Ng611 (talk) 19:37, 30 May 2019 (BST) This would confirm that you had a product, but what would you need to see in your IR spectrum to confirm it's vibrationally excited?


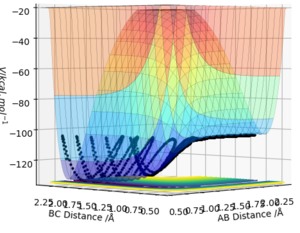
When keeping the initial condition constant (rHH=0.74 rHF=2.3 pFH=-0.5) and varying the momentum of HH between -3 and 3 although the energy is generally greater than the energy of the transition state the particles generally don't react as they collapse back in to the reactants after reaching the transition states. Once the initial conditions have been changed to rHH=0.74 rHF=2.3 pFH=-0.8 pHH=0.1 reaction is observed.
Q10
Discuss how the distribution of energy between different modes (translation and vibration) affect the efficiency of the reaction, and how this is influenced by the position of the transition state.
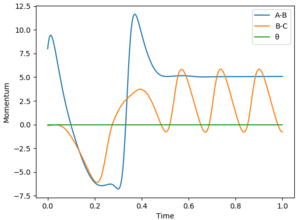
According to the Polanyi’s empirical rules for an endothermic process with a late transition state, then the transition state is best surmounted by vibrational energy rather than translational energy as shown in figure 10. As particles with high transnational energy will not go over the transition state but instead bounce back as they colide with the potential wall and no reaction will occur [1]. For an exothermic process (early transition state) the transnational energy is enough to overcome the transition state where as vibrational energy is not.

Ng611 (talk) 19:38, 30 May 2019 (BST) Good!


