Ly617
Introduction
This lab constructs molecule or complex models using Gaussview, optimises the models and runs frequencies analysis on them via calculation. By doing so, the bonding and anti-bonding of the molecules or complexes, their structures, vibration modes and MOs can be visualised and used for further investigation. In this lab, the molecules BH3, NH3, NH3BH3, NI3, and the cations [N(CH3)4]+ and [N(CH3)4]+ are analysed.
Revision
BH3 Molecule
B3LYP/3-21G

In terms of presentation, this calculation isn't relevant to the report and it would have been good to see some comment made as to why it was carried out to make it relevant. Smf115 (talk) 07:29, 30 May 2019 (BST)
        Item               Value     Threshold  Converged?
Maximum Force            0.000217     0.000450     YES
RMS     Force            0.000105     0.000300     YES
Maximum Displacement     0.000919     0.001800     YES
RMS     Displacement     0.000441     0.001200     YES
The total energy = -26.46226371 a.u.
B3LYP/6-31G(d,p)

        Item               Value     Threshold  Converged?
Maximum Force            0.000203     0.000450     YES
RMS     Force            0.000098     0.000300     YES
Maximum Displacement     0.000867     0.001800     YES
RMS     Displacement     0.000415     0.001200     YES
The total energy = -26.61532350 a.u.
Jmol image of BH3:
BH3 |
Frequency Analysis of BH3
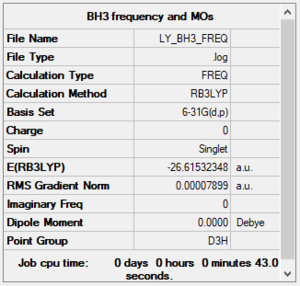
Frequency analysis log file Media:LY_BH3_FREQ.LOG
Low frequencies ---   -0.2456   -0.1129   -0.0054   44.0270   45.1846   45.1853
Low frequencies --- 1163.6049 1213.5924 1213.5951

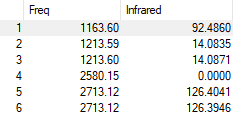
| Mode | Frequency | Intensity | IR active? | Type of vibration | Symmetry Type | Symmetry |
|---|---|---|---|---|---|---|
| 1 | 1164 | 93 | Yes | bending | out of plane | A2 |
| 2 | 1214 | 14 | Yes | bending | in plane | E' |
| 3 | 1214 | 14 | Yes | bending | in plane | E' |
| 4 | 2580 | 0 | No | stretching | symmetric | A1' |
| 5 | 2713 | 126 | Yes | stretching | asymmetric | E' |
| 6 | 2713 | 126 | Yes | stretching | asymmetric | E' |
There are totally 6 vibration modes, but from the IR spectrum only 3 peaks can be observed, which are 1163.6 cm-1, 1213.6 cm-1, 2713.1 cm-1. This is because Mode 2 and Mode 3 are degenerate, Mode 5 and Mode 6 are degenerate. Mode 4 (2580 cm-1) is not shown in the spectrum since all the dipole moments cancelled out with each other hence it's IR inactive.
The MO Diagram of BH3
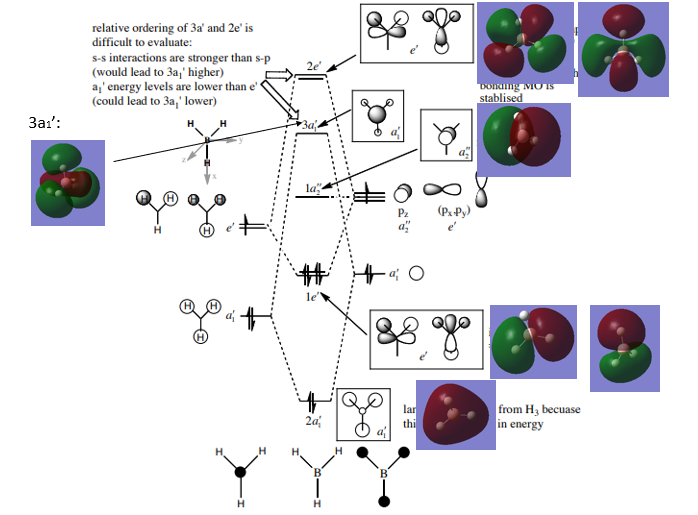
The MOs diagram of BH3 from Hunt Research Group's website: http://www.huntresearchgroup.org.uk/teaching/teaching_comp_lab_year2a/Tut_MO_diagram_BH3.pdf.[1]
- ↑ This is the MOs of BH3 reference.
Q1. Are there any significant differences between the real and LCAO MOs?
LCAO MOs does not provide an actual description of the molecular orbitals but an optimised and predicted one, forming by each of the individual AOs, and it can be used as reference of the real MOs. LCAO MOs contains lobes with different phases, which represents the s and p orbitals of atoms, and simple lines representing the bond between adjacent atoms. In LCAO MOs, the AOs stay separated from each other. In real MOs, the exact sizes of orbitals are described. The orbitals with the same phases can merge, showing the overlap of the AOs.
Q2. What does this say about the accuracy and usefulness of qualitative MO theory?
The accuracy of the qualitative MOs depends on the level of complication of the molecules. For the MOs of the molecules with less atoms, LCAO MOs can describe the MOs more clearly and overlap of AOs can be predicted easily. For larger molecules, the LCAO MOs are disabled in many aspects, for example visualising the AOs is becoming complicated and fails to show the overlap of the AOs. But still LCAO is a reliable prediction of the real MO hence is quite useful.
Good inclusion of all the calculated MOs on to the MO diagram and overall evaluation of the usefulness of the LCAO approach. Good attempt at considering the differences between the LCAO and calculated MOs, however, the reasons you've mentioned are more just the drawing conventions of the LCAOs and not differences between the final predicted MOs. Think instead about what the LCAO approach fails to capture (e.g. relative contributions which can be seen from 3a1' for example). Smf115 (talk) 07:35, 30 May 2019 (BST)
NH3 Molecule
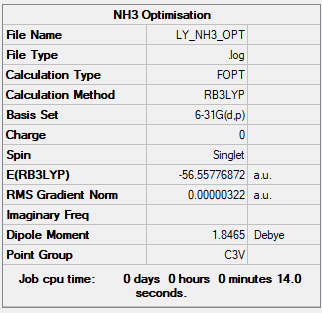
B3LYP/6-31G(d,p)
         Item               Value     Threshold  Converged?
 Maximum Force            0.000006     0.000450     YES
 RMS     Force            0.000004     0.000300     YES
 Maximum Displacement     0.000016     0.001800     YES
 RMS     Displacement     0.000011     0.001200     YES
Thr total energy = -56.55776872 a.u.
Jmol image of NH3:
NH3 |
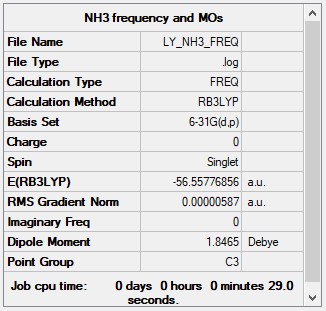
Frequencies Analysis of NH3
Low frequencies ---   -8.5646   -8.5588   -0.0047    0.0454    0.1784   26.4183
Low frequencies --- 1089.7603 1694.1865 1694.1865
Frequency analysis file: Media:LY_NH3_FREQ2.LOG
NH3BH3 Molecule
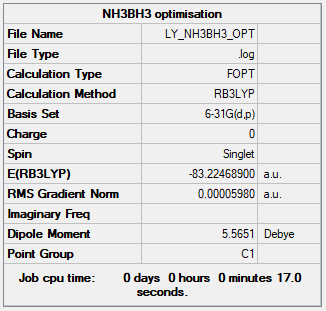
B3LYP/6-31G(d,p)
         Item               Value     Threshold  Converged?
 Maximum Force            0.000122     0.000450     YES
 RMS     Force            0.000058     0.000300     YES
 Maximum Displacement     0.000543     0.001800     YES
 RMS     Displacement     0.000297     0.001200     YES
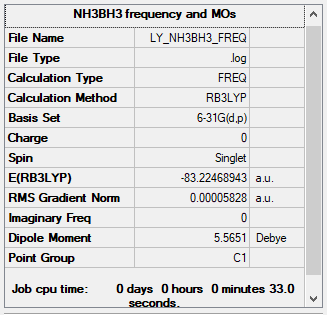
The total energy = -83.22468900 a.u.
Jmol image of NH3BH3:
NH3BH3 |
Frequency analysis of NH3BH3
Low frequencies ---    0.0009    0.0012    0.0013   14.2356   21.2737   40.8153
Low frequencies ---  266.3131  632.1811  639.4214
Frequency analysis file: Media:LY_NH3BH3_FREQ.LOG
Association Energy
E(BH3) = -26.61532350 a.u.
E(NH3) = -56.55776872 a.u.
E(NH3BH3) = -83.22468900 a.u.
ΔE = E(NH3BH3) - [E(BH3) + E(NH3)] = -83.22468900 - [-26.61532350 - 56.55776872] = -0.05159578 a.u. = -135.47 kJ/mol
Q1. Based on your energy calculation is the B-N dative bond weak, medium or strong? What comparison have you made to come to this conclusion?
B-N dative bond is weak, comparing to the bond energy of the bonds between Boron and other atoms, such as B-O (536 kJ/mol) and B-F (613 kJ/mol). Comparing to the covalent B-N bond's bond energy 378 kJ/mol, the dative bond is still weak, due to lower electron density in the bond.
Correct calculation and good comparisons to several relevant bonds. To improve, just consider the accuracy of the final reported energy values (and for the energies reported in your structure information) and literature values should be referenced! Otherwise, clear structure information and supporting files throughout. Smf115 (talk) 07:39, 30 May 2019 (BST)
NI3 Molecule
B3LYP/GEN
         Item               Value     Threshold  Converged?
 Maximum Force            0.000061     0.000450     YES
 RMS     Force            0.000037     0.000300     YES
 Maximum Displacement     0.000317     0.001800     YES
 RMS     Displacement     0.000235     0.001200     YES
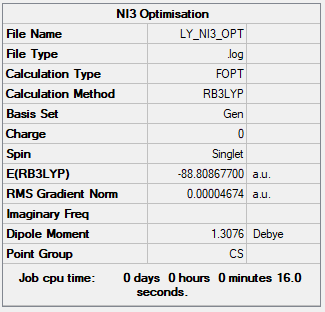
The total energy = -88.80867700 a.u.
Jmol image of NI3:
NI3 |
Frequency Analysis of NI3
Low frequencies ---  -22.8019  -22.7986  -19.9756   -0.0037    0.0040    0.0246
Low frequencies ---  101.7251  101.7253  153.3744
Frequency analysis file: Media:LY_NI3_FREQ.LOG
While the correct set up for the pseudopotential appears to have been done for the optimisation ('GEN' keyword in summary table) you haven't correctly implemented it in the frequency calculation. You should have again specified 'GEN' as the keyword in the job line and then edited in the full details of the basis set and pseudopotential required. Smf115 (talk) 07:27, 30 May 2019 (BST)
Optimised Bond Distance
The optimised bond distance between N-I = 2.184 Å
Mini Project: Ionic Liquids
[N(CH3)4]+ Cation
B3LYP/6-31G(d,p)
         Item               Value     Threshold  Converged?
 Maximum Force            0.000069     0.000450     YES
 RMS     Force            0.000017     0.000300     YES
 Maximum Displacement     0.000752     0.001800     YES
 RMS     Displacement     0.000236     0.001200     YES
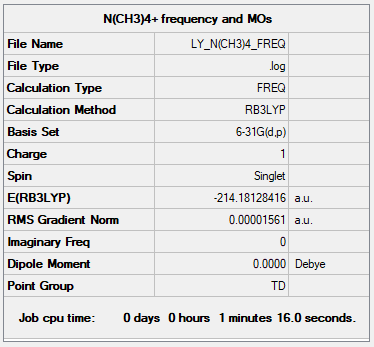
The total energy = -214.18127397 a.u.
Jmol image of [N(CH3)4]+:
[N(CH3)4]+ |
Frequencies Analysis of [N(CH3)4]+
Low frequencies ---   -0.0009   -0.0006   -0.0003   22.9947   22.9947   22.9947
Low frequencies ---  189.2288  293.0077  293.0077
Frequencies analysis file: Media:LY_N(CH3)4_FREQ.LOG
Charge Distribution
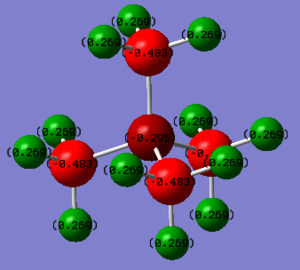
Charge of N = -0.295
Charge of C = -0.483
Charge of H = +0.269
The positive charge is completely distributed on H atoms. The negative charge is on N and C atoms, while C atoms have larger distribution of the charge than N. That is because C and N are more electronegative than H. In traditional way, the positive charge is drawn next to and located on the N atom since it is the centre of the molecule. However the charge distribution analysis indicates that the positive charge is distributed on H.
Range = -0.500 to 0.500
Your justification of the traditional formal charge picture isn't correct, to improve, consider formal electron counting and the Lewis structure of the cation. Smf115 (talk) 16:25, 30 May 2019 (BST)
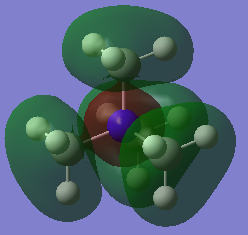
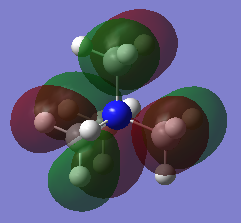
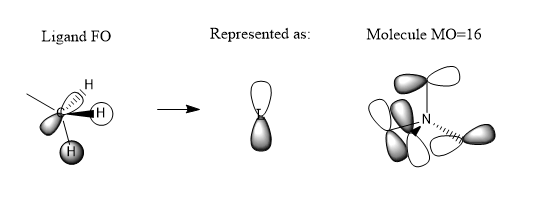
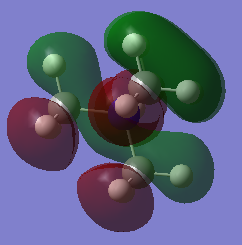
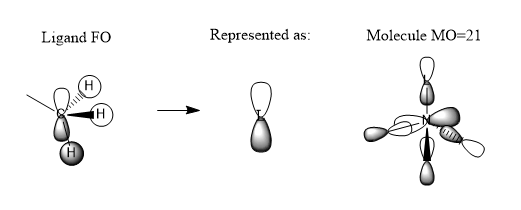
MOs
Very good construction of the FOs and corresponding LCAOs and nice to see three MOs chosen which have three different ligand FOs. Well presented and a good attempt at identifying the overall character of the MO, however, the second one is likely to be non-bonding. To improve, it would have been nice to see either some comparative comment of the bonding/antibonding ordering of the MOs selected and some identification of the main interactions present in the MOs.Smf115 (talk) 16:34, 30 May 2019 (BST)
[P(CH3)4]+ Cation
B3LYP/6-31G(d,p)
         Item               Value     Threshold  Converged?
 Maximum Force            0.000133     0.000450     YES
 RMS     Force            0.000033     0.000300     YES
 Maximum Displacement     0.000822     0.001800     YES
 RMS     Displacement     0.000346     0.001200     YES
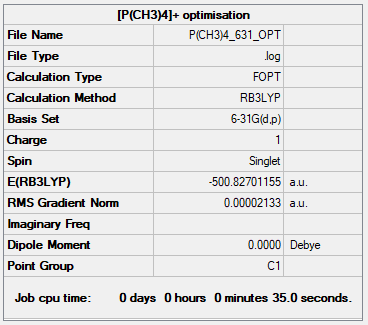
The total energy = -500.82701155 a.u.
Jmol image of [P(CH3)4]+:
[P(CH3)4]+ |
Frequency Analysis of [P(CH3)4]+
Low frequencies ---    0.0016    0.0017    0.0028   26.3395   26.3395   26.3395
Low frequencies ---  161.0408  195.5274  195.5274
Frequency analysis file: Media:LY_P(CH3)4_FREQ.LOG
Charge Distribution
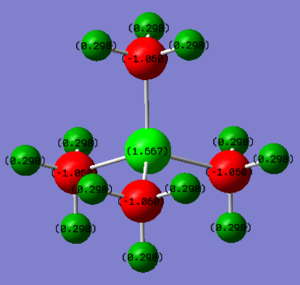
Charge of P = +1.667
Charge of C = -1.050
Charge of H = +0.298
The positive charge is mainly distributed on P atom and slightly on H atoms. The negative charge is on C atom. The behaviour is due to the lower electronegativity of P and H (P = H = 2.1) comparing to that of atom C (2.5).
Range = -0.500 to 0.500
Correct NBO charges which are clearly presented. You have selected the same colour range for both which is good but a larger range which contained the maximum +/- values should have been selected to properly display the charge distributions. The use of electronegativities to justify the charges is correct but you needed to analyse the distribution in a lot more depth and should have compared the two ILs. Smf115 (talk) 16:24, 30 May 2019 (BST)
Conclusion
The diversity of analysed complexes in this lab indicated that this calculation method could be widely used in many systems to visualise the optimised structure, properties and frequencies of many molecules for further information about the MOs and bond energies.
Overall, a good report with good structure calculations throughout. Smf115 (talk) 16:34, 30 May 2019 (BST)


