LouisaOHare
H + H2 System
Dynamics from the transition state region
The transition state is a maximum within the minimum energy channel of the reaction, meaning that at both the transition state and the minima of the reactants and of the products the total gradient is zero.
The curvature of the potential energy surface can be used to locate the minimum and the transition state by starting trajectories near to an estimated location of the transition state with no momentum, and seeing if they roll to the product channel or to the reactant channel. The transition state is between a starting point where they roll to the products and a starting point where they roll towards the reactants, which can be optimized by running many trajectories to find the most precise posistion of the transition state possible. The minima is then the point where it rolls to - the point of lowest potential energy.
Locating the transition state
The transition state was located at a bond distance of 0.91 Å
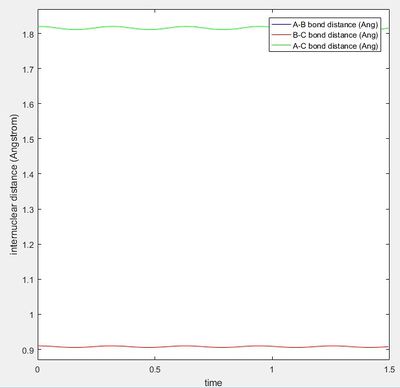
The graph of internuclear distance vs time, shows that at this distance there is almost no oscillation, showing that there is not change in the distance over time, as this point is balanced on the maxima and will stay there until displaced to either the reactant side or product side
 |
 |
Reaction path
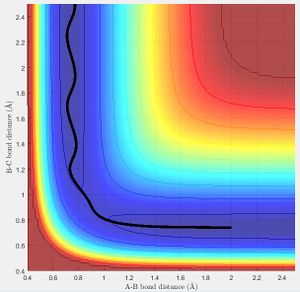
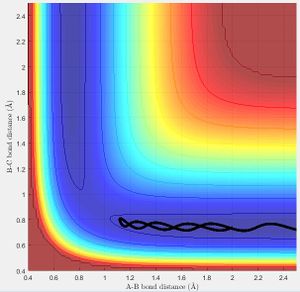
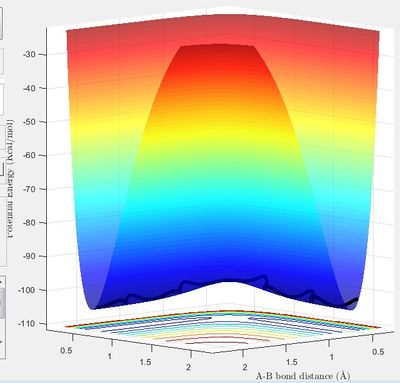
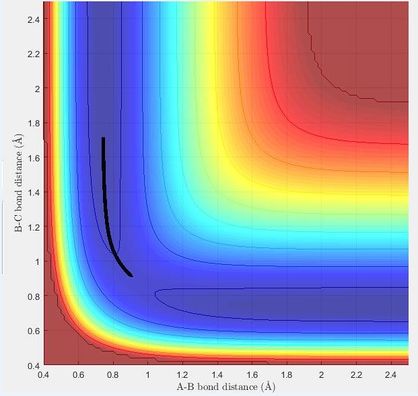
The minimum energy path (mep) shows the direction of the reaction starting from a point slightly displaced from the transition structure, either in the direction of the reactants or to the products. It only includes the translational energy while the dynamic calculation shows vibrational energy during the reaction as well as the translational energy. This can be seen by a surface plot of the two trajectories. In the mep the tajectory is a straight line, while in the dynamic trajectory it is a wave, showing the vibrational energy.
 |
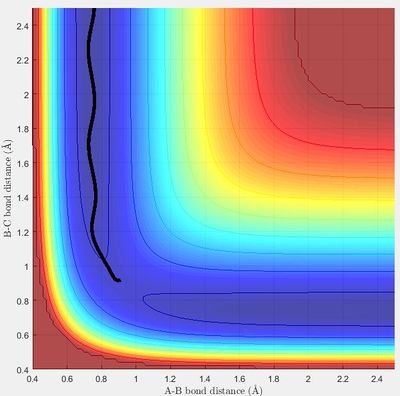 |
In the mep calculation, the velocity is set to zero for each time step. This means that many more steps need to be calculated to obtain the same length trajectory as for the dynamic calculation. It also means that there will be zero kinetic energy throughout, which the kinetic energy vs time graph shows. In the dynamic trajectory, the graph shows how the kinetic energy increases and then starts to oscillate. This shows the increase in kinetic energy as the trajectory moves away from the transition state, then the kinetic energy due to the vibration of the bond once it has been formed.
 |
 |
Reactive and unreactive trajectories
Transition state theory
The main assumptions of transitions state theory are that the trajectory will fit with classical mechanics, there is a transition state to the reaction which will have no interaction with any other transition states, and that any trajectory that reaches the transition
state with even a small amount of kinetic energy in the direction of the products will go onto react, and it is not then possible to recross over the transition state back to the products.
Experimentally it is seen that there needs to be a high enough value of translational and vibrational energy to result in a reactive trajectory, and the trajectory may cross back to the reactant channel after passing to the products. This is because other factors such as the orientation of the collision need to be taken into account, as not every collision results in a reaction. Also, when working with reactions involving light atoms such as the hydrogen atom, classical mechanism is unsuitable for describing the reaction dynamics. [1]
F - H - H System
PES inspection
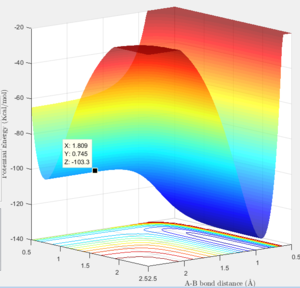
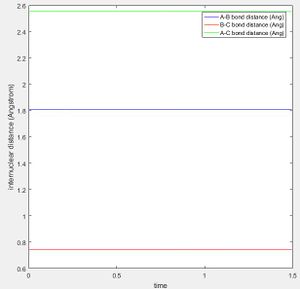
The reaction F + H2 is an exothermic reaction as HF bond being formed is a long stronger than the H2 bond which being broken, while the reverse reaction (H + HF) is endothermic, as more energy is put in to the reaction to break the HF bond than is released from the formation of H2. This is seen in the surface plot, where there is steep slope between the reactant and product channel, giving a downwards slope for the exothermic reaction and an upwards slope for the backwards reaction. The transition state is located with the F - H distance at 1.81 Å, and the H - H distance at 0.745 Å. This can be seen by the a graph of internuclear distance vs time for these distances, where there is no oscillation of distance over time.
 |
 |
Acitvation energy
F + H2
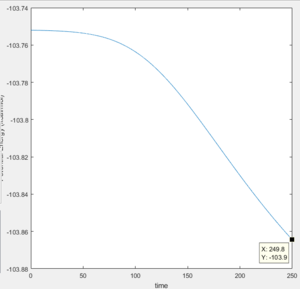
The energy at the transition state is -103.3 kcal/mol, and the energy at the minima to the reactant side is -103.9 kcal/mol, meaning that the activation energy of the reaction is 0.6 kcal/mol The minima can be found by starting at a point slightly off from the transition state and viewing the graph of potential energy vs time, to see the final value.
 |
 |
H + HF
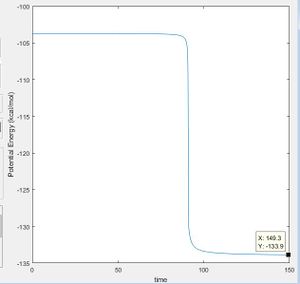
The energy at the transition state is -103.3 kcal/mol, and the energy at the minima to the reactant side (of this reverse reaction - the product side of the first reaction is -133.9 kcal/mol, meaning that the activation energy of the reaction is 30.6 kcal/mol
Reaction Dynamics
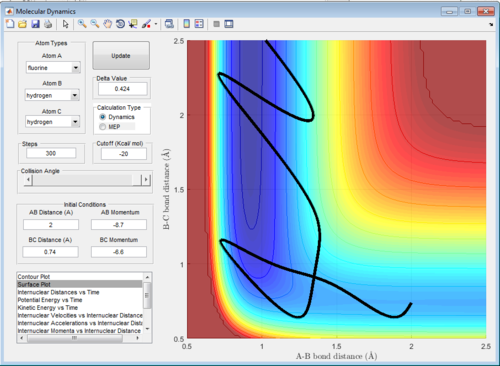
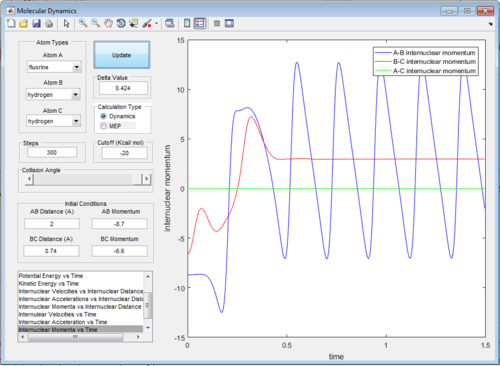
The energy released in reaction is converted into vibrational energy of the new bond which has been formed. This can be seen in a graph of internuclear momentum vs time, where a reactive trajectory, such as the one below, produces graph in which the oscillation of the new bond can be seen as the momentum begins to osciallate once the bond has been formed. This could be confirmed experimentally by calorimetry to see the heat released, or through the existence of overtones on an IR spectra.
 |
 |
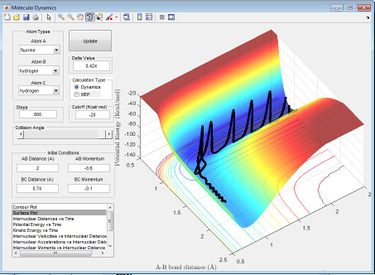
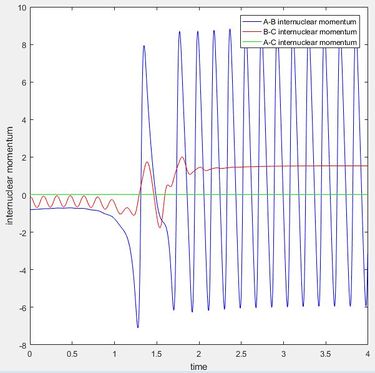
The effect that changing the vibrational or translation energy differs depending on the position of the transition state in the progress of the reaction. . According to the rules proposed by Polyani, in reactions which have an early-stage transition state (resembles the the reactants more than the products) the translational energy is a greater factor in producing a reactive trajectory than the vibrational energy, while for those with a late-stage transition state (resembles the products more) vibrational energy is a greater factor than translational energy.[2] This can be seen by running trajectories and changing the amount of translational and vibrational energy to see which produce reactive trajectories. The reaction F + H2 is exothermic and therefore has an early transition state, meaning the translational energy is more effective in increasing the efficacy of the reaction (the amount of trajectories that result in a reaction) than the vibrational energy. This is seen when adjusting the transaltional energy (pFH) and vibrational energy (pHH) and seeing the a reaction would occur. For example, setting pFH to -0.5 and pHH to -3 does not result in a reaction as there is more vibrational energy and not enough translational energy. If pFH is then increased to -0.8 and pHH is decreased to -0.1, there is a reaction, as now there is more translational energy which is needed for the reaction to occur. This can be seen in the internuclear momentum vs time graph, as there internuclear momentum of H-F ( A-B) increases and oscillates, showing that a bond has been formed.
 |
 |
 |
 |
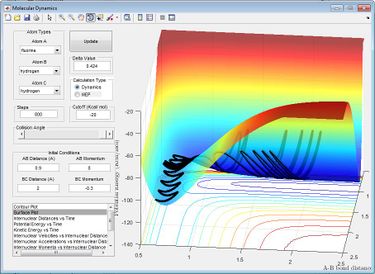
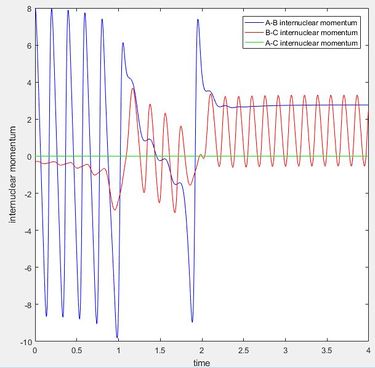
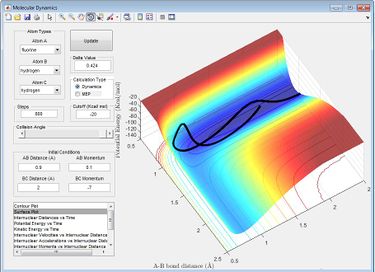
The reaction H + HF is endothermic so has a late transition state, meaning that vibrational energy is more effective in increasing the efficacy of the reaction than the translational energy. This can be seen by running a trajectory starting with H + HF reactants, with pFH to 8 and pHH to -0.3, so that it has a much greater proportion of vibrational energy of the HF bond compared to translational energy. This results in a reactive trajectory, with enough energy to overcome the activation barrier. This is shown in the graph of internuclear momentum vs time as a loss of oscillation of the H-F momentum (A-B momentum) as the H-F bond is broken and the start of oscillation in the H-H (B-C) internuclear momentum as the H-H bond forms. Decreasing the vibrational energy, (pHF = 0.1) and increasing the translational energy (pHH = -0.7) results in an uncreactive trajectory, as there is now not enough vibrational energy to overcome the activation barrier
 |
 |
 |
 |
References
- ↑ Pineda, J. R.; Schwartz, S. D. (2006). "Protein dynamics and catalysis: The problems of transition state theory and the subtlety of dynamic control". Phil. Trans. R. Soc. B. 361 (1472): 1433–1438. doi:10.1098/rstb.2006.1877
- ↑ Theoretical Study of the Validity of the Polanyi Rules for the Late-Barrier Cl + CHD3 Reaction Zhaojun Zhang, Yong Zhou, Dong H. Zhang, Gábor Czakó, and Joel M. Bowman The Journal of Physical Chemistry Letters 2012 3 (23), 3416-3419,DOI: 10.1021/jz301649w

