Leroy
Inorganic Computational Laboratory
Optimisation and Frequency Analysis of BH3
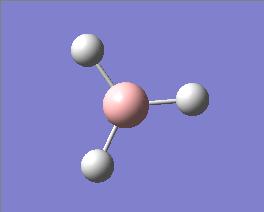
Gaussview 5.0 was used to draw the trigonal planar molecule of BH3. Prior to performing optimisation calculations upon this molecule, the B-H bond lengths were altered to 1.5 angstroms. Next a purely quantum mechanical optimisation calculation was performed, with the constraints of B3LYP calculation method and a 3-21G basis set.
The choice of basis set was chosen such that the accuracy was sufficiently precise for analysis, yet quick enough to be performed on a convenient timescale. 3-21G has a relatively low degree of accuracy and thus the calculation timescale is in the region of 30 seconds - a more complex basis set would lead to a subsequently longer calculation.
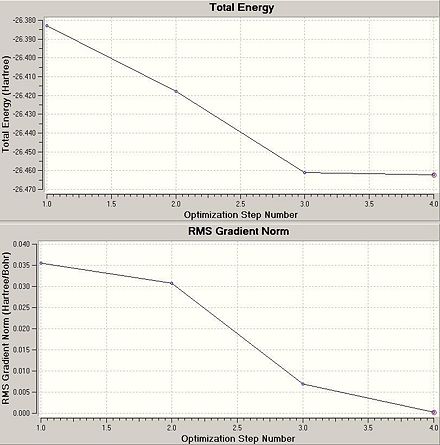
The following data was taken from analysis of the .log file:
| Optimisation Property | Value |
|---|---|
| H-B bond Length | 1.19 Å |
| H-B-H angle | 120.0o |
| File Type | .log |
| Calculation Type | FOPT |
| Calculation Method | RB3LYP |
| Basis Set | 3-21G |
| Final Energy | -26.46 a.u. |
| Gradient | 2.1x10⁻⁴ |
| Dipole Moment | 0.00 Debeye |
| Point Group | D3h |
| Calculation Time | 26 seconds |
Hartree atomic units are used which have a conversion factor[1]: 1 a.u. = 2630 kJ/mol. Thus, given that error for energy is roughly 10 kJ/mol, the error associated with the hartree atomic units is roughly 0.004 a.u.
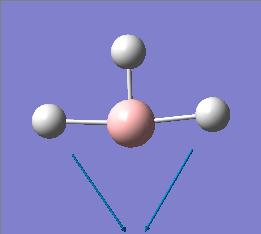
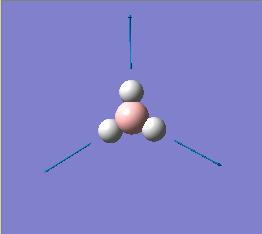
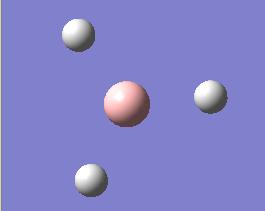
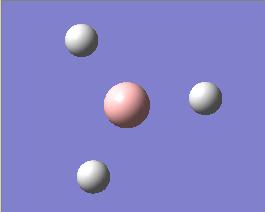
Energy graphs for the optimisation of the BH3 molecule were obtained. They were then compared to animated diagrams illustrating the four stages that arose during the optimisation calculation for BH3.
 |
 |
 |
 |
Gaussview calculates bonds based upon a distance criteria, this is evident by the optimisation stages that are depicted above.
Defining the existence of a chemical bond is a matter of debate. In my view, a chemical bond should be assigned when the atomic orbitals show constructive interference and become slightly distorted, indicating the presence of a molecular orbital - similar to that of the LCAO approach.
By taking the second derivative of the potential energy curve for the optimisation of BH3 it is possible to determine if the optimstion has been successful, since negative values indicate a maxima and subsequently positive values idicate a minima. This second derivation is effectively what a frequency analysis is.
In order to obtain comparible results from the frequency analysis of the fully optimised BH3 molecule, the constraints for frequency calculations were the same as used for the optimisation - B3LYP calculation method and a 3-21G basis set. In additon to this, key words of 'pop=(full,nbo)' were used in order to provide information relating to the MO of BH3.
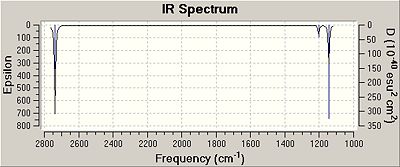
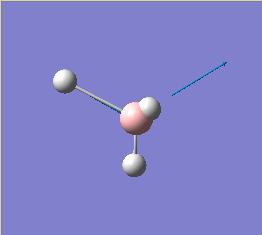
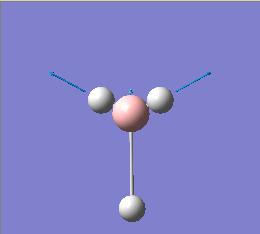
In addition to the IR spectrum, individual vibration frequencies could be analysed. As illustrated below.
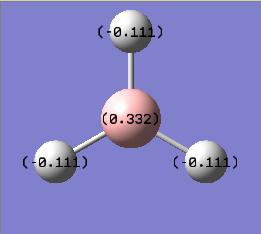
Since the key words 'pop=(full,nbo)' were used in the frequency analysis, a graphical represenatation of the Natural Bond Orbital Analysis could be made. This essential illustrates the effective charge density of each atom within the moelcule.
The resulting charges were as expected, with the Lewis defficient Boron atom exhibiting a positive charge of 0.33 Coulombs and subsequently the Hydrogen atoms each exhibiting a negative charge of -0.11 such that the overall dipole is 0 debeye.
 |
 |
Optimisation of BCl3
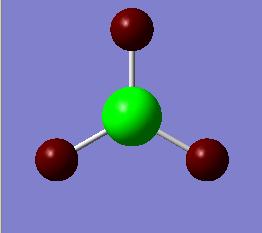
Gaussview 5.0 was used to draw the trigonal planar molecule of BCl3. Prior to performing optimisation calculations upon this molecule, the point group was restrained to its known symmetry of D3h. Next a purely quantum mechanical optimisation calculation was performed, with the constraints of a B3LYP method and a LanL2MB basis set.
LanL2MB basis set is a medium level basis set, and can be used for molecules which contain both first row and heavy elements. As previously discussed, a more technical basis set would result in a far longer calculation time.
The following data was taken from analysis of the .log file:
| Optimisation Property | Value | Lit. Value[2] |
|---|---|---|
| Cl-B bond Length | 1.87 Å | 1.74 Å |
| Cl-B-Cl angle | 120.0o | |
| File Type | .log | |
| Calculation Type | FOPT | |
| Calculation Method | RB3LYP | |
| Basis Set | LanL2MB | |
| Final Energy | -69.44 a.u. | |
| Gradient | 5.5x10⁻⁵ | |
| Dipole Moment | 0.00 Debeye | |
| Point Group | D3h | D3h |
| Calculation Time | 11 seconds |
Hartree atomic units are used which have a conversion factor[1]: 1 a.u. = 2630 kJ/mol. Thus, given that error for energy is roughly 10 kJ/mol, the error associated with the hartree atomic units is roughly 0.004 a.u.
Literature value for the B-Cl bond length is slightly different to that of the Gaussian approximation, however it is relatively close enough given the complexity of the basis set.
Eventhough there are highly electronegative chlorine atoms present in the molecule, the trigonal planar D3h symmetry of the molecule is such that the overall dipole moment for the molecule is 0 Debeye. This also supports the observation of the 120.0o Cl-B-Cl bond angle.
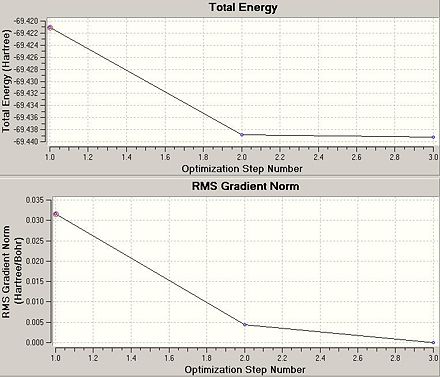
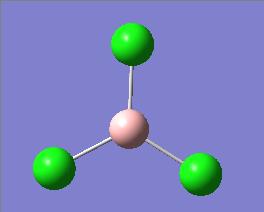
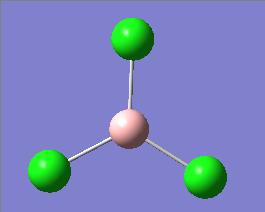
Energy graphs for the optimisation of the BCl3 molecule were obtained. It can be noted that there are only three stages involved in the optimisation calculation. By further analysis of the graphical representations for the optimisation calculation, it is evident that there are always 'chemical bonds' present - meaning that the heavy chlorine atom is always in close enough proximity to the boron atom such that there is a constructive interaction.
 |
 |
 |
By taking the second derivative of the potential energy curve for the optimisation of BCl3 it was possible to determine if the optimstion has been successful, since negative values indicate a maxima and subsequently positive values idicate a minima. This second derivation is effectively what a frequency analysis is.
In order to obtain comparible results from the frequency analysis of the fully optimised BH3 molecule, the constraints for frequency calculations were the same as used for the optimisation - B3LYP calculation method and a LanL2MB basis set.
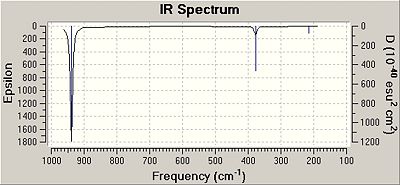
| Number of Vibration | Description of vibration | Frequency | Intensity | Symmetry of D3h point group |
|---|---|---|---|---|
| 1 | In plane asymmetric bending of all three chlorine atoms about the Boron centre. | 214.11 | 3.9 | E' |
| 2 | In plate symmetric bending of two of the chlorine atoms about the Boron centre. | 214.11 | 3.9 | E' |
| 3 | Out of plane symmetric banding of all three chlorine atoms about the Boron centre. | 377.31 | 43.8 | A'' |
| 4 | In plane symmetric stretching of all three chlorine atoms about the Boron centre. | 416.86 | 0.0 | A1' |
| 5 | In plane asymmetric stretching of two of the chlorine atoms about the Boron centre. | 938.47 | 258.7 | E' |
| 6 | In plane asymmetric stretching of all three chlorine atroms about the Boron cnetre. | 938.48 | 258.7 | E' |
Molecular Orbitals of BH3
Molecular orbital diagrams are very useful in determinig how a molecule may react and more specifically which orbitals will be involved. Other useful information such as triplet/singlet state and diamagnetism/paramagnetism can be deduced from a MO diagram.
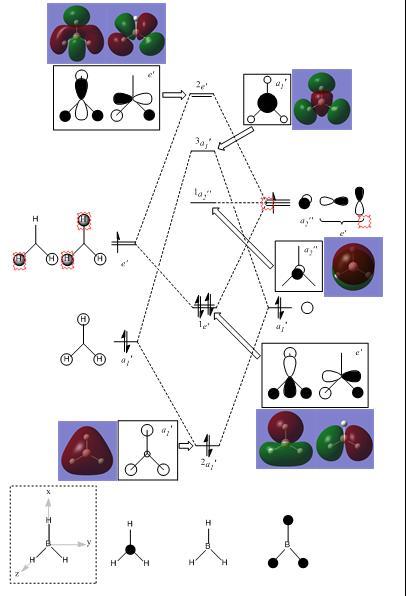
By altering caculation parameters upon BH3 from optimisation to energy, with the same B3YLP method and 3-21G Basis set for effective comparisons, it was possible to obtain graphical representations of the electron density of numerous molecular orbitals for the BH3 molecule such that an annotated MO diagram could be produced[3].
It can be noted that all of the graphical representations of the electron density for the molecular orbitals of BH3 are consistent with those that are theoretically expected, thus indicating a good optimisation and sufficiently precise calculation parameters.
chemical formula: https://www.ch.ic.ac.uk/wiki/index.php/Image:LUKE_BH3_POP.LOG
Isomers of Mo(CO)4(L)2
It is known that the IR spectra for the complex Mo(CO)4(L)2 shows charteristic absorption peaks for the cis and trans isomers, such that one band is expected for the trans isomer and four bands are expected for the cis isomer.
By performing calculations similar to that previously demonstrated with a method of B3LYP and a LANL2MB basis set, it was possible to obtain data relating to the optimised structures of cis-Mo(CO)4(PCl3)2 DOI:10042/to-4058 and trans-Mo(CO)4(PCl3)2 DOI:10042/to-4057 . Further calculations could also be performed in order to determine frequency analysis comparisons.
However upon analysis of the output files for these optimisations it became apparent that there were no P-Cl bonds present. This is due to an error in the Gaussview programme, since there are pre-defined bond lengths installed for each atom, indicating that the P-Cl bond length is longer and therefore weaker than normal when acting as a ligand in a transition metal complex with Molybdenum.
Also, given the relatively low complexity of the basis set used in the optimisation calculation, it is likely that the dihedral angle for the PCl3 ligands are not optimal such that the lowest energy for conformation is observed.
Thus the output file for the LANL2MB optimisation was modified so that the optimal geometry of the dihedral angles were exhibited and then the molcule was subjected to a more complex LANL2-DZ basis set, resulting in a more accurate approximation for the optimum energies for cis-Mo(CO)4(PCl3)2 DOI:10042/to-4060 and trans-Mo(CO)4(PCl3)2 DOI:10042/to-4059 .
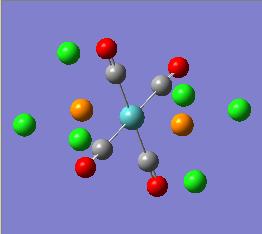
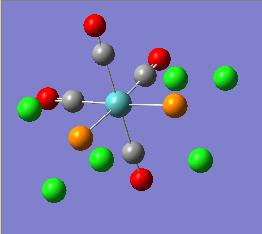
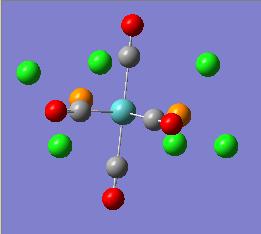
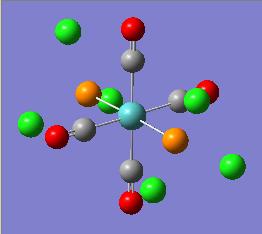
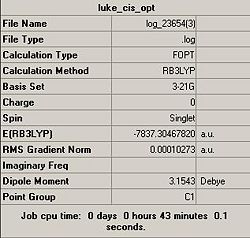
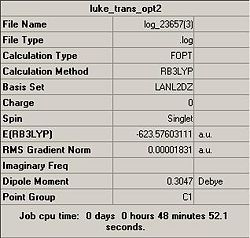
A summary of the calculations is shown below:
 |
 |
 |
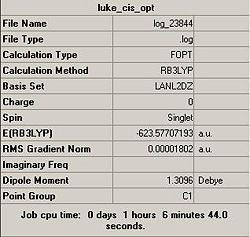 |
It can be noted by comparison of the summary for the optimisation calculations, that there is one obvious anomoly. That being I accidently used a 3-21G basis set for the initial optimisation of the cis isomer, this is a very basic and higly inaccurate basis set when used with heavy atoms and consequently rediculous figures have resulted from the calculation.
However, by comparison of the LANL2-DZ, it can be deduced that the cis-isomer is the energetically most stable conformation. With an optimum energy difference of 0.00104082 a.u. = 2.7 kJ/mol.
This is a suprising outcome, since I would have expected the large steric bulk of the PCl3 groups to cause formation of the cis-isomer to be energetically unfavourable. Meaning the trans-isomer would be the most thermodynamically stable isomer.
However, Cl groups are small and thus maybe the sterics are overcome. If a more bulky substitiuent were to be used, maybe the trans-isomer would show more stability.
Frequency Analysis of Mo(CO)4(L)2
Frequency analysis of the cis-Mo(CO)4(PCl3)2 DOI:10042/to-4074 and trans-Mo(CO)4(PCl3)2 DOI:10042/to-4075 complexes were conducted in order to compare the approximations with that of literature. Recalling that literature exhibits four carbonyl absorption bands for the cis-isomer and one carbonyl absorption band for the trans-isomer.
In order to do this, the basis set and calculation methods that were previously used for the optimisation were retained - B3LYP and LANL2-DZ. Key words were also retained in order for the calculation to converge - 'int=utrafine scf=conver=9'.
As previously mentioned, the frequency analysis calculation is effectively a second derivative of the Potential energy curve for the optimisation of the complexes, and thus the values obtained should all be positive to reflect the presence of a minima.
Comparisons of the Carbonyl frequency analysis:


| Calculated Frequency (cm-1) | Intensity | Literature[4] Frequency (cm-1) |
|---|---|---|
| 1945 | 762.39 | 1986 |
| 1949 | 1499.02 | 1994 |
| 1958 | 633.38 | 2004 |
| 2023 | 597.16 | 2072 |
| Calculated Frequency (cm-1) | Intensity | Literature[4] Frequency (cm-1) |
|---|---|---|
| 1950 | 1475.40 | 1896 |
| 1951 | 1466.78 | 1896 |
By analysis of the tables for the carbonyl vibrational frequencies, it can be concluded that the approximations are consistent with that theoretically expected by literature. Such that there are four bands present for the cis-isomer and one band present for the trans-isomer
Although there are two apparent carbonyl vibrational frequencies for the trans-isomer, a closer inspection reveals that they are in fact degenaerate asymmetric stretching frequencies for two carbonyls 1 & 3/carbonyls 2 & 4.
References and Citations
- ↑ 1.0 1.1 COMMON CONVERSION FACTORS IN COMPUTATIONAL CHEMISTRY {(http://www.chem.arizona.edu/courseweb/074/CHEM5181/conversions.htm )}
- ↑ STRUCTURE OF FREE MOLECULES IN THE GAS PHASE {(http://www.hbcpnetbase.com//articles/09_02_90.pdf#xml=http://www.hbcpnetbase.com/search/pdfHits.asp?id=09_02_90&DocId=115997&hitCount=51&hits=18362+18361+18066+17441+17174+16854+16206+15757+15679+15639+15101+15002+14606+14517+14441+14396+14309+14274+13674+12871+12508+12192+11511+11022+10956+10505+10354+10082+9629+8821+8189+8043+7784+7623+7074+6447+5874+5301+4780+4664+4117+3466+2833+2230+1591+1081+789+657+636+65+39+ )}
- ↑ MO diagram tutorial problem {(http://www.ch.ic.ac.uk/hunt/teaching/teaching_MOs_year2/L3_Tut_MO_diagram_BH3.pdf )}
- ↑ 4.0 4.1 Vibrational spectra and Bonding in metal Carbonyls {(http://pubs.acs.org/doi/pdf/10.1021/ic50015a024)}


