LUT1234
This is a year 1 project for the Molecular Modelling 2 course
NH3 Model
Optimisation
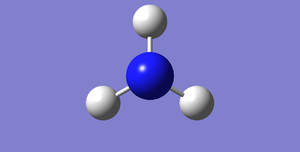
The following information was obtained when a molecule of NH3 was optimised in Gaussview. It was run in order to find the final energy of the molecule and the bond angles/lengths of the minimised structure.
| Information | Data |
|---|---|
| Molecule | NH3 |
| Calculation Method | B3LYP |
| Basis Set | 6-31G(d,p) |
| Final Energy (a.u.) | -56.55776762 |
| RMS Gradient | 0.00032440 |
| Point Group of Molecule | C3V |
| Bond Lengths (Å) | 1.01798 |
| Bond Angle (Degrees) | 105.741 |
The optimisation went to completion as the values below went below the threshold. This means that the lines converged on zero.
| Item | Value |
|---|---|
| Maximum Force | 0.000004 |
| RMS Force | 0.000004 |
| Maximum Displacement | 0.000072 |
| RMS Displacement | 0.000035 |
Images of the optimised molecule
The images of the optimised NH3 can be seen below. The first image can be rotated and the data that leads to this image can be found in the link below.
NH3 molecule |
The optimisation file is linked here

Questions on the vibrational mode of the NH3 molecule
This section answers the questions raised in the lab script and adresses the reason as to why the charges on the N and H atoms differ.
| Question | Answer |
|---|---|
| How many nodes do you expect from the 3N-6 rule? | From this rule, and the fact we have 4 atoms, we would expect 6 vibrational modes. |
| Which modes are degenerate (ie have the same energy)? | The modes that are degenerate have the same energy. These are due to the fact that these are in fact the same vibrations, but using a different pairing of hydrogen's. |
| Which modes are "bending" vibrations and which are "bond stretch" vibrations? | 1, 2 and 3 are due to bending and 4, 5 and 6 are due to stretching. |
| Which mode is highly symmetric? | Number 4 is highly symmetric |
| One mode is known as the "umbrella" mode, which one is this? | Number 1 is the umbrella mode |
| How many bands would you expect to see in an experimental spectrum of gaseous ammonia? | 2 bands. The other 2 bands have such a small peak that they would not be seen |
| Atom | Charge | Expectations |
|---|---|---|
| N | -1.125 | The expectation would be for the nitrogen atom to have a slight negative charge attached to it. This is because it is more electronegative than the hydrogen atoms. |
| H | 0.375 | The expectation would be for the hydrogen atoms to have a slight positive charge attached to them. This is because they are less electronegative than the nitrogen atom. This charge would have a third of the value of the nitrogen atom as it is a neutral molecule overall. |
N2 molecule
The following information was obtained when a molecule of N2 was optimised in Gaussview. The molecule was optimised in order to make sure that the molecule was in a global minima.
| Information | Data |
|---|---|
| Molecule | N2 |
| Calculation Method | B3LYP |
| Basis Set | 6-31G(d,p) |
| Final Energy (a.u.) | -109.52359111 |
| RMS Gradient | 0.02473091 |
| Point Group of Molecule | D*H |
| Bond Lengths (Å) | 1.09200 |
The optimisation went to completion as the values below went below the threshold. This means that the lines converged on zero.
| Item | Value |
|---|---|
| Maximum Force | 0.000001 |
| RMS Force | 0.000001 |
| Maximum Displacement | 0.000000 |
| RMS Displacement | 0.000000 |
| Mode | Frequency |
|---|---|
| 1 | 2457.33 |
Images of the optimised N2 molecule
The images below show the optimised N2 molecule. The first model is in three dimensions so can be manually rotated. However, this image only appears to have one bond, whereas the static image shows three. The link to the file is provided.
N2 molecule |
The optimisation file is linked here
Charges and Vibrational modes
There are no charges on this molecule as they are the same atom, so same electronegativity. This means that only one vibrational mode would be expected. This is proven to be the case by by the prediction given by the program shown below.

This shows however, that this vibrational mode would not appear on an infra-red spectrum as it has minimal signal strength.
Molecular Orbitals
The diagrams below show the pi and sigma molecular bonding orbitals in an N2 molecule. These are a combination of the 2p atomic orbitals. There are no visible distortions in the molecular orbitals. This is due to the fact that both atoms have the same electronegativity as they are the same element, and so the electon cloud will be evenly distributed between the two.


H2 molecule
Images of the optimised H2 molecule
The following information was obtained when a molecule of H2 was optimised in Gaussview. This was done in order to find the global minimum for the energy of the molecule.
| Information | Data |
|---|---|
| Molecule | H2 |
| Calculation Method | B3LYP |
| Basis Set | 6-31G(d,p) |
| Final Energy (a.u.) | -1.17853936 |
| RMS Gradient | 0.00000017 |
| Point Group of Molecule | D*H |
| Bond Lengths (Å) | 0.74279 |
The optimisation went to completion as the values below went below the threshold. This means that the lines converged on zero.
| Item | Value |
|---|---|
| Maximum Force | 0.000000 |
| RMS Force | 0.000000 |
| Maximum Displacement | 0.000000 |
| RMS Displacement | 0.000001 |
Vibrational Modes
The only vibration in an H2 molecule is shown below. Only one would be expected but due to its very low signal output, this would not show up on an infra-red spectrum.

| Mode | Frequency |
|---|---|
| 1 | 4465.68 |
Images of optimised H2 molecule
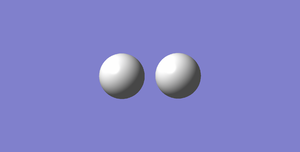
The following images were produced from the optimisation. These images have the correct bond length and the file used to create these images has been linked.
H2 molecule |
The optimisation file is linked here
Charges on individual atoms of the molecule
There are no charges on this molecule as they are the same atom, so they same electronegativity and will not distort the electron cloud.
Haber - Bosch process
Enthalpy of Reaction
| Bond type | Number of Molecules | Energy of bonds |
|---|---|---|
| NH3 | 2 | -113.11553524 |
| N2 | 1 | -109.52359111 |
| H2 | 3 | -3.53561808 |
Therefore, the overall energy of the reaction = -0.05632605 Au
And so in kJ = -147.884044275 kJ mol-1
Therefore ammonia is more stable than hydrogen and nitrogen gas.
Carbon Monoxide
Optimisation of CO molecule
The following information was obtained when a molecule of CO was optimised in Gaussview. It was optimised so that the bond energy and length would be correct.
| Information | Data |
|---|---|
| Molecule | CO |
| Calculation Method | B3LYP |
| Basis Set | 6-31G(D,P) |
| Final Energy (a.u.) | -113.30945314 |
| RMS Gradient | 0.00001828 |
| Bond Lengths (Å) | 1.13793 |
| Point Group | C*V |
The optimisation went to completion as the values below went below the threshold. This means that the lines converged on zero.
| Item | Value |
|---|---|
| Maximum Force | 0.000032 |
| RMS Force | 0.000032 |
| Maximum Displacement | 0.000011 |
| RMS Displacement | 0.000018 |
Images of Optimised molecule
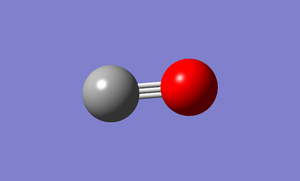
The images of the optimised carbon monoxide molecule have been placed below along with the raw data file.
CO molecule |
The optimisation file is linked here
Vibrational Modes
Only one form of vibrational mode will be present in a carbon monoxide molecule. This will be visible on an infra-red spectrum. The predictions that the programme makes for this vibrational mode can be seen below.

Charge distribution
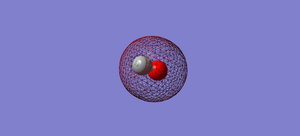
The carbon monoxide molecule will have an uneven charge distribution on the oxygen and carbon atoms due to the fact that the oxygen atom is more electronegative than the carbon atom. This will cause the electron cloud to be distorted so that the electrons are more likely to be found around the oxygen atom.

Molecular Orbital diagrams for carbon monoxide
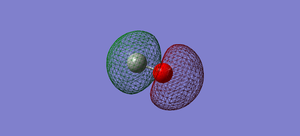
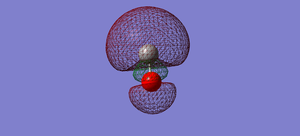
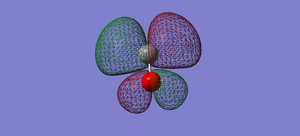
The molecular orbitals in a molecule of carbon monoxide will be distorted by this difference in electronegativity. The following molecular orbitals show this. These diagrams are the programmes predictions for the effect on different molecular orbitals;

Further molecular orbital diagrams
As the size of the molecular orbitals became larger, the distortion on the molecular orbitals become more pronounced. As further research into this, the molecular orbitals for higher interactions were plotted.


