Kk4717compy2inorg
Year 2 Inorganic computational lab
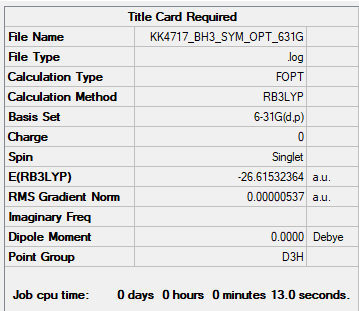
BH3
B3LYP/6-31G(d,p)
          Item               Value     Threshold  Converged?
 Maximum Force            0.000011     0.000450     YES
 RMS     Force            0.000007     0.000300     YES
 Maximum Displacement     0.000043     0.001800     YES
 RMS     Displacement     0.000028     0.001200     YES
Frequency file: bh3_frequency.log
 Low frequencies ---   -7.5936   -1.5614   -0.0054    0.6514    6.9319    7.1055
 Low frequencies --- 1162.9677 1213.1634 1213.1661
Figure 1. BH3 molecule |
Vibrational spectrum for BH3
| Wavenumber (cm-1) | Intensity (arbitrary units) | Symmetry | IR active? | Type |
| 1163 | 93 | A"2 | Yes | Out-of-plane bend |
| 1213 | 14 | E' | Very slight | In-plane bend |
| 1213 | 14 | E' | Very slight | In-plane bend |
| 2582 | 0 | A'1 | no | Totally symmetric stretch |
| 2716 | 126 | E' | Weak | Asymmetric stretch |
| 2716 | 126 | E' | Weak | Asymmetric stretch |

On the IR spectrum of BH3, only three peaks are observed. This is because out of the six vibrations only five cause a change in dipole and are therefore IR active. The sixth, at 2582 cm-1, is symmetrical and non IR active.
From the five visible peaks two pairs have the same vibrational energy and therefore also vibrate at the same frequency. This results in only observing three distinctive peaks on the IR spectrum: one stretch and two bends.
Molecular Orbitals
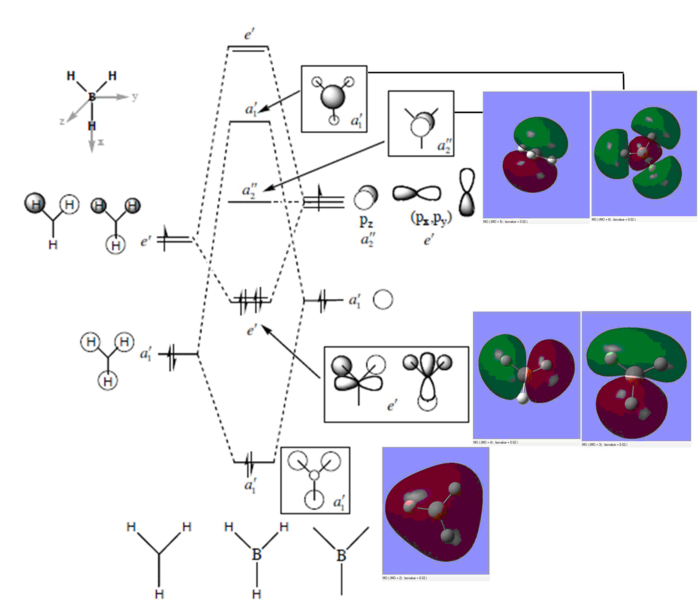
Ng611 (talk) 16:24, 5 June 2019 (BST) You're missing your e' orbitals.
Judging from the BH3 Molecular Diagram provided by Professor Hunt, the LCAO MOs give a rough representation of the real MOs, but it doesn't predict the shapes correctly. The real molecular orbital shapes are different from those LCAO predicts due to interactions between the atomic orbitals.
Using LCAO as a tool is very useful but one needs to be especially cautious when representing higher molecular orbitals that have complex interactions between the atomic orbitals.
NH3BH3
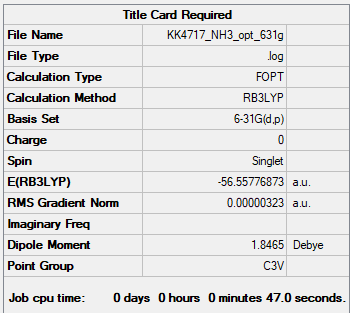
NH3 B3LYP/6-31G(d,p)
Item               Value     Threshold  Converged?
 Maximum Force            0.000006     0.000450     YES
 RMS     Force            0.000004     0.000300     YES
 Maximum Displacement     0.000012     0.001800     YES
 RMS     Displacement     0.000008     0.001200     YES
Frequency file: nh3_frequency.log
 Low frequencies ---   -8.5646   -8.5588   -0.0041    0.0455    0.1784   26.4183
 Low frequencies --- 1089.7603 1694.1865 1694.1865
Figure 4. NH3 molecule |
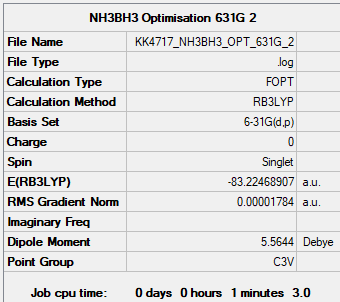
NH3BH3 B3LYP/6-31G(d,p)
 Item               Value     Threshold  Converged?
 Maximum Force            0.000044     0.000450     YES
 RMS     Force            0.000014     0.000300     YES
 Maximum Displacement     0.000405     0.001800     YES
 RMS     Displacement     0.000129     0.001200     YES
Frequency file: nh3bh3_frequency.log
 Low frequencies ---   -0.1066   -0.0697   -0.0073   15.5156   15.5300   19.3320
 Low frequencies ---  263.8240  632.6555  639.3404
Figure 5. NH3BH3 molecule. |
| Species | Energy (AU) | Energy (kJ/mol) |
| E(BH3) | -26.61532 | |
| E(NH3) | -56.55777 | |
| E(NH3BH3) | -83.22469 | |
| ΔE=E(NH3BH3)-[E(NH3)+E(BH3)] | -0.0516 | -135 |
The N-B bond strength (-135 kJ/mol) is relatively weak compared to other covalent bonds like N-C (305 kJ/mol) or N-N (167 kJ/mol). (Chemistry Libretexts accessed: https://chem.libretexts.org/Courses/University_of_Missouri/MU%3A__1330H_(Keller)/08._Basic_Concepts_of_Chemical_Bonding/8.8%3A_Strength_of_Covalent_Bonds, 24.05.2019).
Ng611 (talk) 16:26, 5 June 2019 (BST) Good calculation. Consider using a book source though, rather than a website.
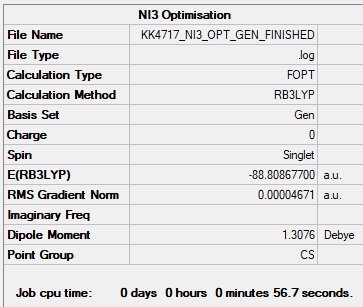
NI3
B3LYP/6-31G(d,p)
          Item               Value     Threshold  Converged?
 Maximum Force            0.000011     0.000450     YES
 RMS     Force            0.000007     0.000300     YES
 Maximum Displacement     0.000043     0.001800     YES
 RMS     Displacement     0.000028     0.001200     YES
B3LYP/6-31G(d,p)LANL2DZ NI3
          Item               Value     Threshold  Converged?
 Maximum Force            0.000061     0.000450     YES
 RMS     Force            0.000037     0.000300     YES
 Maximum Displacement     0.000459     0.001800     YES
 RMS     Displacement     0.000285     0.001200     YES
Frequency file: NI3_frequency.log
 Low frequencies ---   -5.5587   -5.4901    0.0002    0.0003    0.0004    6.5130
 Low frequencies ---  101.1565  101.2827  148.4562
Optimised N-I distance is 2.184 Å.
Figure 6. NI3 molecule. |
Ionic liquids
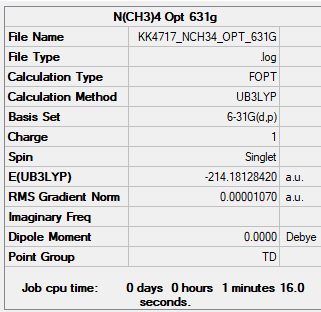
N(CH3)4
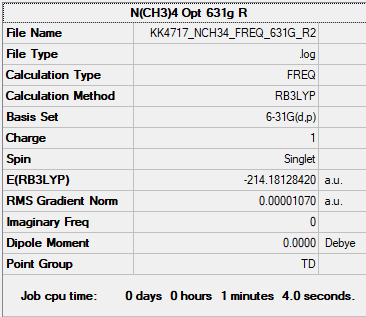
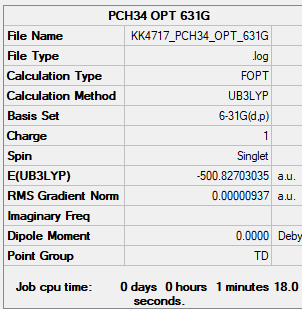
For both N(CH3)4 and P(CH3)4 optimisation was done with unrestricted and restricted B3LYP/6-31G(d,p). Unrestricted gives the calculation another degree of freedom that the spins in the same orbital don't have to be degenerate often resulting in a lower optimised energy than with restricted. However this contradicts quantisation and is therefore physically impossible and therefore restricted is usually the preferred method for optimisation.
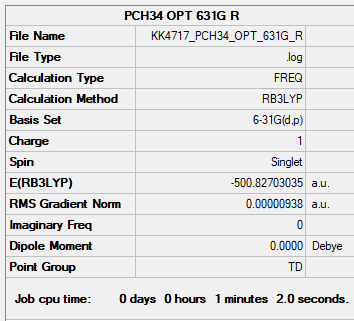
In this case the energies for both methods were the same, contrary to what was expected. Restricted method also gave slightly different low frequencies. Both optimisation results are given for both molecules.
Unrestricted
B3LYP/6-31G(d,p)
         Item               Value     Threshold  Converged?
 Maximum Force            0.000020     0.000450     YES
 RMS     Force            0.000008     0.000300     YES
 Maximum Displacement     0.000043     0.001800     YES
 RMS     Displacement     0.000023     0.001200     YES
Frequency file: NCH34_frequency.log
 Low frequencies ---    0.0006    0.0010    0.0011   34.8378   34.8378   34.8378
 Low frequencies ---  217.4637  316.5664  316.5664
Restricted
B3LYP/6-31G(d,p) Restricted
        Item               Value     Threshold  Converged?
 Maximum Force            0.000020     0.000450     YES
 RMS     Force            0.000008     0.000300     YES
 Maximum Displacement     0.000046     0.001800     YES
 RMS     Displacement     0.000023     0.001200     YES
Frequency file: NCH34_frequency_restricted.log
 Low frequencies ---   -0.0014   -0.0014   -0.0013   21.9732   21.9732   21.9732
 Low frequencies ---  189.1931  293.0643  293.0643
P(CH3)4
Unrestricted
B3LYP/6-31G(d,p)
        Item               Value     Threshold  Converged?
 Maximum Force            0.000045     0.000450     YES
 RMS     Force            0.000013     0.000300     YES
 Maximum Displacement     0.000234     0.001800     YES
 RMS     Displacement     0.000144     0.001200     YES
Frequency file: PCH34_frequency.log
 Low frequencies ---   -0.0019   -0.0016   -0.0016   50.3137   50.3137   50.3137
 Low frequencies ---  185.6718  210.7297  210.7297
Restricted
B3LYP/6-31G(d,p) Restricted
        Item               Value     Threshold  Converged?
 Maximum Force            0.000045     0.000450     YES
 RMS     Force            0.000013     0.000300     YES
 Maximum Displacement     0.000230     0.001800     YES
 RMS     Displacement     0.000141     0.001200     YES
Frequency file: PCH34_frequency.log
 Low frequencies ---   -0.0021    0.0014    0.0019   24.1090   24.1090   24.1090
 Low frequencies ---  159.8024  194.6110  194.6110
Charges and MOs
Charges

-
Figure 8a. N[CH3]4 Charge graph with colour representing the charge.
-
Figure 8b. N[CH3]4 Charge graph with number representing the charge.
-
Figure 8c. P[CH3]4 Charge graph with colour representing the charge.
-
Figure 8d. P[CH3]4 Charge graph with number representing the charge.
| Species | Central Atom (N or P) | Carbon | Hydrogen |
| N(CH3)4 | -0.295 | -0.483 | 0.269 |
| P(CH3)4 | 1.667 | -1.060 | 0.298 |
Even though formally nitrogen atom in N[CH3]4 has a positive charge, in reality it is slightly negatively charged. Nitrogen is more electronegative than carbon and therefore it pulls electron density away from carbon making the carbon less negatively charged as well. This is due to nitrogen having more protons and the same number of orbitals as carbon. The positive charge on this molecule is located on the low electronegative hydrogens.
Ng611 (talk) 16:32, 5 June 2019 (BST) Good, consider also the effect of symmetry.
With P[CH3]4, the negative charge on carbon is higher than that of in N[CH3]4. This is because phosphorous, even though having higher number of protons in the nucleus, has a lower electronegativity due to extra orbitals 3s and 3p. In this case, carbon with higher electronegativity pulls electrons away from phosphorous atom making it positively charged. Carbon itself is negatively charged due to that.
Ng611 (talk) 16:32, 5 June 2019 (BST) What about the differences between the calculated orbitals and the formal charge picture? You mention them but don't discuss why they come about.
Molecular Orbitals

-
Figure 10a. N[CH3]4 Molecular orbital 21 (HOMO).
-
Figure 10b. N[CH3]4 Molecular orbital 17.
-
Figure 10c. N[CH3]4 Molecular orbital 14.
In the HOMO, molecular orbital 21 (E = -0.57934) (Figure 10a) of N[CH3]4 the five nodes cut through all carbon and the centran nitrogen atom increasing the overall energy of the molecule. However, the interactions in this molecular orbital are mainly mediated through molecule increasing the electron density in this molecule is along the bonds stabilising them. Overall the antibonding interactions reduces the bonding character and causes the orbital to be only weakly bonding. This orbital is also triply degenerate with molecular orbitals 19 and 20.
Molecular orbital 17 (E = -0.58034) (Figure 10b) is degenerate with orbitals 16 and 18. The strongest interactions in this orbital are between carbon p orbitals and two out of three hydrogens bonded to each of them. These are really close together and therefore cause strong stabilisation. Between the hydrogens that bond to the central carbon, there is a spacial antibonding character on the same plane as the carbon's bonding p orbital extending the node. There are also antibonding interactions between hydrogen s-orbitals of different phases bonded to different carbons. However, these interactions are weak as the distance between this destabilising interaction is high.
Molecular orbital 14 (E = -0.62247) (Figure 10c) is doubly degenerate with orbital 15. This orbital is different from the other two represented here because instead of radial nodes it has a two angular nodes centered around the nitrogen atom and cutting through the carbon atoms and N-C bonds. These destabilising interactions are countered by positive overlap between carbon p and hydrogen s orbitals. Opposite to MO 17, hydrogens in this molecular orbital have stabilising spacial interactions between protons bonded to different carbons. These are observed in three planes, the outer out-of-phase interactions being stronger than the middle in-phase one due to the relative distance between the same-phase hydrogens.
Ng611 (talk) 16:35, 5 June 2019 (BST) Good analysis. I'd label the key interactions on the LCAO diagram itself rather than write a paragraph underneath.

![Figure 8a. N[CH3]4 Charge graph with colour representing the charge.](/images/thumb/9/94/KK4717_NCH34_Charge_Colour.PNG/345px-KK4717_NCH34_Charge_Colour.PNG)
![Figure 8b. N[CH3]4 Charge graph with number representing the charge.](/images/thumb/4/4c/KK4717_NCH34_Charge_Value.PNG/340px-KK4717_NCH34_Charge_Value.PNG)
![Figure 8c. P[CH3]4 Charge graph with colour representing the charge.](/images/thumb/3/3f/KK4717_PCH34_Charge_Colour.PNG/305px-KK4717_PCH34_Charge_Colour.PNG)
![Figure 8d. P[CH3]4 Charge graph with number representing the charge.](/images/thumb/0/04/KK4717_PCH34_Charge_Value.PNG/337px-KK4717_PCH34_Charge_Value.PNG)
![Figure 10a. N[CH3]4 Molecular orbital 21 (HOMO).](/images/thumb/b/b0/KK4717_NCH34_MO21.PNG/341px-KK4717_NCH34_MO21.PNG)
![Figure 10b. N[CH3]4 Molecular orbital 17.](/images/thumb/c/c8/KK4717_NCH34_MO17.PNG/343px-KK4717_NCH34_MO17.PNG)
![Figure 10c. N[CH3]4 Molecular orbital 14.](/images/thumb/f/fb/KK4717_NCH34_MO14.PNG/338px-KK4717_NCH34_MO14.PNG)