Kjo3118
The answers to the highlighted questions have been underlined.
EXERCISE 1: H+H2

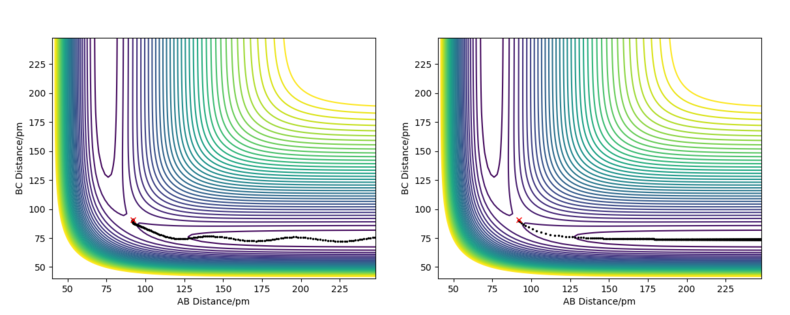
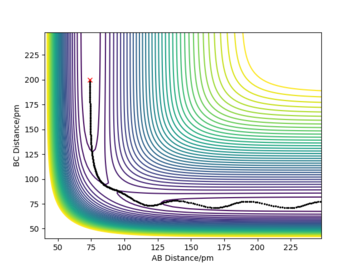
In this exercise, a system comprised of only hydrogen atoms has been used. First the transition state has been located. The transition state is at a saddle point on the potential energy surface, so it is a maximum along the reaction coordinate, but a minimum in the orthogonal direction. In this case both partial derivatives of the potential with respect to RAB and RBC are equal to 0. To distinguish a saddle ponit from a local minimum (which would also have both first derivatives equal to 0), you would have to take a look at the second derivatives: at a saddle ponit (TS) one would be positive and one would be negative; at a local minimum both second derivatives would be positive. To locate the position of the transition state first a consideration of geometry was made: since the system is totally symmetric, the transition state is also symmetric and so RAB=RBC . My best estimate is 90.77 pm. For RAB(0)=RBC(0)=90.77 pm and both initial momenta equal to zero the molecule oscillates so little from the initial position that the internuclear diatances remain almost constant (Figure 1.), for these conditions the initial forces are very close to 0 (both 0.001 kJ.mol-1.pm-1).
Good description. Remember to always state partial derivative not just derivative. Good estimate and description on the location of the transition state Sf3014 (talk) 20:37, 24 May 2020 (BST)
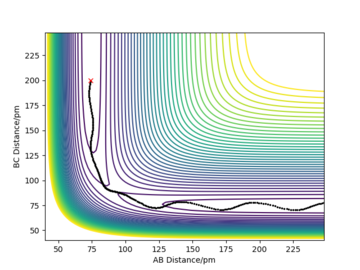
Figure 2 shows the reaction path genereated using the MEP calculation type as well as the trajectory genareted using the dynamic calculation. In this specific case they are very simmilar, the only difference is that the mep trajcetory just follows the valley of lowest potential, with not vibrational energy, as the total kinetic energy is set to 0 at each step, wheras the dynamically generated trajectory also includes vibrational osscillations.
Good but who do you know that the kinetic energy is set to zero? Your presented evidence does not show this. Sf3014 (talk) 20:44, 24 May 2020 (BST)
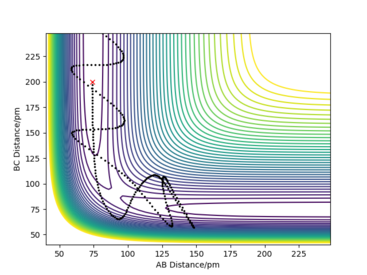
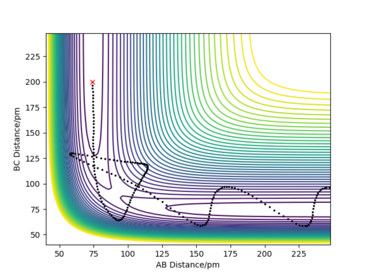
From the table you can conclude that barrier re-crossing can take place and that not all collisions with energy larger than the activation energy will result in a sucessfull collision. Meaning that the system can pass through the transition state to form the products, but then go back to reform the reactants. A good example of barrier re-crossing is the second to last row in the table above.
Good layout but comments not clear because p1 and p2 are not defined in relation to the AB and the BC distances. Good conclusion on the table but more clarity in reference to the examples in the table can be achieved by numbering the examples. Sf3014 (talk) 20:55, 24 May 2020 (BST)
Transition state theory (TST) predicts reaction rates, however due to the main assumptions made it overestimates reaction rates as compared to experimental values. This is due to the assumption made, stating that any collision with kinetic energy greater than the activation energy will result in a reaction and formation of the products. However as shown in the table above (particularly the second to last row), barrier re-cressing can cause a collision to reform the reactants and therfore not result in a succesful reaction. This means that in reality the proportion of succesfull collisions is lower than the one predicted by transition state theory and thus transition state theory overestimates the reaction rates. It is important to meantion an opposing effect, that would cause transition state theory to underestimate reaction rates: quantum tunelling. Quantum tunnelling allows the energetic barrier to be crossed even if the reactants do not have sufficent kinetic energy. This would increase the proportion of sucesfull collisions, however the tunelling phenomenon is not as prevalent as barrier re-crossing, especially for heavier systems.
Very good but where is this information about TST from? Needs reference Sf3014 (talk) 20:55, 24 May 2020 (BST)
EXERCISE 2: H+HF/F+H2

For this part of the exercise the F-H-H system was used.
F + H2 -> HF + H is an exothermic reaction, since the energy drops from reactants to products, Figure 3.
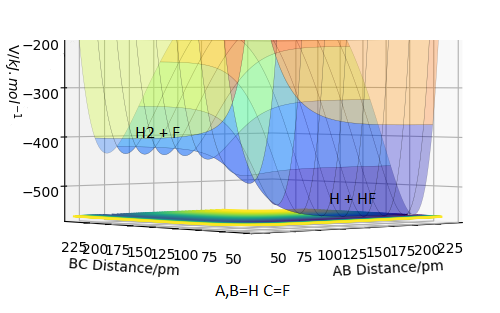
HF + H -> F + H2 is the exact 'opposite' reaction, and by that logic it has to be endothermic. Looking at the surface plot confirms this, Figure 4.
Since in both reaction the only bonds being made/broken are H-H and H-F bonds, the exo-/endothermicity of the reactions can be used to establish the relative bond strengths. Looking at Figure 3, the products have 1 H-F bond and the reactants have only 1 H-H bond. The products are lower in energy, suggesting that the H-F bond is more stable and therfore stronger.
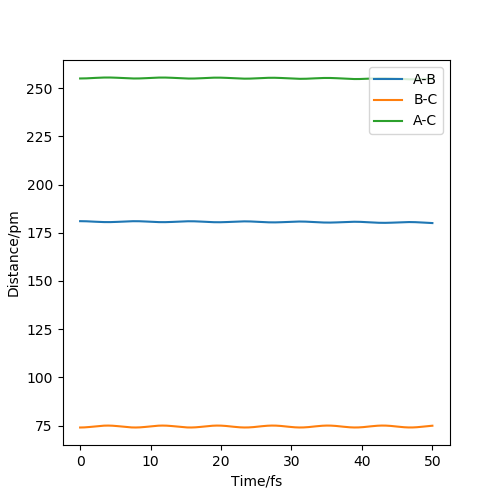
To find the transition state of these reactions (which are the same since the reactions are the opposite of each other), first Hammond's postulate was used: since F + H2 -> HF + H is an exothermic reaction the transition state will be an 'early' transition state, that will be simmilar in structure to the reactants. That meanst the transition state will have a significantly higher F-H distance, while the H-H distance will be simmilar to the H-H bond lenght (around 75 pm). Using this information the transition state was estimated to be at RF-H = 181 pm and RH-H = 74 pm, by finding a position where, given initial momenta equal to 0, the trajectory only oscillates slightly from the initial positions and the initial forces are close to 0, Figure 5.
Very good description. Information on bond energies could be backed up by published experimental values and a reference for the H-H bond distance and Hammond's postulate would be great too Sf3014 (talk) 21:02, 24 May 2020 (BST)
Next the activation energies were found, by subtracting the potential energy of the reactnts/products from the potential energy of the transition state, the values were found to be:
F + H2 -> HF + H activation energy was found to be +1.12 kJ.mol-1
HF + H -> F + H2 activation energy was found to be +126.70 kJ.mol-1
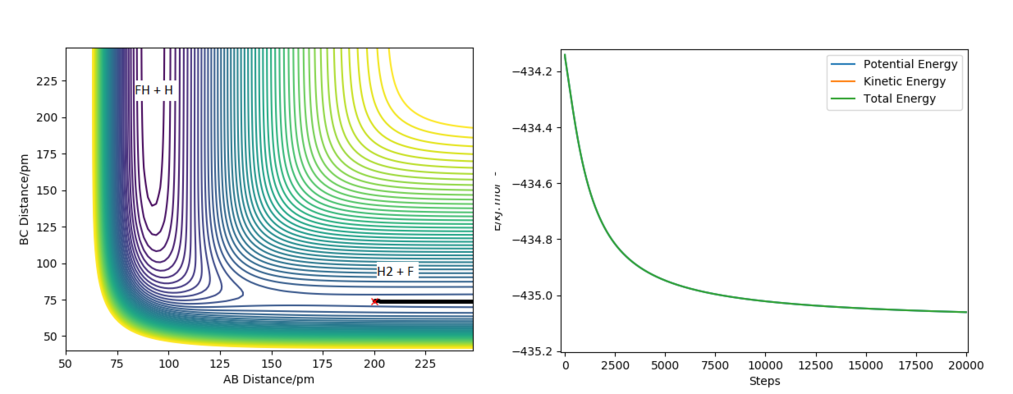
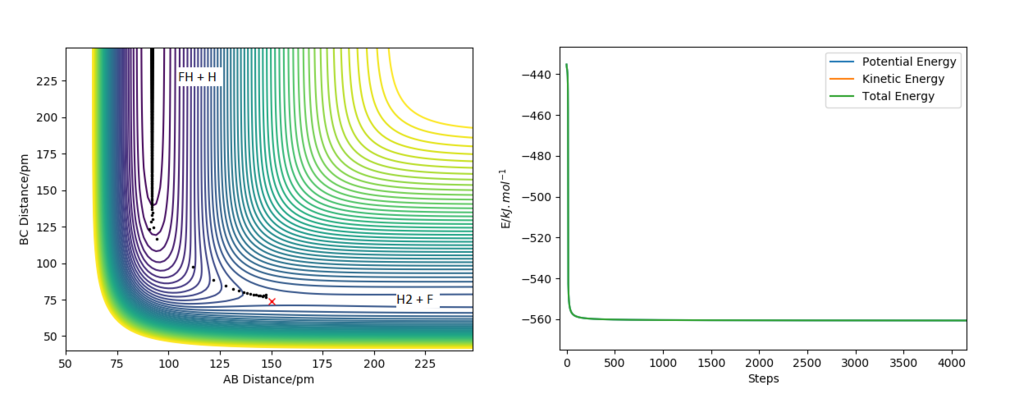
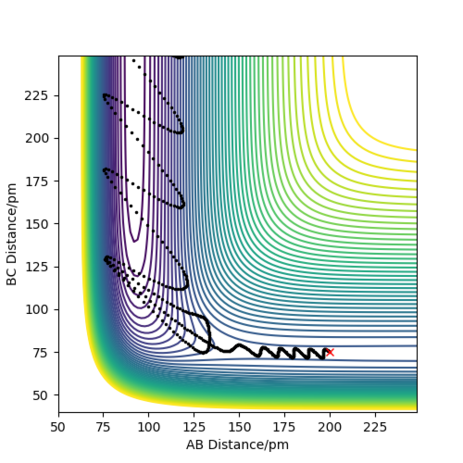
The reactant and product potential energies were found by running a MEP calculations displaced slightly from the approximate position of the transition state towoards either HF + H or F + H2, which allowed the trajectory to follow into the valley of either reactants or porducts. The energies vs time found by these calculations have initially changed and then reached a stable value - the potential energy of reactants/products. The results of the calculations can be found in Figure 6 and Figure 7.
Good but your description on how you calculated the activation energy is not clear. You only mention how you find the energies of the reactants/products with no mention of the energy at the transition state or your calculation to get the activation energy. Sf3014 (talk) 21:12, 24 May 2020 (BST)
A reactive pathway (Figure 8) was found for the initial conditions: RF-H = RAB=200 pm; RH-H =RBC=75 pm; pAB= -2 g.mol-1.pm.fs-1; pBC= 0 g.mol-1.pm.fs-1
In an exothermic reaction the reactants start with a higher potential energy and move on to a lower potential energy in the products. Since the energy has to be conserved it has to be converted into kinetic energy in two forms: either translational or vibrational. Experimantally this could be confirmed by monitoring the rection F + H2 -> HF + H:
- The translational componet could be monitored using colorimetry, using a bomb colorimeter;
- The rotational kinetic energy could be measured using IR, where overtones can be observed when some molecules are promoted to higher vibrational levels, as potential energy is converted into rotational kinetic energy. As these relax back to the groud state the overtones lower in intensity, whlie the main peak gains intensity.
Good but more description is needed. You need to discuss how energy is conserve through evidence that you have provided and explain the behaviour of the evidence, your description is more of a statement. Also, what would bomb calorimetry show you, how will measurements be taken? Your description of infrared spectroscopy is confusing, what has rotational kinetic energy? Sf3014 (talk) 21:27, 24 May 2020 (BST)
Polanyi's rules
Polanyi using his work has composed some simple rules for reaction trajectories[1]:
- For a reaction with a late transition state (an endothermic reaction) a trajectory that has a higher proportion of its kinetic energy in the form of vibrational energy is more likely to result in a sucesful reaction;
- For a reaction with an early transition state (an exothermic one) the opposite is true: a trajectory with more of its kinetic energy in the form of translational energy is favoured.
Some simulations showing these rules are shown in the table below:
Very Good Sf3014 (talk) 21:36, 24 May 2020 (BST)
Good but more explanation is needed, what is the vibrational and translational energies? How are these energies define in your simulations? What is atom A, B and C? This evidence is not shown in a way that supports Polanyi's rules Sf3014 (talk) 21:36, 24 May 2020 (BST)
- ↑ J. POLANYI, Science, 1987, 236, 680-690.

