Kjh68
Exercise 1
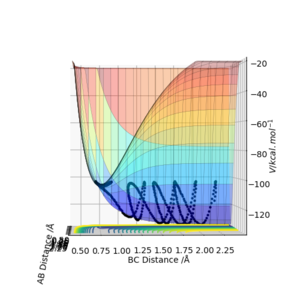
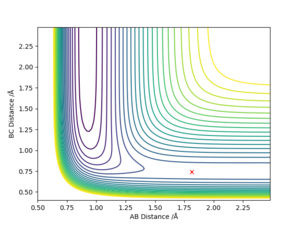
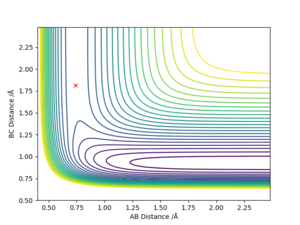
1. On a potential energy surface diagram, how is the transition state mathematically defined? How can the transition state be identified, and how can it be distinguished from a local minimum of the potential energy surface?
The transition state is located at the saddle point in the potential energy surface diagram, hence it is mathematically defined as : ∂V(ri)/∂ri=0 and H < 0, where H = frr(r0,V0)fVV(r0,V0)−f2rV(r0,V0) , which is the determinant of the second partial derivative at the You didn't finish this part and also the second derivative of energy with respect to distance is positive in one direction and negative in the orthogonal direction. Pu12 (talk) 13:49, 23 May 2019 (BST)
The transition state can be identified by going along the minimum energy trajectory and locating the point at which potential energy is maximum along the trajectory. It is also the specific combination of internuclear distances AB and BC at which the trajectory is a point on the contour plot.
I don't understand what this means about the trajectory being a point on the plot. Pu12 (talk) 13:49, 23 May 2019 (BST)
It could be distinguished from a local minimum of the potential by using the second partial derivative discriminant, where a local minimum will give H > 0. The second partial derivative will be positive in one direction and negative in the orthogonal direction, unlike a local minimum which will have negative partial derivatives in any direction of movement because it isn't a sadle point. Pu12 (talk) 13:49, 23 May 2019 (BST)
2. Report your best estimate of the transition state position (rts) and explain your reasoning illustrating it with a “Internuclear Distances vs Time” plot for a relevant trajectory.
You didn't include reasoning. Pu12 (talk) 13:49, 23 May 2019 (BST)
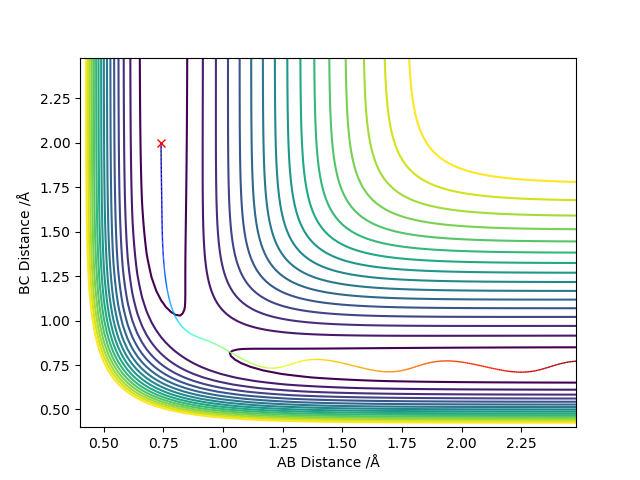
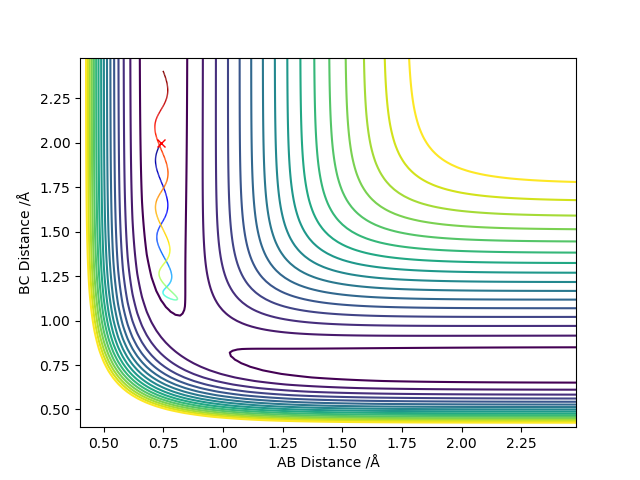
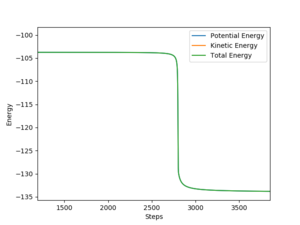
For a trajectory starting with r(AB)=r(BC)=0.74 Å, p1 = p2 = 0.0, the transition state occurs where the internuclear distance is approximately 0.907 Å.
3.Comment on how the mep and the trajectory you just calculated differ.
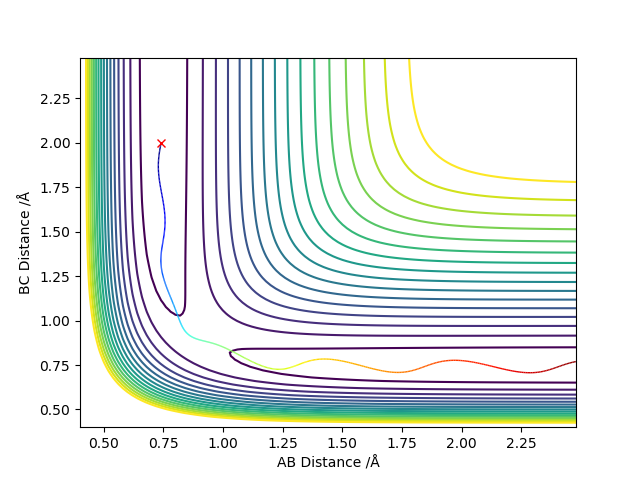
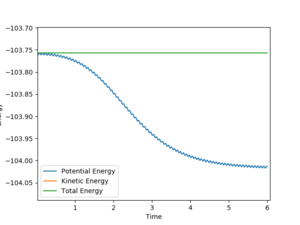
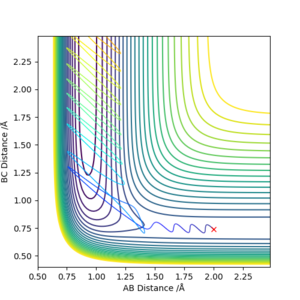
The mep trajectory is a keeps the potential energy at the minimum in a straight line, whereas the dynamic trajectory is wavy does not always stay at the potential energy minimum.
It would be helpful to include diagrams here, also what does the wavy line mean? You should mention about how the momentum is reset in every timestep for the MEP but you get a variation of momenta during the normal trajectory. Pu12 (talk) 13:49, 23 May 2019 (BST)
r1 = rts+δ, r2 = rts
final values of the positions r1(t) = 3.5, r2(t) = 0.74 and the average momenta p1(t) = 2.48, p2(t) = 1.24 at large t.
r1 = rts+δ, r2 = rts
final values of the positions r1(t) = 0.74, r2(t) = 3.5 and the average momenta p1(t) = 1.24, p2(t) = 2.48 at large t.
Setup a calculation where the initial positions correspond to the final positions of the trajectory you calculated above, the same final momenta values but with their signs reversed. - the molecule and the atom coming together instead of moving apart.
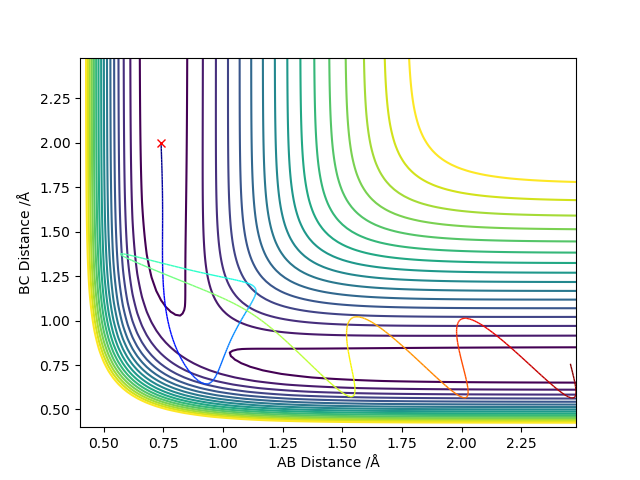
4.Complete the table above by adding the total energy, whether the trajectory is reactive or unreactive, and provide a plot of the trajectory and a small description for what happens along the trajectory. What can you conclude from the table?
| p1 | p2 | Etot | Reactive? | Description of the dynamics |
|---|---|---|---|---|
| -1.25 | -2.5 | -99.0 | yes | The trajectory goes through the transition state and into the products as the reactants possess the right amount of energy for the forward reaction to occur. |
| -1.5 | -2.0 | -100.5 | no | The reactants do not possess enough energy to go through the transition state into the products.
Therefore the trajectory falls back down the surface towards the reactants. |
| -1.5 | -2.5 | -99.0 | yes | The trajectory goes through the transition state and into the products as the reactants possess the right amount of energy for the forward reaction to occur. |
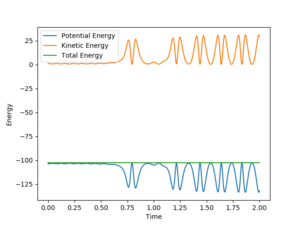
| -2.5 | -5.0 | -85 | no | The trajectory goes from the reactants into the products initially, but possesses enough energy and hence goes back towards the reactants. |
| -2.5 | -5.2 | -83.5 | yes | The trajectory goes from the reactants into the products initially, but possesses enough energy and hence goes back towards the reactants.
It still possesses enough energy to overcome the transition state, so the trajectory goes into the products again at the end. your discussion and plots are correct, but you should talk about the vibration of the molecule also. Pu12 (talk) 13:49, 23 May 2019 (BST) |
A higher momenta of the reactants does not always mean that the trajectory is reactive. If the initial momenta of the reactants are too high, the reactants could first form the products and then reform the reactants again as they have enough potential energy to overcome the activation energy and go through the transition state again to form the reactants. good. Pu12 (talk) 13:49, 23 May 2019 (BST)
5. State what are the main assumptions of Transition State Theory. Given the results you have obtained, how will Transition State Theory predictions for reaction rate values compare with experimental values?
Assumptions [1]:
- Quantum-tunneling effects are assumed negligible and the Born-Oppenheimer approximation is invoked
- Atoms in the reactant state have energies that are Boltzmann distributed
- Once the system attains the transition state, with a velocity towards the product configuration, it will not reenter the initial state region again
The prediction by Transition Theory could predict a higher rate of reaction as potential backward reaction is not considered. Correct. Pu12 (talk) 13:49, 23 May 2019 (BST)
Exercise 2
By inspecting the potential energy surfaces, classify the F + H2 and H + HF reactions according to their energetics (endothermic or exothermic). How does this relate to the bond strength of the chemical species involved?
What about bond strength? Pu12 (talk) 13:49, 23 May 2019 (BST)
Locate the approximate position of the transition state.
The transition state is located at the internuclear distances at which there is no reaction trajectory and stays that the point.
Report the activation energy for both reactions.
Good. Pu12 (talk) 13:49, 23 May 2019 (BST)
In light of the fact that energy is conserved, discuss the mechanism of release of the reaction energy. Explain how this could be confirmed experimentally.
Discuss how the distribution of energy between different modes (translation and vibration) affect the efficiency of the reaction, and how this is influenced by the position of the transition state.
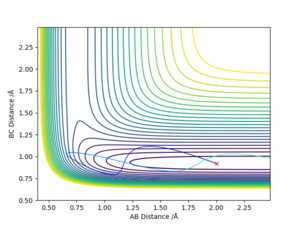 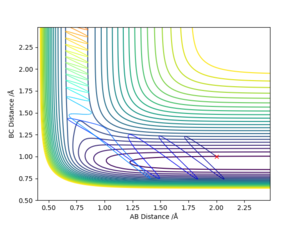 |
Polanyi's empirical rules states that vibration is more effective to promote the reaction than translation for late transition states. As the transition state is late, it is easier to reach the transition state by having a high vibrational energy than high translational energy,which is confirmed by the reaction trajectories on the left. Correct. Pu12 (talk) 13:49, 23 May 2019 (BST) |
This report is a decent report but misses out some key questions and at points is not clear in justifying answers. 3/5 Pu12 (talk) 13:49, 23 May 2019 (BST)
References
- ↑ T.Bligaard, J.K.Nørskov, in Chemical Bonding at Surfaces and Interfaces, Elsevier, Amsterdam, 2008, pp 255-321.

