Kemicompwiki
What value do the different components of the gradient of the potential energy surface have at a minimum and at a transition structure? Briefly explain how minima and transition structures can be distinguished using the curvature of the potential energy surface.
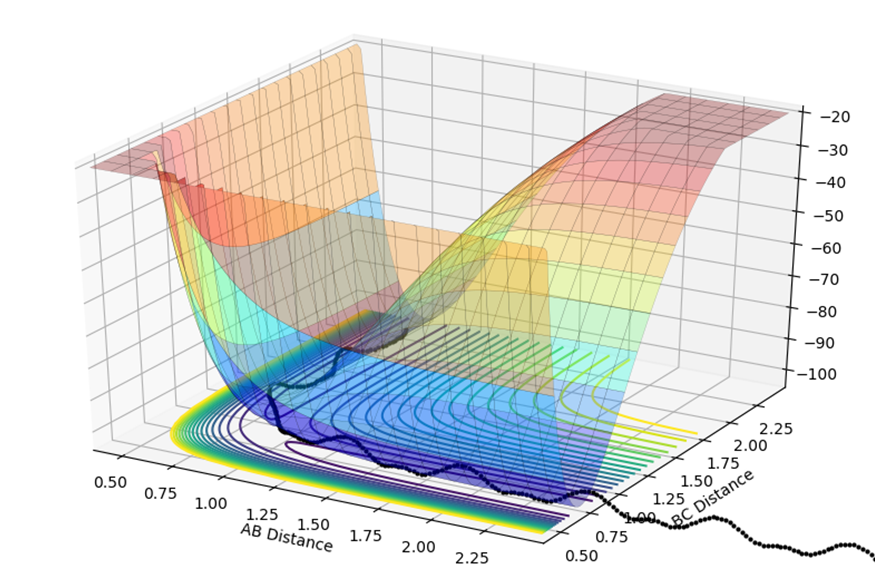
The potential energy surface plot shown below is composed of both the AB distance and the BC distance, and the relative energy of each state. At the start of the reaction, on the left of the graph the AB distance is short, and the black dotted line shows small fluctuations in energy are due to the vibrations.
The transition state is shown by where the potential energy reaches a maxima and the kinetic energy reaches a minima. This is known as the saddle point, at approximately 0.75,0.75. To find the transition state, you need to differentiate both the potential energy and the kinetic energy and find out where both values are stationary. You then need to partially differentiate both to see where they cross, and this is known to be the saddle point.
A-C=B-C Trajectories
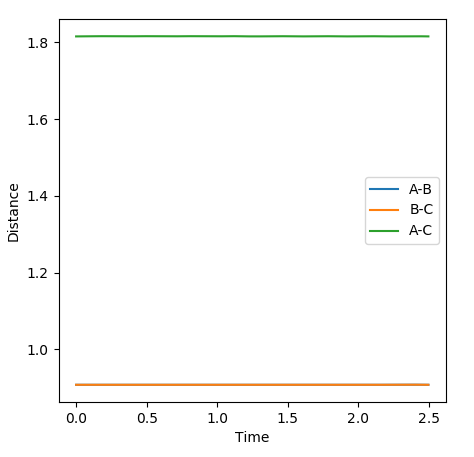
Below the closest estimate I could find for locating the transition state. The AB distance is equal to the BC at 0.9076Ǎ. In the internuclear distance vs Time graph below, both lines are close to flat and any oscillations have been minimised.


