Kejbod
NH3 Optimisation
Optimised molecule of NH3 data
Molecule Name:Ammonia
Calculation method: RB3LYP
Basis set: 6-31G(d,p)
Final Energy / E(RB3LYP): -56.5577687299 a.u.
RMS gradient: 0.05399560 a.u.
Point group: C3V
Optimised bond distance (N-H): 1.300 Angstrom
Optimised bond angle (H-N-H): 109.5
| Item | Value | Threshold | Converged? | |
|---|---|---|---|---|
| Maximum | Force | 0.000004 | 0.000450 | YES |
| RMS | Force | 0.000004 | 0.000300 | YES |
| Maximum | Displacement | 0.000072 | 0.001800 | YES |
| RMS | Displacement | 0.000035 | 0.001200 | YES |
Ammonia molecule |
Link to .log file of ammonia
| Mode | Frequency (Hz) | Infrared |
|---|---|---|
| 1 | 1090 | 145 |
| 2 | 1694 | 14 |
| 3 | 1694 | 14 |
| 4 | 3461 | 1.1 |
| 5 | 3590 | 0 |
| 6 | 3590 | 0 |
Analysis of frequency table
6 modes of vibrational energy are expected from a molecule of ammonia when using the 3N-6, however as observed in the table, modes 2 & 3 and 5 & 6 are degenerate respectively. Modes 1-3 are bending vibrations and 4-6 are stretching vibration. Mode 4 is a highly symmetrical stretching frequency as all the hydrogen molecules move in the same motion simultaneously. Mode 1 is known as the "umbrella" mode. From the data gathered, you would expect to see only 3 bands in an experimental spectrum of gaseous ammonia as while there are 6 modes of vibration witnessed two pairs exist as degenerate frequencies and so would result in the same band, one pair is of these degenerate orbitals is at 0 however and so do not appear on the spectrum.
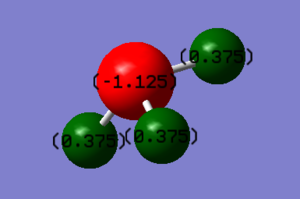
Charge on N atom: -1.125
Charge on H atom: 0.375
These charges are expected as Nitrogen is more electronegative than the hydrogen atoms and will therefore have a higher electron density surrounding it compared to the hydrogen atoms.
N2
Molecule Name: Nitrogen
Calculation method: RB3LYP
Basis set: 6-31G(d,p)
Final Energy / E(RB3LYP): -109.524128676 a.u.
RMS gradient: 0.00000096 a.u.
Point group: D*H
Optimised bond distance (N-N): 1.106 Angstrom
        Item             Value        Threshold  Converged?
Maximum Force            0.000002     0.000450     YES
RMS     Force            0.000002     0.000300     YES
Maximum Displacement     0.000000     0.001800     YES
RMS     Displacement     0.000001     0.001200     YES
Nitrogen molecule |
Link to .log file of nitrogen
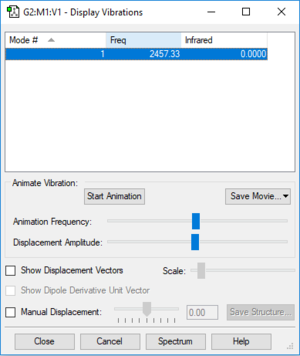
Mode of vibration: Only one highly symmetrical vibrational frequency (stretch) observed due to it being a linear molecule (3N-5=1), there will only be one band observed in the experimental spectrum.
Frequency(Hz): 2457
Infrared: 0
Transition metal complex with N2 as a ligand: UDEDUE | Structure of transition metal complex
Differences in bond length of N2: In the transition metal complex N2 has a bond length of 1.133 Angstrom which is 0.0278 Angstrom greater. This is due to the fact that Gaussian was used to optimise the structure so it is purely theoretical and in a gaseous state with no other molecules surrounding it to possibly interfere with the structure. In the transition metal complex, the nitrogen molecule is affected by many other atoms which draw electron density away from the nitrogen molecule
Homodiatomic nature of the molecule (two nitrogen atoms) means that there is no electronegative difference between the atoms so no dipole or difference in charge will be observed (both have charge of 0)
H2
Molecule Name: Hydrogen
Calculation method: RB3LYP
Basis set: 6-31G(d,p)
Final Energy / E(RB3LYP): -1.17853935163 a.u.
RMS gradient: 0.00003809 a.u.
Point group: D*H
Optimised bond distance (H-H): 0.743 Angstrom
Hydrogen Molecule |
Link to .log file of hydrogen
Item table for H2:
        Item             Value        Threshold  Converged?
Maximum Force            0.000066     0.000450     YES
RMS     Force            0.000066     0.000300     YES
Maximum Displacement     0.000087     0.001800     YES
RMS     Displacement     0.000123     0.001200     YES
Mode of vibration: Similar to nitrogen there is one highly symmetrical vibrational frequency (stretch) observed due to it being a linear molecule (3N-5=1) meaning there will only be one band observed in the experimental spectrum.
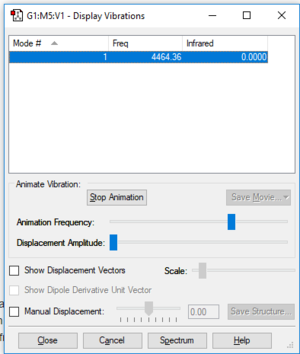
Frequency(Hz): 4464
Infrared: 0
Homodiatomic nature of the molecule (two hydrogen atoms) means that there is no electronegative difference between the atoms so no dipole or difference in charge will be observed (both have charge of 0)
Haber-Bosch process
N2 + 3H2 → 2NH3
Energy of NH3= -56.5577687299 a.u. / 148,492.43 kJ/mol
2*E(NH3)= -113.1155375 / 296,984.86 kJ/mol
Energy of N2= -109.524128676 a.u. / 287,555.62 kJ/mol
Energy of H2= -1.17853935163 a.u. / 3,094.26 kJ/mol
3*E(H2)= -3.53561805 a.u. / 9,282.77 kJ/mol
ΔE=2*E(NH3)-[E(N2)+3*E(H2)]= (-)296,984.87 — ((-)287,555.62 + (-)9,282.77) = -146.5 kJ/mol
Reaction is exothermic therefore energy is released and the product is more stable.
Cl2 [Chosen Molecule]
Optimised molecule of Cl2 data
Molecule Name:Chlorine
Calculation method: RB3LYP
Basis set: 6-31G(d,p)
Final Energy / E(RB3LYP): -920.34987887 a.u.
RMS gradient: 0.00000460 a.u.
Point group: D*H
Optimised bond distance (Cl-Cl): 2.042 Angstrom
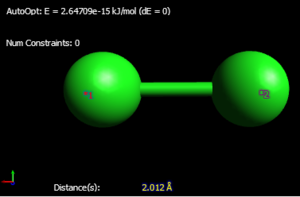
As we see from Avogadro, the bond distance for both optimisation programmes are very similar and only differ by 0.03 Angstrom. This could possibly be due to the fact that Gaussian uses a more mathematical approach and so could potentially be the more accurate of the two.
Compared to a literature value of 2.025 Angstrom, the calculated value of the bond distance in Gaussian is very similar (only 0.017 Angstrom greater in the Gaussian). This is due to experimental values being calculated in the lab for the literature value whereas in Gaussian it is purely theoretical and won't accurately represent the molecule in real life. It is also different as a result of the chlorine molecule bond distance measured in CDC is part of another structure even though it isn't explicitly bonded with it. However, this will have an impact on bond distance
Source for literature value: | CDC
| Item | Value | Threshold | Converged? | |
|---|---|---|---|---|
| Maximum | Force | 0.000008 | 0.000450 | YES |
| RMS | Force | 0.000008 | 0.000300 | YES |
| Maximum | Displacement | 0.000022 | 0.001800 | YES |
| RMS | Displacement | 0.000031 | 0.001200 | YES |
Chlorine Molecule |
Link to .log file of chlorine molecule
Frequency of vibration for Cl2(Hz): 520.46
Mode of vibration: Similar the two previous homo-diatomic molecules there is one highly symmetrical vibrational frequency (stretch) observed due to it being a linear molecule (3N-5=1) meaning there will only be one band observed in the experimental spectrum.
Due to the homo-diatomic nature of the molecule, there is an even distribution of charge and it is overall neutral and both atoms have a charge of 0.
Molecular Orbital Analysis

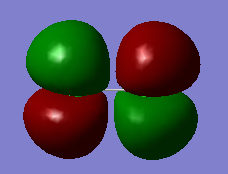

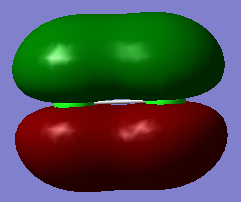


Image 1) is the LUMO for Cl2, which as we can see is an anti-bonding orbital (as observed by the differences in phases and 3 nodes present in the molecular orbital). It appears to be the anti-bonding MO for the sigma bond of the 3p orbital but is unoccupied. It is still, however, slightly buried in energy with a value of -0.142 suggesting some stability
Image 2) depicts the HOMO for Cl2 which is the anti-bonding pi orbitals of Cl2 as seen in the differences in phases. This has a degenerate MO that is perpendicular to this as seen in 3) both with energies of -0.314 which is appropriate as they are the HOMO's and should not be buried deep in energy as they are the furthest occupied orbitals from the nucleus and feel the least attraction to the nucleus. They also do not seem as stable due to having 3 nodes each.
Image 4) depicts the occupied bonding p orbitals. As we see from the image, the in phase sections of the individual 3p orbitals have merged together. It has an energy of -0.407 so it is buried further in energy but still contributes a significant proportion to the bonding of the molecule. This also has a degenerate orbital perpendicular to this that is the same shape.
Image 5) shows us occupied non-bonding s-orbitals of the chlorine molecule that are too buried in energy to be involved in the bonding with an energy of -9.52. They cannot get close enough to interact as the orbitals are very small.
Image 6) depicts the first bonding molecular orbital between the chlorine atoms. It shows 2s orbitals merging in phase with an energy of -0.933 so it is fairly buried in energy and won't be contributing as much to the bonding as the HOMO
Marking
Note: All grades and comments are provisional and subject to change until your grades are officially returned via blackboard. Please do not contact anyone about anything to do with the marking of this lab until you have recieved your grade from blackboard.
Wiki structure and presentation 1/1
Is your wiki page clear and easy to follow, with consistent formatting?
YES
Do you effectively use tables, figures and subheadings to communicate your work?
YES - I like the different colour backgrounds in the jmols!
NH3 0.5/1
Have you completed the calculation and given a link to the file?
YES
Have you included summary and item tables in your wiki?
YES
Have you included a 3d jmol file or an image of the finished structure?
YES
Have you included the bond lengths and angles asked for?
YES
Have you included the “display vibrations” table?
YES
Have you added a table to your wiki listing the wavenumber and intensity of each vibration?
YES
Did you do the optional extra of adding images of the vibrations?
YES
Have you included answers to the questions about vibrations and charges in the lab script?
YES - good answers for the charges question and most of the vibration questions.
However due to the low intensity of vibrations 4, 5 and 6 you only see two peaks in the IR spectrum.
The vibrations are not directly related to the molecular orbitals, you should not refer to vibrations as orbitals.
N2 and H2 0.5/0.5
Have you completed the calculations and included all relevant information? (summary, item table, structural information, jmol image, vibrations and charges)
YES
Crystal structure comparison 0.5/0.5
Have you included a link to a structure from the CCDC that includes a coordinated N2 or H2 molecule?
YES
Have you compared your optimised bond distance to the crystal structure bond distance?
YES
Haber-Bosch reaction energy calculation 1/1
Have you correctly calculated the energies asked for? ΔE=2*E(NH3)-[E(N2)+3*E(H2)]
YES
Have you reported your answers to the correct number of decimal places?
YES
Do your energies have the correct +/- sign?
YES
Have you answered the question, Identify which is more stable the gaseous reactants or the ammonia product?
YES
Your choice of small molecule 4.5/5
Have you completed the calculation and included all relevant information?
YES - although it is unclear whether the information is from the guassian or avogadro calculation, and you didn't explain what method/basis set you used for the avogadro calculation.
Have you added information about MOs and charges on atoms?
YES - overall good explanations of the charges and the MOs. You could have improved by noting that the AOs contributing to the MOs in images 1, 2, and 3 are 3p AOs.
Independence 1/1
If you have finished everything else and have spare time in the lab you could: Check one of your results against the literature, or Do an extra calculation on another small molecule, or
You did an extra calculation in avogadro, well done!
Do some deeper analysis on your results so far
