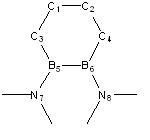
Jyc08moldule2
Gaussview 3.0 will be used for all of the following exercises.
Accuracy
It is known that Energy will have an error of 10 kJ/mol in the following exercises. This is the equivalent of 0.003809 a.u. / Hartree, which are the units that will be reported by the program Gaussview to be used in the following exercise.
The total energy of a particular molecule cannot be compared to other molecules, and these will be reported in a.u. Relative energies can be used to compare to other molecules, and will be reported in kJ/mol. Two things can only be compared using the relative energy when they both have the same number and type of atoms. Both molecules must also have been computed using the same method/basis set in order to compare the relative energies.
Dipole moments are known to be accurate to 2 d.p. i.e. to 0.1 Debye.
Vibrational frequencies will have a systematic error of about 10%, because in the frequency calculations that will be carried out, a harmonic approximation is used for anharmonic vibrations. This means that the magnitude of the error of vibrational frequencies will vary in magnitude, depending on the magnitude of the peak under study. Hence errors of higher frequency vibrations will be larger than errors of lower frequency vibrations.
Intensities are given to the nearest whole number, but the accuracy is much less than this.
Bond distances are accurate to about 0.01 angstrom, and bond angles are accurate to about 0.1 degrees.
Creating and Optimising a Molecule of BH3
A molecule of BH3 was drawn into Gaussview, in a trigonal planar shape. Each one of the B-H bonds were set to 1.5 (angstrom) and the molecule was now ready to undergo an energy optimisation calculation.
The method of optimisation that was used was DFT/B3LYP, the basis set was 3-21G and the type of calculation was OPT.
The B3LYP method determines the types of approximations that are made in solving the Schrodinger equation; the basis set determines the accuracy (3-21G has very low accuracy, but allows for the calculation to be done quickly); and during an optimisation, the lowest energy nuclear configuration is being found for a given electronic configuration. This type of optimisation is the first step for any quantum mechanical calculation.
After the optimisation was carried out, it was found that the optimised B-H bond distance was 1.19435 (angstrom) and the optimised H-B-H bond angles were 120 (degrees). A summary of the results from the optimisation are given below:
| Optimised bond length (angstrom) | Optimised angles (deg) | File type | Calculation type | Calculation method | Basis set | Final energy (Hartree) = E(RB+HF-LYP) | Gradient (a.u.) | Dipole moment (Debye) | Time taken for calculation |
|---|---|---|---|---|---|---|---|---|---|
| 1.19435 (all B-H bonds) | 120 (all) | .log | FOPT | RB3LYP | 3-21G | -26.46226438 | 0.00000285 | 0.00 | 2 min 28.0 sec |
It was seen that the molecule had optimised properly because the value of the gradient was less than 0.001 and very close to zero (0.00000285 (a.u.)).
A gradient of zero
To further check that the optimisation was successful, that the job had really converged, the text version file output of the optimisation was opened up and checked for the lines which read that the forces had "converged", and "Optimisation completed" and "Stationary point found":
The output file of the optimised BH3 molecule was opened in Gaussview 3 and the optimisation plot was viewed from "Results"/"Optimisation".
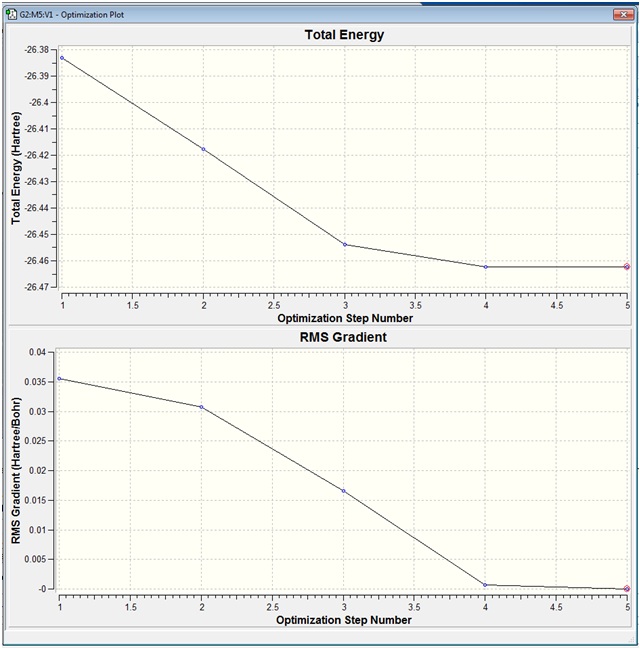
The two optimisation plots show how the energy and gradient have changed during the course of the optimisation:
The Total Energy graph can be thought of as a small section of the Potential Energy Surface of the BH3 molecule. Each optimisation number represents a different configuration of the B and H atoms. In this case, the BH bonds were initially set to equal 1.5 (angstrom) and so the at Optimisation Step Number 1, the configuration of the atoms are such that each H atom is 1.5 (angtrom) away from the central B atom.
In addition to finding the lowest energy configuration of the molecule, the gradient must also be found at each Optimisation Step. The aim of the optimisation is to find the point at which the Energy is a minimum, and mathematically it is known that the minimum of a graph has a gradient of zero. Therefore, the root mean squared (RMS) / average gradient is found at each optimisation step, and the optimisation process is continued until the gradient reaches zero.
When the animation of the optimisation was shown, it was seen that the Total Energy decreased at each step of the optimisation.
In the first step of the optimisation, the molecule appears not to have any bonds. This is because when the molecule was first drawn in Gaussview, the bonds were defined as 1.5 (angstrom) and this distance is above some pre-defined value based on a distance criteria in Gaussview. Therefore Gaussview interprets the molecule as having no bonds.
With each subsequent step of the optimisation, it was seen the the bonds appeared and the bond lengths decreased until the Total Energy no longer decreased.
It was seen above that the optimum bond length was 1.19435 (angstrom) and this gave the molecule a minimum energy of -26.46226438 (Hartree).
It was also seen that the Gradient of the molecule decreased with each optimisation step until it was close to zero.
Therefore, the Total Energy vs Optimisation Step Number graph and the Gradient vs Optimisation Step Number graph show the cumulative steps during the optimisation, in terms of the Energy and the Gradient.
Molecular Orbitals (MOs)
The following exercise should be done using a .chk file from the optimisation of BH3, however, it was found that the BH3 optimisation did not give a .chk, and only gave a .out.log file. The reason for this may have been that Gaussview 3 was used instead of Gaussview 5 for the BH3 optimisation.
The .out.log file file from the BH3 optimisation exercise was opened in Gaussview and the Gaussian Calculation method was now set to "energy" instead of "optimisation". The Additional Keywords "pop=full" were added to switch on the MO analysis, and under the NBO tab, "full NBO" was selected.
This input file was saved, edited in Wordpad, and then submitted to SCAN.
http://hdl.handle.net/10042/to-7509
When the job had finished, the checkpoint file was downloaded and viewed in Gaussview 3.
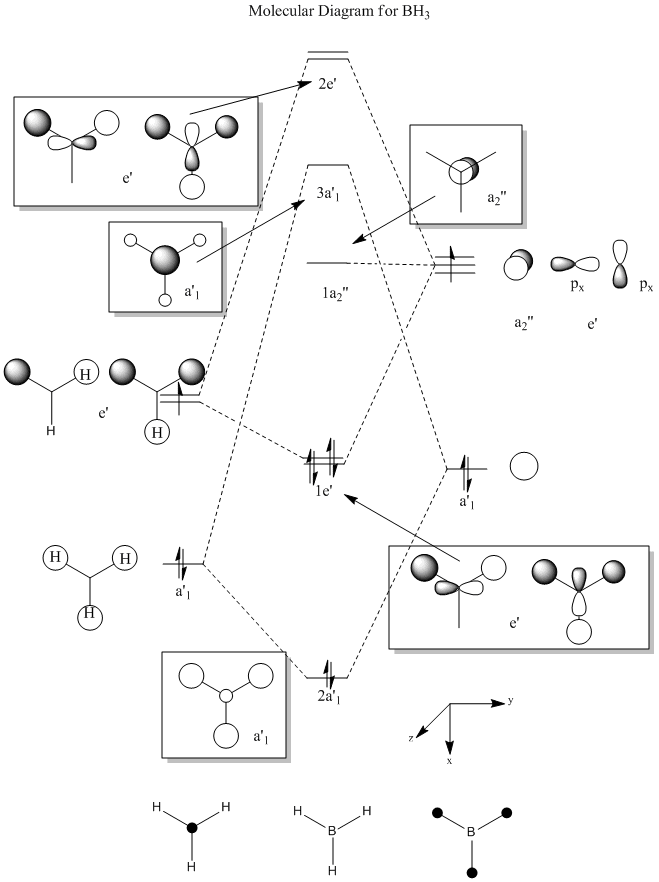
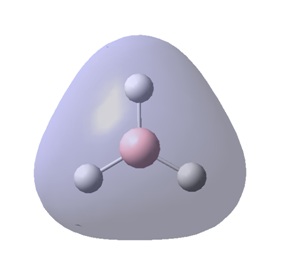
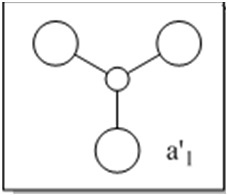
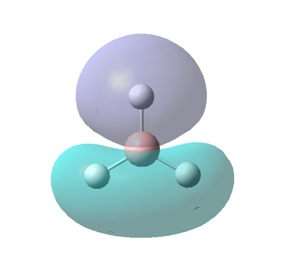
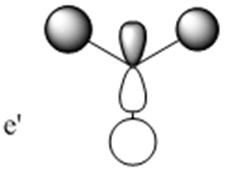
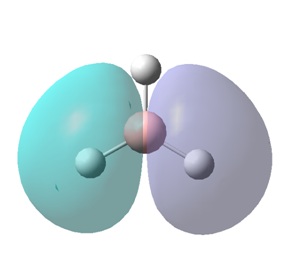
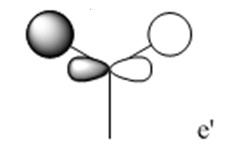
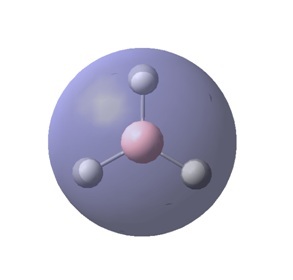
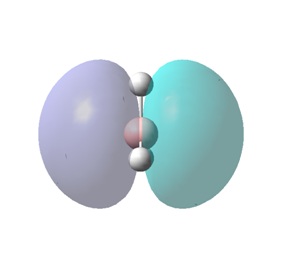
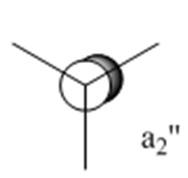
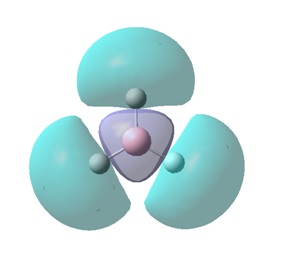
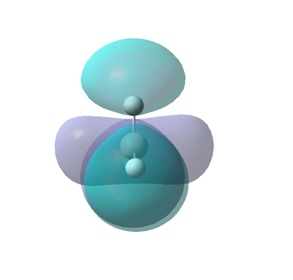
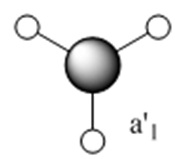
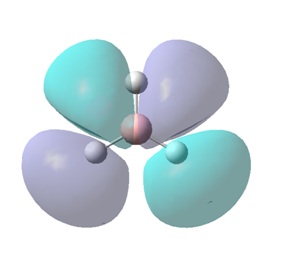
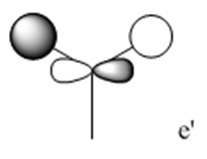
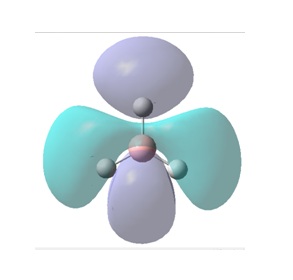
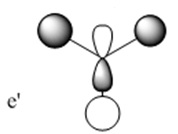
The molecular orbitals (MOs) numbers 1-8 were visualised to give the MOs shown in the table. Below is a molecular orbital diagram of LCAO for BH3. The MOs generated from this LCAO diagram have also been included in the table for easy comparison with the "real" MOs generated from the MO calculation. On the right is shown the energies of each MO, in Hartrees.
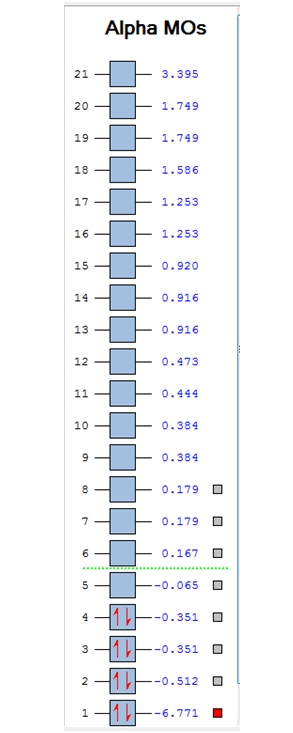
Since MO 3 and 4 have the same energy, they are of course doubly degenerate and since they are fully occupied, they can therefore be deduced to be the MOs labelled 1e' labelled in the LCAO MO diagram. From this, it can be deduced that the MO labelled 2a'1 is MO 2, and MO 1 is the lowest energy 1a'1, which is included in the table below.
The comparisons made in the table above between the quantitative, "real" MOs and the qualitative, LCAO MOs show that overall it is possible to recognise and match a particular MO in both forms simply by studying them by eye. Therefore, LCAO MO theory is a very powerful method of generating MOs without the need to perform complicated calculations.
However, although the simpler LCAO MOs (such as MO 1-5) can easily be matched to their "real" counterparts; the more sophisticated MOs (MO 7 and 8) require a little more thought and consideration.
The effects of in-phase and out-of-phase interactions are often difficult to depict in simple LCAO diagrams, and therefore the "real" MOs often end up with a very different shape to what is expected from the LCAO MO.
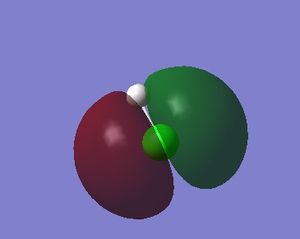
For example, MO 7 has a node down the middle and 2 out-of-phase interactions on either side of the p-orbital. In order to predict how the "real" MO will look from the LCAO MO, it must be known that out-of-phase interactions will lead to repulsion and therefore the p-orbital will distort in such a way as to decrease the amount of repulsive interactions. This is achieved by the bending of the p-orbital away from the two s-orbitals, which leads to the shape of the "real" MO 7 shown. An understanding of the effects of in-phase and out-of-phase interactions is required to be able to recognise "real" and LCAO MOs interchangeably.
Natural Bond Orbitals (NBOs)
The .log file was then downloaded from the MO calculation and the charge distribution was then studied.
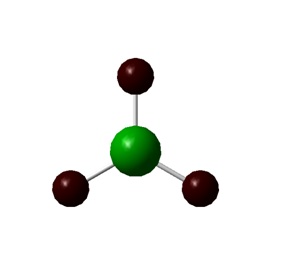
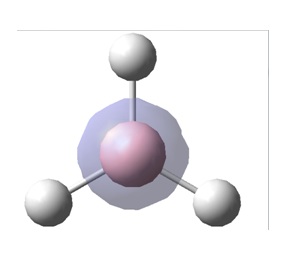
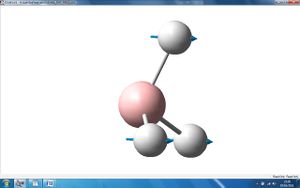
In the image of BH3 shown, the green colour of the B atom indicates a highly positive charge and the red colour of the H atoms indicate a highly negative charge.
The NBO charges for the boron and hydrogen atoms were shown to be:
| B atom | 0.331 |
| H atom | -0.110 |
The text file of the Results were now opened up to view the NBO analysis.
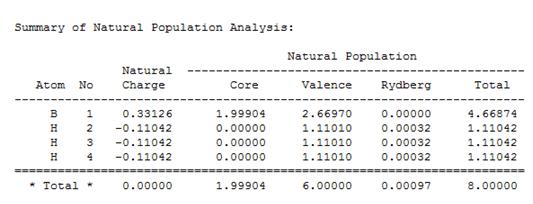
The "Summary of Natural Population Analysis" section of the "Natural Atomic Orbital and Natural Bond Orbital Analysis" was found, and this part showed the same charges on the B and H atoms that were previously visualised (shown) in Gaussview.
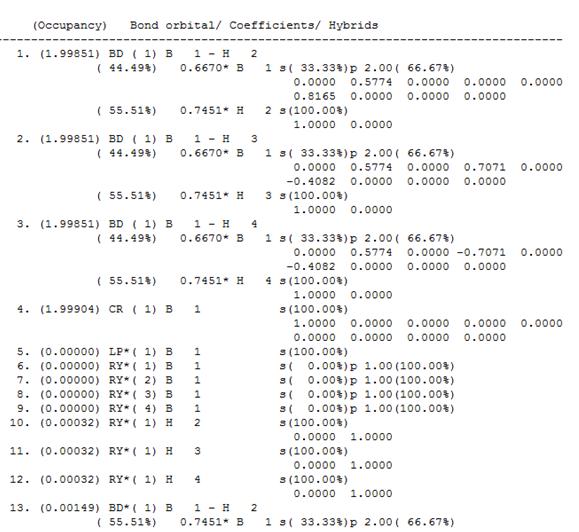
The "Bond Orbital/Coefficients/Hybrids" section showed the expected types of bonding in the BH3 molecule, except for Orbital 5, which showed the following information:
5. (0.00000) LP*( 1) B 1 s(100.00%)
This indicates that the lone pair on the B atom is 100% located in the B s-orbital. This is known to be incorrect, as it is known that the B lone pair is located on a p-orbital, sticking out of the plane of the trigonal planar BH3 molecule. This discrepancy is the result of a problem in the calculation method that has been used.
The "Second Order Perturbation Theory Analysis of Fock Matrix in NBO Basis" section was found to contain the expected information describing the interactions between the MOs. It was confirmed that none of the energies in the E(2) column were above 20 (kcal/mol), they were all equal to 1.51 (kcal/mol), and therefore none of these were of interest.
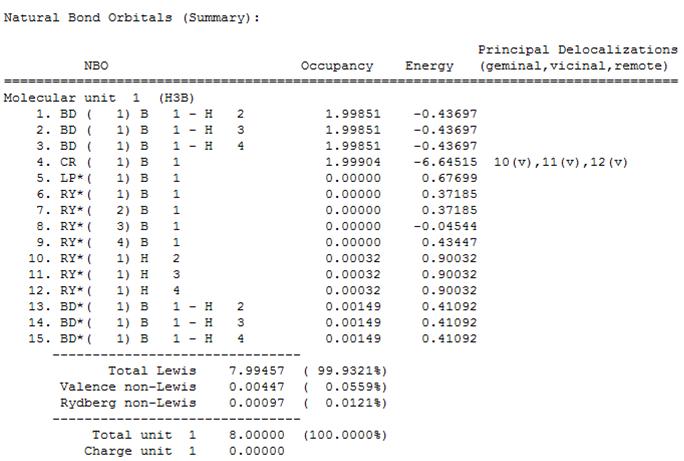
Finally, the "Natural Bond Orbital (Summary)" was found to show the energy and occupation of the 15 natural bond orbitals (NBOs).
Frequency Analysis and Confirming Minima
A copy of the optimised BH3 structure from earlier was made, and this copy was used run a "frequency" calculation. The additional key words "pop=(full,NBO)" were added to request a full analysis of the electron density and MOs, which will be needed later.
After the calculation was completed, the Summary was opened to check that the correct file had been used for this frequency calculation. It was confirmed that the Energy in this Summary was the same as the Energy found in the Optimisation Summary:
| Optimised Bond Length | 1.19435 (angstrom) |
| Optimised angles | 120 (deg) |
| File type | .log |
| Calculation type | FOPT |
| Calculation method | RB3LYP |
| Basis set | 3-21G |
| Final energy | E(RB+HF-LYP) = -26.46226438 (a.u.) |
| Gradient | RMS gradient norm = 0.00000285 (a.u.) |
| Dipole moment | 0.0000 (Debye) |
| Calculation time | 2 min 28.0 sec |
The gradient was seen to be less than 0.001 (a.u.), therefore it was concluded that the optimisation was complete.
The output file was then opened:
The output file showed the following information about the frequencies of the optimised molecule:
| Frequency No. | 1 | 2 | 3 | 4 | 5 | 6 |
|---|---|---|---|---|---|---|
| Symmetry | A' ' | E' | E' | A' | E' | E' |
| Low Frequency (cm-1) | -0.6560 | -0.0171 | -0.0021 | 20.1987 | 21.4875 | 21.4975 |
| Frequency (cm-1) | 1145.7148 | 1204.6589 | 1204.6599 | 2592.7908 | 2731.3088 | 2731.3095 |
| Reduced Masses (amu) | 1.2531 | 1.1085 | 1.1085 | 1.0078 | 1.1260 | 1.1260 |
| Frc consts (mDyne/A) | 0.9691 | 0.9478 | 0.9478 | 3.9918 | 4.9491 | 4.9491 |
| IR Inten (KM/mole) | 92.6991 | 12.3789 | 12.3814 | 0.0000 | 103.8370 | 103.8302 |
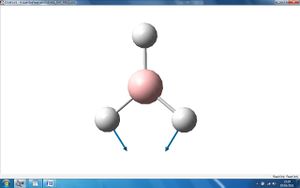
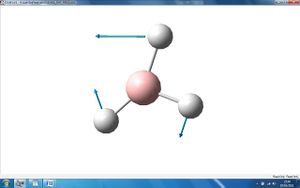
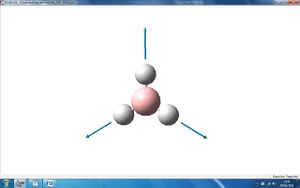
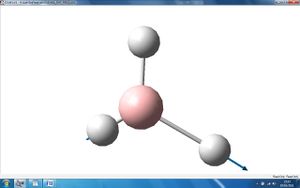
The above 6 frequencies are the 6 motions of the centre of mass of the molecules. It can be seen that three of the zero frequencies, shown as "low frequencies" in the table, are very close to zero albeit slightly negative. This indicates that a stationary point has been found.
The three other zero freqencies are all around 20 (cm-1) which although not zero, they are substatially smaller than the vibrational frequencies, about 10% which is comparable to the systematic error in vibrational frequencies. Therefore these also indicate that the stationary point has been found.
It is known that the better the method used, the closer these six zero frequencies will be closer to zero. We have used a low level method in this calculation which explains why the last three zero frequencies are all quite far from zero, around 20 (cm-1).
It is known that Frequencies have an error of 10% and Intensities are always rounded to the nearest integer. Therefore, all of the values above are given to the nearest whole number, to account for the intrinsic errors. These errors all occur due to the fact that the calculation has assumed a harmonic oscillator in the place of an anharmonic oscillator.
The IR spectrum of this molecule is shown:
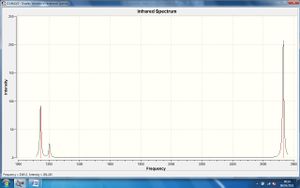
Although the molecule was expected to have 6 different vibrations, as predicted by the frequency calculation, it can be seen that the IR spectrum only shows three different peaks: at around 1140 cm-1, 1200cm-1 and 2750cm-1.
These three peaks can be matched to the vibrations in the table above which are labelled A2' (Int. = 93), E' (Int. = 12) and E' (Int. = 104). It is obvious that there is degeneracy in both types of E', which is why there are only 3 peaks in the IR spectrum. The remaining vibration in the table labelled A1' (Int. = 0) does not show in the IR spectrum because it involves no change in dipole (a prerequisite for IR analysis) and therefore has zero intensity in the IR spectrum.
Creating and Optimising a Molecule of TlBr3
Optimisation
A molecule of TlBr was drawn in Gaussview using a trigonal planar fragment. The symmetry of the molecule was then restricted to the point group D3h, and the tolerance was set to "very tight (0.0001)". The tolerance had to be set to a very strict value in order to avoid problems with the molecular orbitals (MOs) and vibrations later.
The molecule was now ready for an optimisation calculation. The method used was DFT/B3LYP, the basis set was LanL2DZ (which is a medium level basis set: D95V on first row atoms and Los Alamos ECP ie. pseudo potentials on the heavier elements).
Psuedo potentials basis sets were required for this molecule, and not in the previous molecule of BH3, because the atoms thallium and bromine are larger. These larger atoms each have more electrons associated with them than B and H atoms studied previously, and therefore in the current calculation the psuedo potential is used to ignore the inner core electrons, and only to consider the outer electrons that participate in bonding. The 3-21G basis set used for BH3 consider all electrons present and therefore would not be a suitable basis set to use for TlBr3. An advantage of doing this is that calculations will be easier and therefore quicker to carry out.
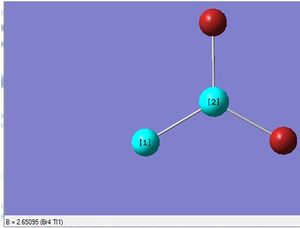
After the optimisation was carried out, it was found that the optimised Tl-Br bond distance was 2.65 (angstrom) for all three bonds, and the the optimised Br-Tl-Br bond angle was 120.0(degrees) for all three bond angles.
The optimised structure of TlBr3 is shown, with the bond distance indicated:
The Summary of the optimisation is shown.
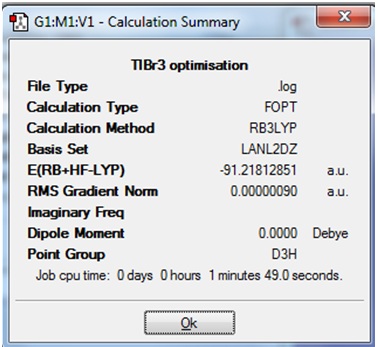
The value of total energy will be compared to that obtained after the frequency calculation.
The output logfile is given: File:TLBR3 OPTIMISATION.LOG
Frequency Analysis
In order to confirm that the structure of the minimised TlBr3 was correct, ie. a minimum, a frequency/vibrational analysis was carried out.
The optimised structure of TlBr3 was opened in Gaussview 3 and a copy of this file was made. The copy was then set up for frequency calculation [job type was "frequency"; additional key words "pop=(full,nbo)].
When the calculation was complete, the output file was opened up and the Summary was checked to see that the energy was the same as after Optimisation.
It can be seen that the Total Energy obtained after the frequency calculation is the same as that obtained after the Optimisation of TlBr3, therefore it is known that the same molecular structure was optimised is both cases. The only change between both of the structure is the value of the RMS gradient, which has become larger after the frequency calculation. However, it is still very small and very close to zero, therefore it is concluded that the optimisation was successful and that the lowest energy structure of TlBr3 has been found.
The real output file was then opened up:File:JOANNA TLBR3 FREQ.LOG
ThBr3 Questions
In both of the calculations that have been carried out on the ThBr3 molecule (optimisation calculation and frequency calculation) the following method and basis set was used:
Calculation method: RB3LYP
Basis set: LANL2DZ
The same method and basis set must be used for both calculations because this is the only way that the optimised structures obtained from both calculations can be compared in terms of their energy. This is because the energy that is obtained after a calculation is very highly dependant on the calculation method, the basis set and also the details of the calculation that has been used. Therefore, is the aim of a particular experiment is to try to draw comparisons between various molecules, it is necessary to have optimised each molecule in exactly the same way, using the same method and basis sets.
Another factor which must be exactly the same, in order for the energy two molecules to be compared, is the number of atoms and also the type of atoms present in the molecule.
The frequency analysis is carried out because: The frequency is essentially the second derivative of the potential energy surface. The aim of the exercise is to obtain all positive values of frequencies which therefore indicate that the minimum energy has been found. In the case that one of the frequencies are negative, a transition state has been found; but if more than one negative frequency has been found, this would indicate that the optimisation has not completed/has failed, and an energy minimum has not been found. Another aim of frequency analysis is to obtain IR/Raman modes of the molecule in order to compare with literature.
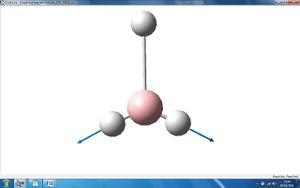
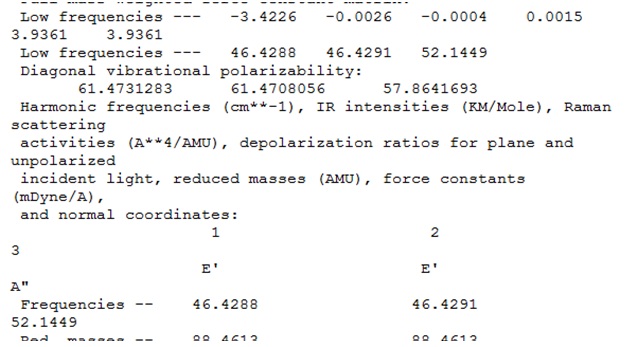
The low frequencies of TlBr3 are shown below to be -3.4226, -0.0026, -0.0004, 0.0015, 3.9361 and 3.9361 cm-1 (with errors of 10%).
The lowest "real" normal mode is shown to be 46.4288 cm-1, also with an error of 10%. The value of this "real" frequency is therefore 46.4288 cm-1 +/- 4.64288 cm-1.
Although the desired "zero" values of frequency have not been obtained (some of the values are quite far from zero, such as -3.4226, 3.9361 and 3.9361 cm-1), and one of them are even negative, it can be seen that these outlying values are actually within the 10% error of the lowest "real" frequency.
Therefore, it can be concluded that the "zero" frequency values are sufficiently close to zero in order to indicate that the optimisation has been successful in finding a minimum energy structure of TlBr3.
In some structures Gaussview does not draw bonds where we expect. This is due to the way that a bond has been defined in the Gaussview program. A bond has been defined in terms of distance in Gaussview, so when a structure features a bond length that is longer than the pre-defined value, Gaussview simply does not show that particular bond in the molecule. Of course, this does not indicate that the bond is not physically present on the molecule, it simply means that this bond is not recognised in this particular computer program.
A bond exists when two nuclei have sufficient electron-nucleus attraction to overcome electron-electron and nucleus-nucleus repulsion. in such a case, the two nuclei are brought together by the attractive interactions, and the "bond" that exists between them is simply the electron density that is being shared. Electron density is shared because the attractive forces are the result of each nucleus seeking to achieve a full outer shell of electrons. The "length of a bond", ie. the bond distance, is entirely variable depending of the two types of nuclei involved.
Therefore it is inevitable that Gaussview will incorrectly represent (or not represent) certain bonds because Gaussview has defined a bond in terms of distance, when in fact a bond is dependant on a lot more than distance alone.
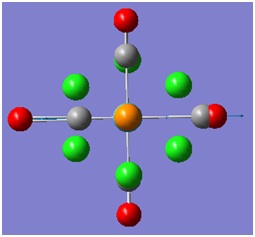
Cis and Trans Isomers of Mo(CO)4(PCl3)2
Optimisation
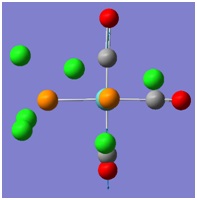
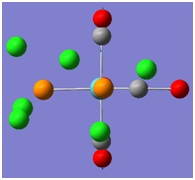
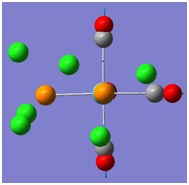
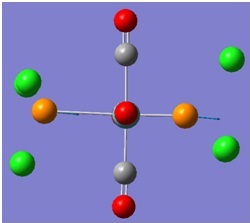
Both the cis and trans isomers of the complex Mo(CO)4(PCl3)2 were drawn in Gaussview and input files were created with the method B3LYP and the basis set LANL2MB. The additional keywords "opt=loose" was included to set a loose convergence criteria. The calculation was submitted to SCAN, and the cis and trans isomers took 3:29 min and 2:48 min respectively to run.
The checkpoint files were downloaded and it was seen that both of the optimised isomers had retained their P-Cl bonds.
http://hdl.handle.net/10042/to-7492
http://hdl.handle.net/10042/to-7493
It was noted that although the checkpoint file showed the P-Cl bonds, the log file did not.
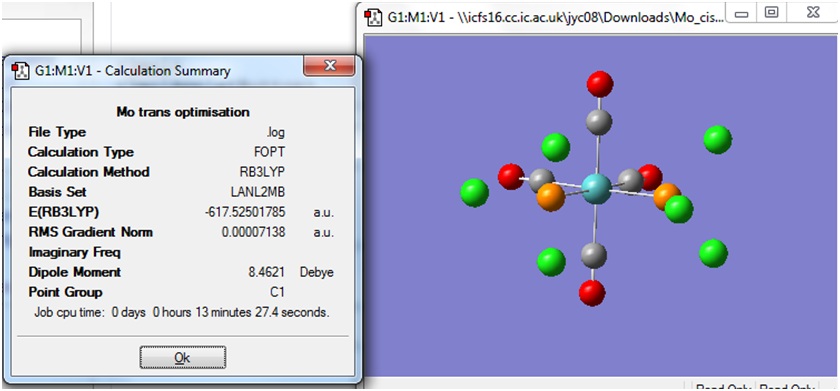
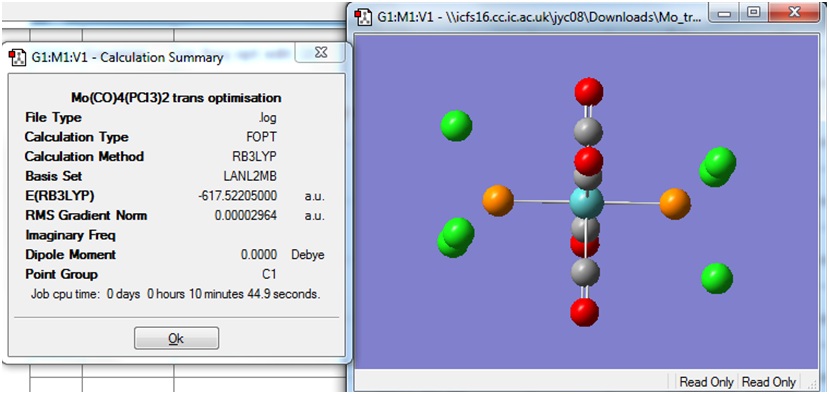
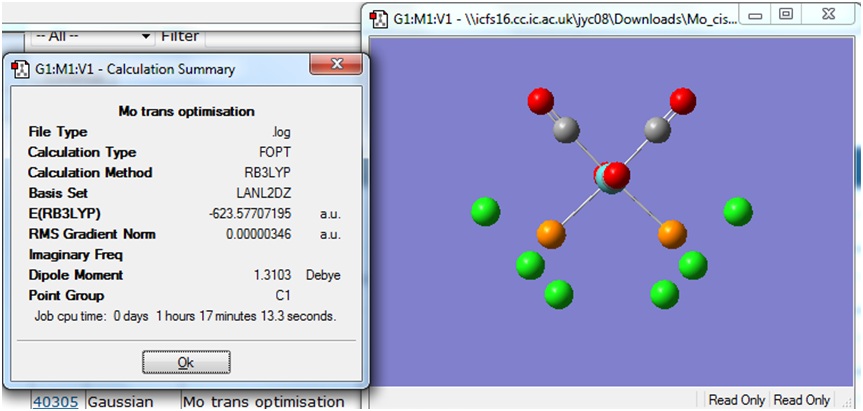
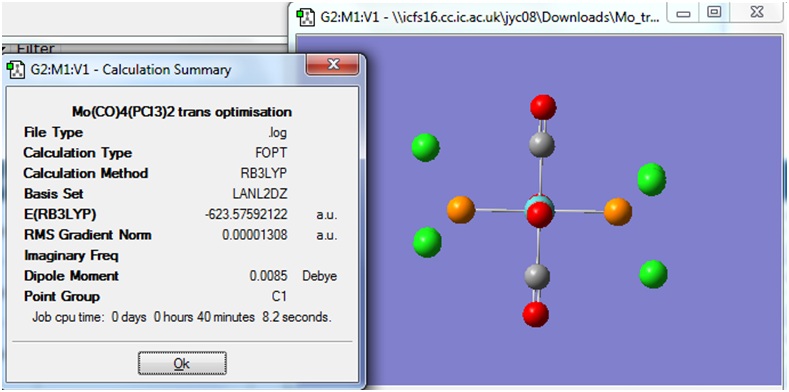
The Summary of optimisation for the cis and trans isomers are shown.
It can be seen that both the cis and trans isomers obtained after the optimisation were very similar in energy. The most noticeable difference between the two structures is seen to be the Dipole Moment, which is 8.81 Debye for the cis isomer and zero 0.00 Debye for the trans isomer. This is expected, due to the geometry of the ligands in both isomers.
Dihedral Angle Optimisation
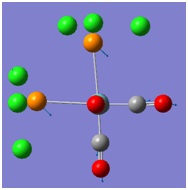
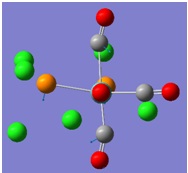
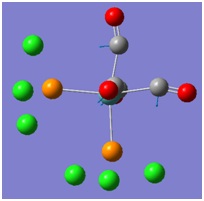
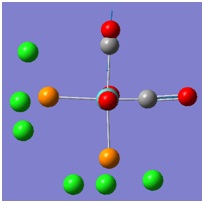
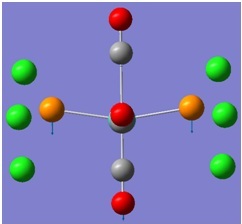
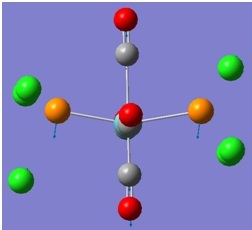
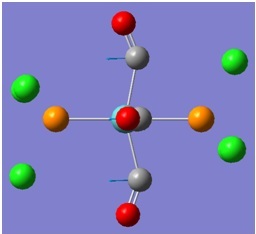
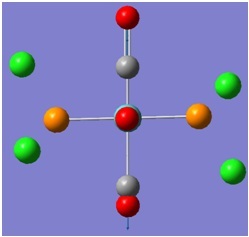
These optimised molecules were then manipulated in Gaussview 3 to optimised their dihedral angles. The optimised cis and trans molecules were manipulated so that the PCl3 ligands had the following conformations:
An input file was created for each of the cis and trans isomers, for "optimisation" using the method "B3LYP", the "LANL2DZ" psuedo-potential basis sets and the additional keywords "int=ultrafine scf=conver=9".
These input files were submitted to SCAN.
After the calculation was completed, the checkpoint files were downloaded and opened in Gaussview 3. The isomers with optimised dihedral angles had the following structures:
http://hdl.handle.net/10042/to-7799
http://hdl.handle.net/10042/to-7802
The Summary for each of the isomers was viewed:
Once again it can be seen that the energy of both isomers is very similar, but these energy values are slightly lower than those obtained in the previous optimisation, when the dihedral angles had not yet been modified and optimised.
An interesting point is that the Dipole moment of the cis isomer obtained here is lower than that obtained in the previous optimisation; whereas the dipole moment for the trans isomer is slightly higher than that obtained in the previous optimisation.
Frequency Analysis
The cis and trans isomers, which had been optimised for their dihedral angles, then underwent frequency analysis in order to confirm their optimised geometries.
The formatted checkpoint files of the Mo complex, with optimised dihedral angles, were downloaded and viewed in Gaussview 3. New input files were created using this structure, changing "optimisation" to "frequency" and keeping the method "B3LYP", the basis set "LANL2DZ" and the additional keywords "int=ultrafine scf=conver=9".
These frequency optimisation input files (cis and trans) were then submitted to SCAN.
Cis
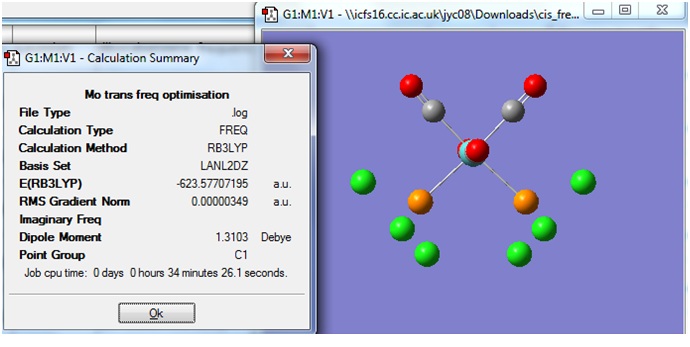
After the frequency calculation, the logfile was downloaded and viewed in Gaussview 3. Below is the Summary of the calculation.
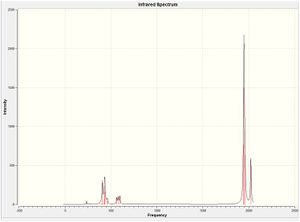
The IR spectrum is shown:
http://hdl.handle.net/10042/to-7550
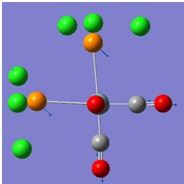
The vibrations were visualised, and are shown in the table below.
Trans
When the calculation was completed, the logfile was downloaded and viewed in Gaussview 3.
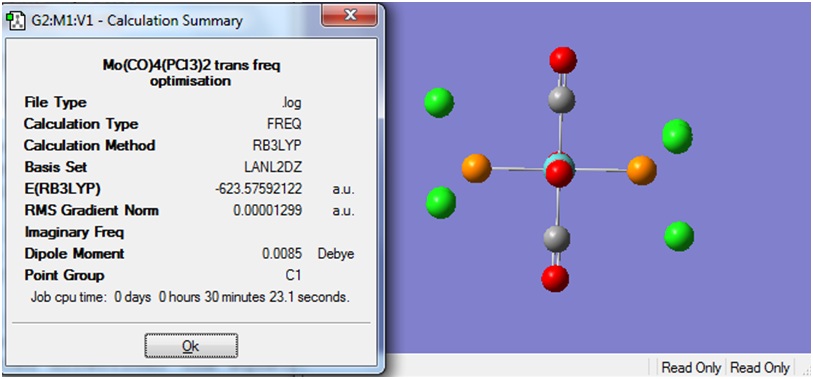
The Summary of the optimisation is shown below.
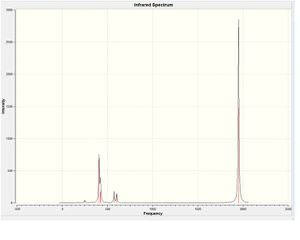
http://hdl.handle.net/10042/to-7551
The IR spectra for both cis and trans isomers did not show any very low or negative frequencies.
If a vibration or rotation has a very low frequency, it would be expected that at room temperature the thermal energy in the atmosphere might be sufficient to cause these vibrations or rotations.
The carbonyl stretches of the cis isomer are given:
| Frequency (cm-1) | Intensity |
|---|---|
| 1945.31 | 762.917 |
| 1948.68 | 1498.38 |
| 1958.37 | 632.781 |
| 2023.32 | 597.777 |
The carbonyl stretches of the trans isomer are given:
| Frequency (cm-1) | Intensity |
|---|---|
| 1950.35 | 1476 |
| 1950.35 | 1476 |
| 1977.19 | 0 |
| 2031.05 | 0 |
As expected, the cis isomer shows more CO peaks than the trans isomer because the cis isomer has less symmetry and therefore has more vibrational modes involving a change in dipole.
Therefore the IR spectrum of the cis isomer shows more CO peaks than the trans IR spectrum.
Analysis of the Structures
A comparison of the calculated and literature bond lengths is given in the table below.
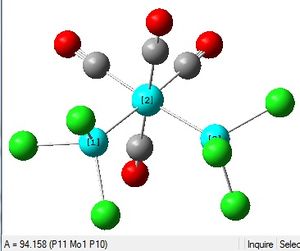
| heading | Mo-P | Mo-C | P-Cl | C-O |
|---|---|---|---|---|
| cis | 2.51 (2) | 2.01 (2) | 2.24 (6) | 1.17 (2), 1.18 (2) |
| cis lit.[1] | 2.58 | |||
| trans | 2.45 (2) | 2.06 (4) | 2.24 (6) | 1.17 (4) |
| trans lit.[1] | 2.50 | 2.01 | 1.16 |
(The number in brackets indicate the number of bonds present of each type)
The literature values for Mo-P bond lengths are larger than those calculated in this exercise, whereas the agreement between literature and calculated bond length for Mo-C and C-O are reasonably close.
The difference between the calculated and the literature bond length values can be concluded to be due to the fact that literature has reported values for the analogous Mo complex with triphenyl phosphine ligands instead of chlorine ligands.
The trans isomer has a shorter Mo-P bond length than the cis isomer because there are fewer unfavourable steric interactions within the trans than the cis isomer. The Cis isomer experiences repulsion between the chlorine atoms which are all adjacent to each other in the coordination sphere of Mo. Therefore the bonds will distort, by elongation in order to relieve the repulsive interactions.
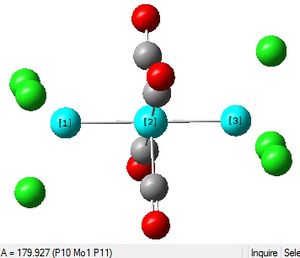
A comparison of the calculated and literature dihedral angles is given in the table below:
| heading | P-Mo-P |
|---|---|
| cis | 94.2 |
| cis lit.[1] | 104.6 |
| trans | 179.9 |
| trans lit.[1] | 180 |
The literature dihedral angles can be seen to be larger than those calculated in this exercise. Once again, it is important to point out that the values in literature refer to phosphine ligands instead of chlorine ligands. Obviously, phosphines are sterically larger and will cause more steric repulsion, thus resulting in larger dihedral angles than the chlorine ligands. It can be seen that in the literature trans angle, the angle is at the maximum possible angle of 180 degrees.
In all of the three calculations that were undertaken on the isomers, the total energy has been very close between the two isomers. Therefore it is difficult to define which isomer is more stable.
If the trans isomer is taken to have the lower energy of -623.57592122 a.u. and the cis isomer is taken to have the higher energy of -623.57707195 a.u., the difference in energy between the two isomers is therefore 0.00115073 a.u., which is the equivalent of a difference in energy of 3.02 kJ/mol.
Room temperature is taken to be about 2.5 kJ/mol, therefore the difference between the two isomers is not significantly large at room temperature and therefore on a hot day, the two isomers can interconvert, on the basis of energy.
In literature[1] it has been found that zero-valent Mo complexes of this type usually can exist as either the kinetically stable cis isomer, or the thermodynamically stable trans isomer. This agrees with what was found in this experiment, because the trans isomer was found to be 3.02 kJ/mol less in energy than the cis isomer.
Project
This project will involve carrying out geometry optimisations and comparing structures across three molecules. A method and basis set will be chosen and justified, where smaller molecules will use a higher level than larger molecules (for reasons of time constraints). An example of a low level method would be B3LYP and 6-31G(d), whereas a high level and more accurate calculation would be MP2 and 6-311G(d,p).
The vibrational spectrum will be considered, either by analysing one particular spectrum in detail, or by analysing key parts of the spectra for a series of molecules.
The electronic structure and MOs will be analysed of one molecule in some detail.
An NBO analysis might also be carried out, for example comparing the changes that occur on substituting heavier elements , or electron-donating/-withdrawing ligands.
Energies can only be compared in a relative sense across molecules or reactions with exactly the same number and type of atoms.
1,2-Diboratabenzene
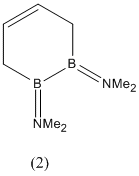
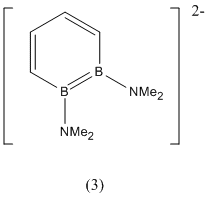
The following project will focus on the 1,2-diborabenzene (1), 1,2-dibora-3,5-cyclohexadiene (2) and 1,2-diboratabenzene ion (3) shown below:
| 1,2-diborabenzene (1) | 1,2-dibora-3,5-cyclohexadiene (2) | 1,2-diboratabenzene ion (3) |
|---|---|---|
 |
 |
|
It has been found from literature[2] that compound (2) can be formed as a liquid from diborane(4), and the subsequent reduction of (2) using LiTMP yields the sparingly soluble compound (3):
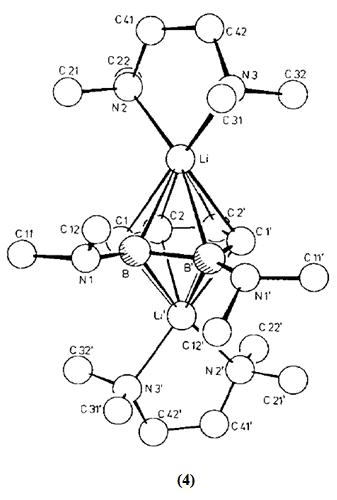
It was found that the subsequent reaction of (3) with N,N,N',N'-tetramethylethylenediamine (TMEDA) gave a crystallisable salt (4) with the shown structure.
The structure of crystallised compound (4) is described[2] as a triple-decker structure with crystallographic C2 symmetry. The structure is considered to be a contact ion triple. The 1,2-diboratabenzene ring is almost planar, a twist conformation with a maximum vertical deviation of 4.2 pm. The C4B2 ring was found to have a delocalised 6π-electron system.
Some selected bond lengths from the structure of (4) are given below:
| Atoms | B-B' | B-C1 | C1-C2 | C2-C2' | B--N1 |
| Bond length (pm) | 170.6(8) | 150.5(6) | 141.3(6) | 141.7(8) | 149.5(5) |
The Li(TMEDA)groups are shifted away from the B atoms in the direction of the atoms shown as C2 and C2'. the acentricity of the bonding (slip distortion) is 14.9 pm.
Aim of the Project
Each of the compounds (1), (2) and (3) will be optimised in succession by Gaussian calculation, the optimisations will be confirmed by frequency analysis and finally the MOs of (1) will be studied.
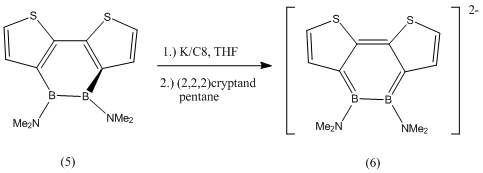
The geometry of the amine -NMe2 substituent will be carefully studied in compounds (2) and (3) because it was found in literature[3] that in the following two compounds (5) and (6), the B-N bond goes from having double bond character in (5) (and thus trigonal planar geometry) to having slightly pyramidalised -NMe2 groups in (6).
It was also noted that the 1,2-diborin ring went from a twisted non-planar structure in (5) with a C1-B1-B2-C4 dihedral angle of 44.5 (deg), to a nearly planar structure in (6) with a dihedral angle of 10.0 (deg).
Therefore it will be of interest to observe whether or not the -NMe2 group pyramidalises upon reduction from (2) to (3), and also whether or not the structure of the 1,2-diborin ring changes from twisted to almost planar.
Optimisation of compound (1)
The structure of (1) was drawn in Gaussview 3 and a Gaussian input file for "optimisation" was created using the method "DFT/B3LYP" and the basis set "6-31G(d,p)". This input file was submitted to SCAN.
When the calculation had finished, the checkpoint file was downloaded and viewed in Gaussview 3.
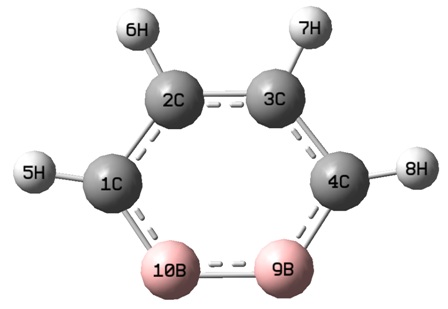
The optimised structure of (1) is given:
The optimised bond lengths are given below:
| 10B-9B | 1C-2C | 2C-3C | 3C-4C | 4C-9B | 1C-5H and 4C-8H | 2C-5H and 3C-7H |
|---|---|---|---|---|---|---|
| 1.56248 | 1.43700 | 1.39366 | 1.43700 | 1.43071 | 1.08384 | 1.0883 |
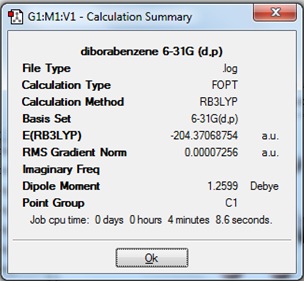
The Summary of the optimisation showed that the gradient had been optimised to very close to zero:
Please note that when viewed in Gaussview 3, the optimised structure of (1) shows a delocalised system in the ring. This has not translated molefile structure.
The output file was viewed to check that the force had converged, the optimisation was completed and the stationary point was found.
http://hdl.handle.net/10042/to-7909
It was concluded that compound (1) had sucessfully found a stationary point on the potential energy curve of the structure.
Frequency Analysis of Optimised (1)
In order to confirm that the minimum energy structure had been found in the previous optimisation, the optimised structure of (1) was used to run a frequency calculation.
To create a new input file, the calculation was set for "Frequency" and the method was kept as "DFT/B3LYP", using a basis set of 6-31G(d,p). The input file was submitted to SCAN.
After the calculation was run, the checkpoint file was opened and viewed in Gaussview. The optimised structure of (1) is given:
http://hdl.handle.net/10042/to-7910
The third double bond in the ring had disappeared during the calculation. This indicated that the structure obtained after the calculation was not aromatic and therefore, was not the desired structure of molecule (1).
The Summary file was opened to check the the total energy after frequency analysis was the same as after optimisation:
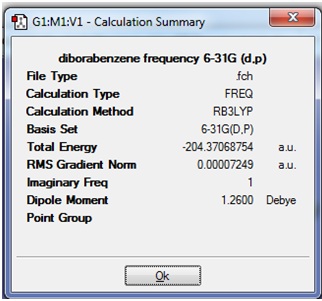
It can be seen that the Energy of structure (1) was the same before and after the frequency optimisation.
Next, the output text file was opened to check whether the frequencies were positive, or close to positive, and therefore whether a minimum energy had been found:
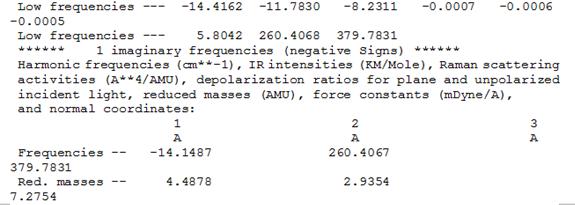
It was concluded that the although optimisation had found a stationary point on the potential energy curve of molecule (1), this stationary point was in fact not the minimum energy point, but was in fact the transition state maximum point. This is known because a few of the "zero" frequencies in the log file are negative, including-14.4162 and -11.7830 cm-1. These values refer to the second derivative of the potential energy curve and it is known that negative values of the second derivative indicate a maximum point.
Usually, very small negative values of "zero" frequencies are acceptable for the types of calculations which are done here, however problems start to arise when these values are larger in magnitude than about -10 cm-1. This is what has occured here, and these large negative "zero" energies have led to a negative vibrational frequency, which is referred to as an imaginary frequency.
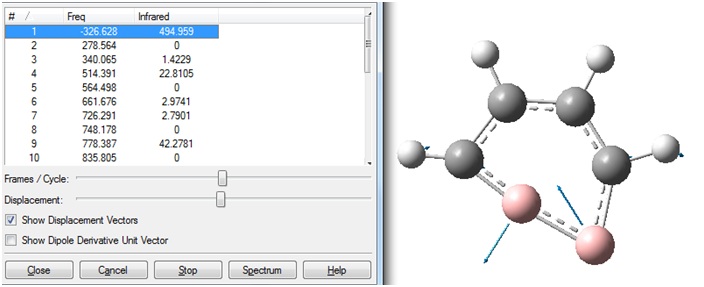
The negative frequency -14.148 cm-1 was shown to corresponds to the vibration shown.
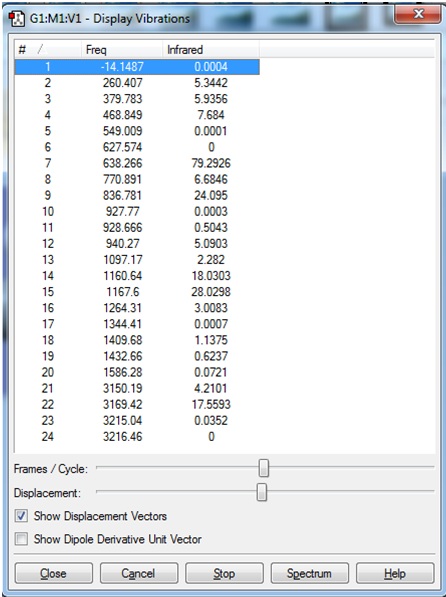
It was therefore concluded that molecule (1) shown prefers to not be planar, since the negative vibrational frequency corresponded to the distortion away from a planar structure.
It was realised that in the optimisation calculation prior to this frequency calculation, the input file had not been edited to include a -2 charge on the structure.
This may have caused the structure to not be recognised as an aromatic, planar molecule, and the subsequent optimisation and frequency calculations therefore caused the structure to prefer to have a non-planar structure, as shown above.
It was decided that a new optimisation should be carried out, with the input file edited to include a -2 charge and therefore, aromaticity.
Optimisation of compound (1) Including Charges
An input file was created for the following structure:
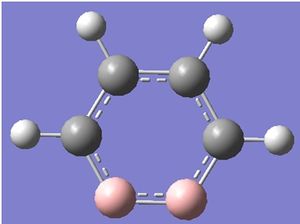
It can be seen that when viewed in Gaussview, the delocalised system with 3 delocalised double bonds can be observed but when the same molecule is saved as a molfile, only 2 double bonds are shown. It was thought that this might be due to a slight difference in the lengths of the bonds in the ring, because it is known that bonds are sometimes defined in terms of distances.
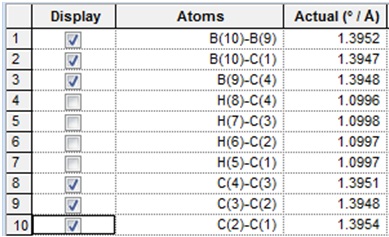
To investigate whether or not the difference between the molecular structure when viewed in Gaussview and when viewed as a molfile was due to distance, the bond lengths were found using ChemBio3D:
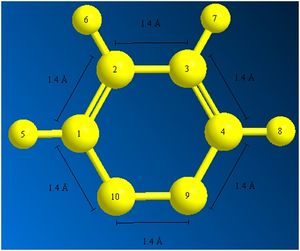
It seems that all of the bond lengths in the ring are almost the same length, and yet the molfile fails to show one of the double bonds in the ring. This is concluded to be a problem in translation of a .mol file type in Gaussview 3.
Using this structure, the input file was created using the same method and basis set as before, and this time the -2 charge was included: DFT/B3LYP, 6-31G(d,p). The additional keywords "opt(maxcycle)=50" was added. The "optimisation" calculation was submitted to SCAN.
When the calculation was complete, the file was downloaded and opened in Gaussview. http://hdl.handle.net/10042/to-7916
The Summary of the optimised molecule (1), including the -2 charges, is given: 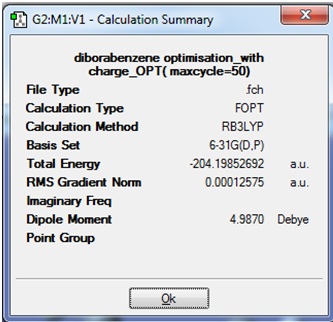
It can be seen that the gradient is very close to zero, which indicates that the optimisation was successful.
The total energy of this structure of (1) cannot be compared to the optimised structure of (1) from the previous experiment because although both molecules contain the same number and type of atoms, and the same method and basis set was used in both calculations; the current optimisation inluded the keywords "opt(maxcycle)=50" whereas the previous calculation did not.
There is a big difference between the Dipole Moment seen here, and that seen previously (4.99 Debye vs. 1.26 Debye respectively). This can be thought to be due to the additional two electrons that have been added to this molecule. NBO analysis could be carried out on this molecule to determine where the electronic charges lie, but first it is neccessary to carry out a frequency analysis to confirm that the optimisation has found a minimum energy structure.
To check that the optimisation was successful, the logfile was opened to check that it showed the following:

This confirmed that a stationary point had been found, and therefore the optimisation was complete.
Frequency Analysis of (1) with Charges
The optimised structure obtained in the previous optimisation was used to create a new input file. The calculation was changed to "frequency" and additional keywords "pop=(full,nbo)" were added. The input file was submitted to SCAN.
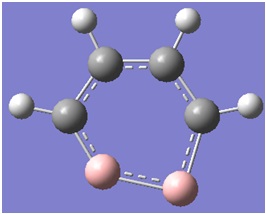
When the calculation was completed, the file was downloaded and viewed in Gaussview 3. The structure of the molecule seemed to be correct after the frequency calculation: http://hdl.handle.net/10042/to-7915
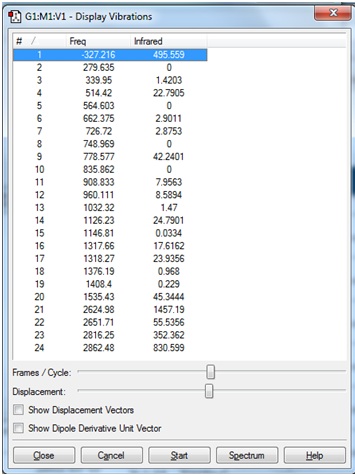
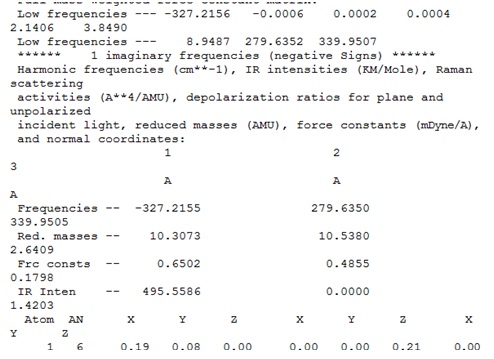
However, when the vibration frequencies were viewed, it was seen that a very large "imaginary" frequency had been calculated: 
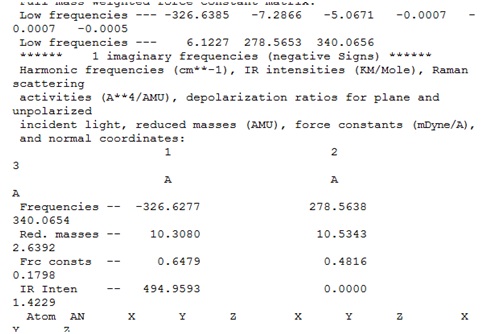
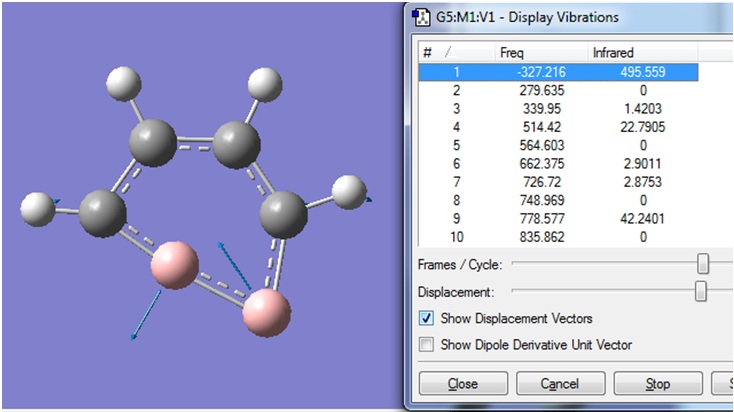
This negative frequency corresponded to the following vibration:
The frequency calculation was attempted once more. A new input file was created, this time with the additional keywords "int=ultrafine scf=conver=9". This was submitted to SCAN.
When the calculation was completed and the file was opened in Gaussview, it was seen that once again a very large "imaginary" frequency had been calculated: http://hdl.handle.net/10042/to-7917
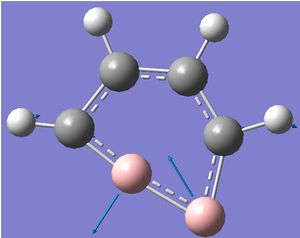
A screen shot of the negative frequency vibration is shown. This vibration is an in-plane distortion in which the two B atoms are mainly altering their bond angles. The bond lengths do not seem to be altered significantly.
This is the same vibration as that was seen in the previous frequency calculation. In both cases, the "zero" frequency in the logfile is a very large negative number (-326.6385 and -327.2155 cm-1). This indicates that the stationary point that was found in the optimisation was a transition state, not a minimum energy structure.
Optimisation of compound (1) - modified bond lengths
It was thought that modifying the structure of the input structure might enable the optimisation to be more successful at finding a minimum energy structure.
The structure of (1) including the -2 charges, which was used in the optimisation in the previous optimisation, was used to give a modified structure.
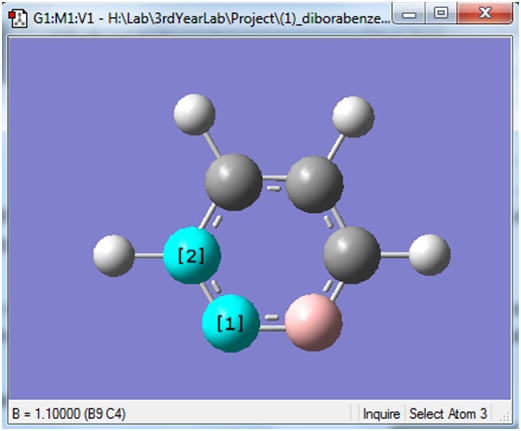
It was seen above that the bond lengths which were automatically assigned to the molecule were all around 1.39 angstrom. These were all manually changed to 1.1 angstrom to give the following structure:
It was noticed that after changing all of the bond lengths in the ring to 1.10 Angstrom, Gaussview automatically changes some of these to slightly higher values, such as 1.16 angstrom. This was considered to be acceptable for the following optimisation, because the aim was to make the bond lengths shorter than the bond lengths in the previous optimisation, 1.39 angstrom.
An input file was created using this structure. The method was kept as DFT/B3LYP and the basis set 6-31G(d,p). It was advised to add the additional keywords "opt=calcfc".
Another input file was created in the same way, with the bonds modified to be 1.50 angstrom, which is longer than they originally were. This was also submitted to SCAN.
When the calculations were completed, the files were downloaded and viewed in Gaussview. It was seen that both calculation had failed. http://hdl.handle.net/10042/to-7918 http://hdl.handle.net/10042/to-7920
The logfile of the first calculation (1.10 angstrom) is given. File:(1) 1 1 logfile fail.rtf
Optimisation of compound (1) - distorted
It was seen from visualisation of the negative frequency obtained from the previous frequency calculation that the molecule (1) was trying to distort into the following geometry:
This is an in-plane vibration in which the B atoms seem to be increasing and decreasing their bond angles.
Therefore an input file was created in which the two B atoms were distorted into the following geometry:
The method used for this optimisation was kept the same as previously, DFT/B3LYP and the same basis set of 6-31G(d,p). The additional keywords "opt=calcfc" were added. This input file was submitted to SCAN.
When the calculation was completed, the file was downloaded and viewed in Gaussview 3. http://hdl.handle.net/10042/to-7921
The logfile showed that the optimisation had found a stationary point, and therefore was successful.
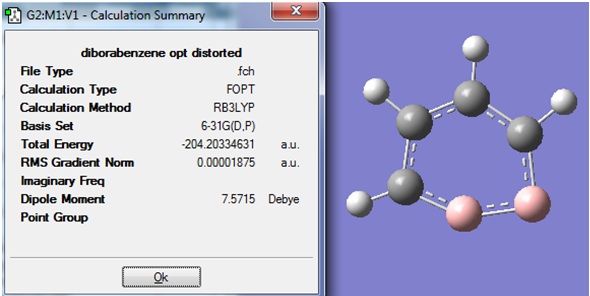
The structure and Summary of the newly optimised molecule (1) is shown:
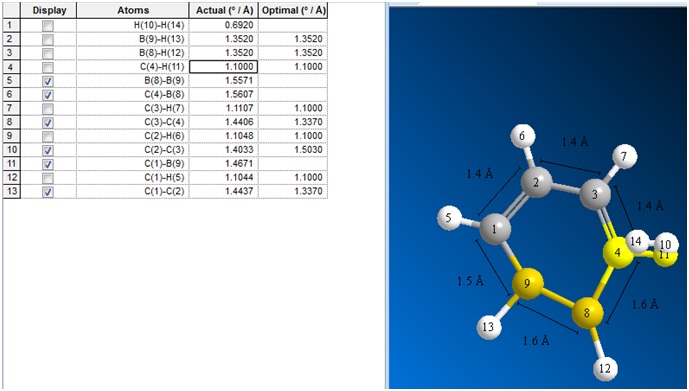
The molfile of this optimised structure was saved and opened up and viewed in ChemBio3D, in order to visualise all the bond lengths.
It can be seen that there is a corruption in the C and H atom labelled 4 and 11. ChemBio3D has also added two H atoms onto the B atoms, which should not be there, and are not shown in Gaussview. The bond lengths were confirmed to be the same in both Gaussview and ChemBio3D, although ChemBio3D reports the distances to fewer decimal places.
The bond lengths show that the B-B bond prefers to be longer than the rest of the bonds in the ring. This distortion may also have caused the B8-C4 bond to become much longer than the others.
The bond angle from atoms 1-9-8 is 147.5 degrees, and the angle from atoms 9-8-4 is 91.7 degrees.
Frequency analysis of (1) after optimisation of Distorted structure
The structure of (1) obtained from the previous optimisation, in which the B-B bond angle was distorted, was used to create a new input file for a frequency calculation.
The method and basis set was kept the same, and the additional keywords "opt=calcfc" were added. This was submitted to SCAN.
When the calculation was completed, the file was downloaded and opened in Gaussview. http://hdl.handle.net/10042/to-7924
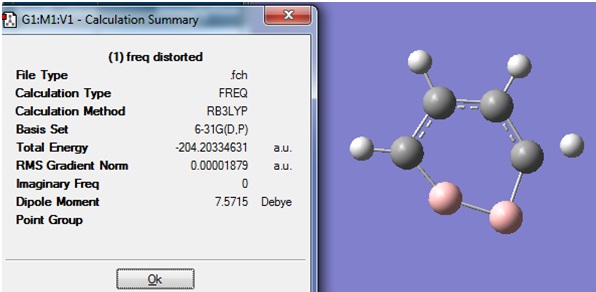
The structure and Summary of the structure obtained is shown:
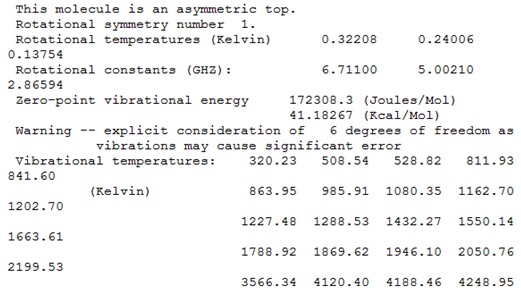
It was seen that no imaginary frequencies had been calculated this time, but one of the C-H bonds had disappeared.
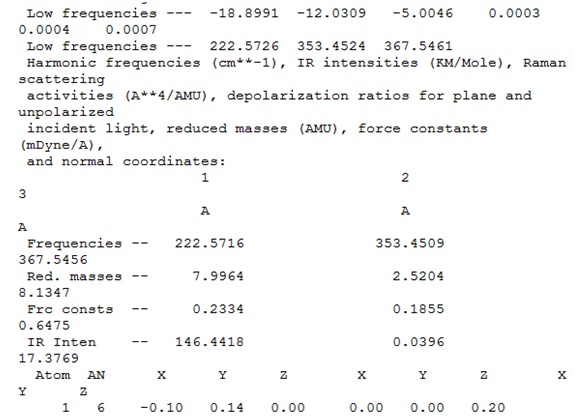
The vibrational frequencies are shown: 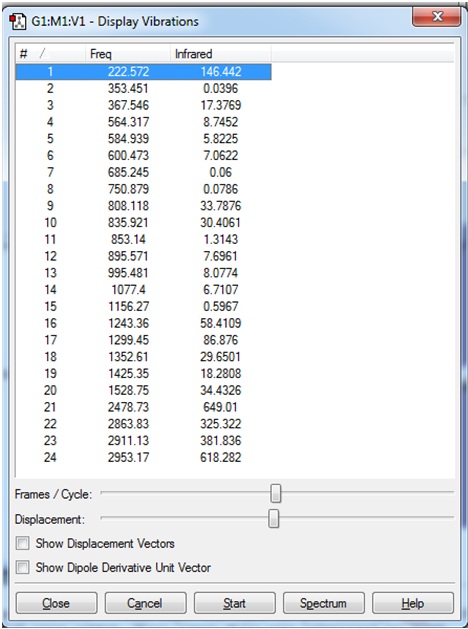
The logfile was checked to ensure that the molecule had successfully optimised:
It was concluded that although some of the "zero" frequencies were rather large, such as -18.8991, and -12.0309 cm-1, none of the "real" frequencies were negative, and therefore the calculated frequencies would be acceptable.
It was also noticed that the logfile contained the following warning:
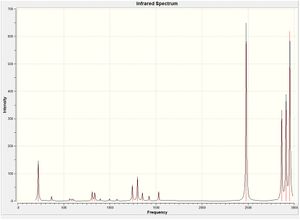
The IR spectrum is shown.
MOs of (1)
The optimised structure of (1) was used to create an input file to calculate the MOs of (1).
The checkpoint file from the optimisation calculation of (1) was opened, and the method was set to "energy", DFT/B3LYP with the same basis set 6-31G(d,p) and the additional keywords "pop=full" were added. the "full NBO" tab was selected. This was submitted to SCAN.
When the calculation was completed, the checkpoint file was downloaded and viewed in Gaussview 3. http://hdl.handle.net/10042/to-7931
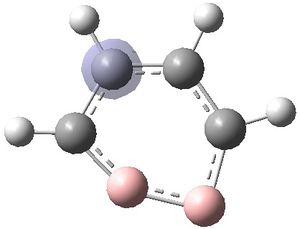
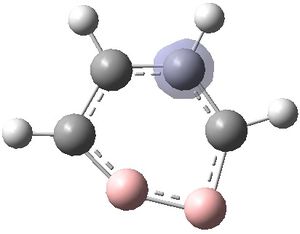
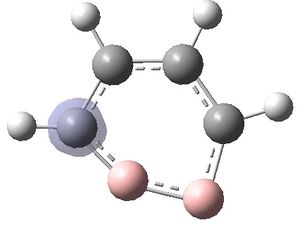
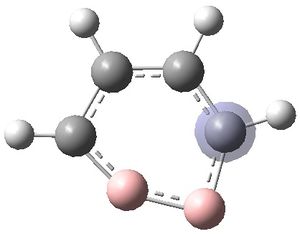
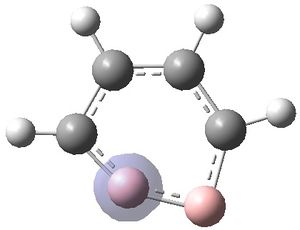
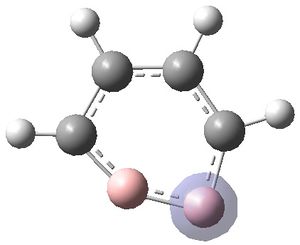
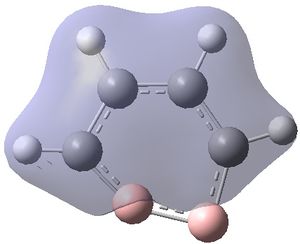
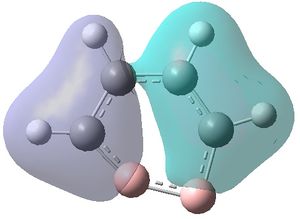
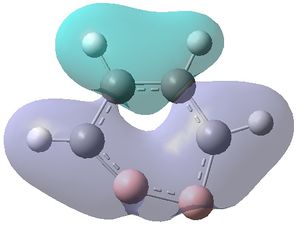
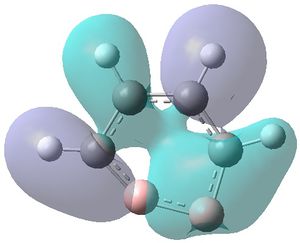
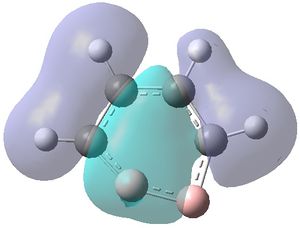
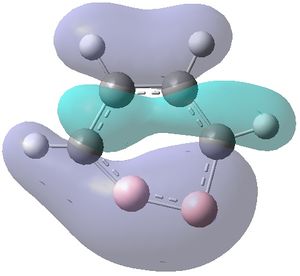
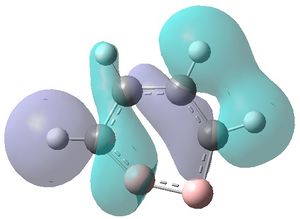
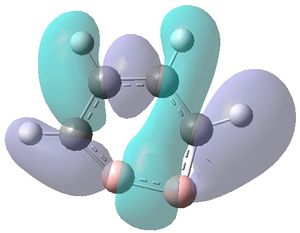
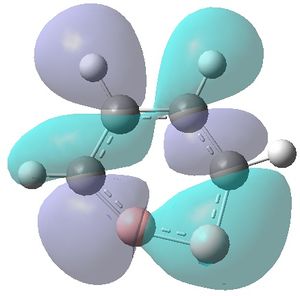
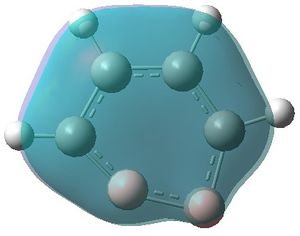
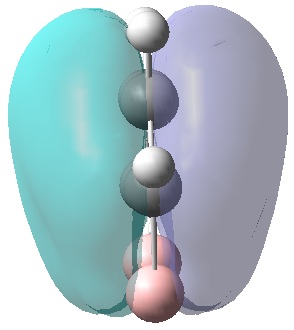
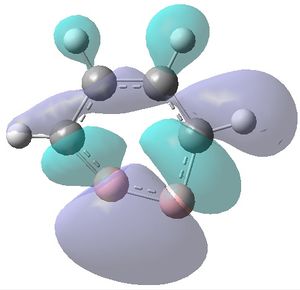
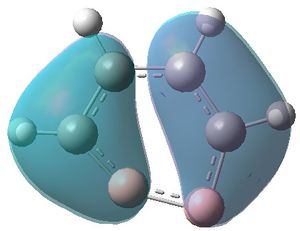
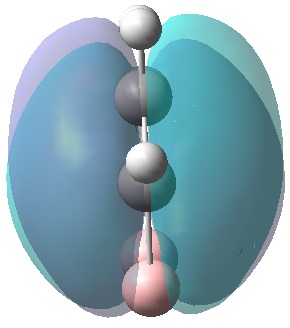
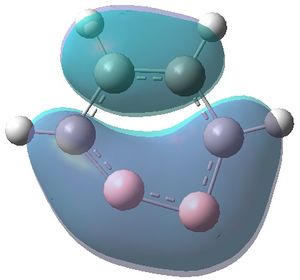
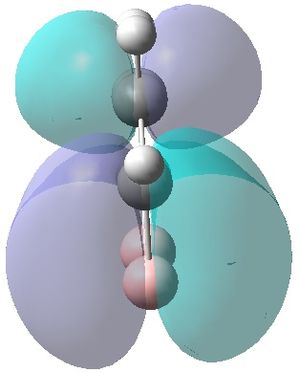
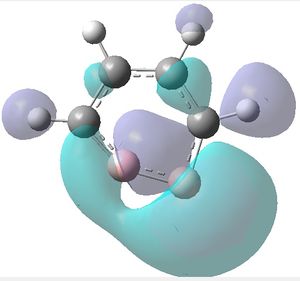
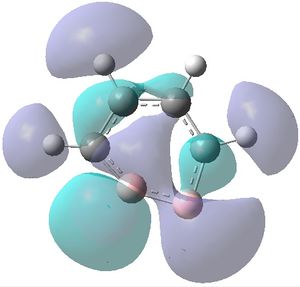
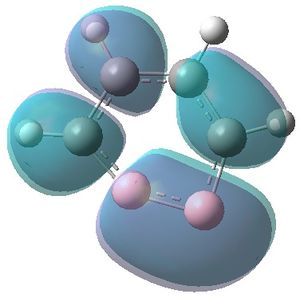
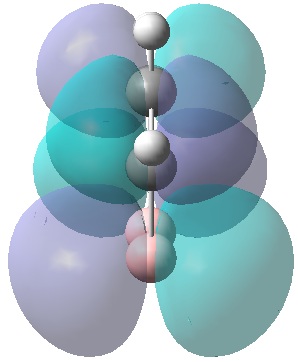
The MOs were visualised and are shown below.
 |
 |
 |
 |
 |
 |
 |
 |
 |
 |
 |
 |
 |
 |
 |
 |
 |
 |
 |
 |
 |
 |
 |
 |
 |
 |
| MO 1 | MO 2 | MO 3 | MO 4 | MO 5 | MO 6 | MO 7 | MO 8 | MO 9 | MO 10 | MO 11 | MO 12 | MO 13 | MO 14 | MO 15 | MO 16 | MO 17 | MO 18 | MO 19 | MO 20 | MO 21 | MO 22 |
|---|---|---|---|---|---|---|---|---|---|---|---|---|---|---|---|---|---|---|---|---|---|
| -9.799 | -9.786 | -9.775 | -9.770 | -9.287 | -6.243 | -0.397 | -0.297 | -0.223 | -0.121 | -0.111 | -0.033 | -0.004 | 0.027 | 0.045 | 0.068 | 0.147 | 0.178 | 0.229 | 0.282 | 0.389 | 0.419 |
https://wiki.ch.ic.ac.uk/wiki/skins/common/images/button_bold.png
It can be seen that MOs 1-6 are simply the atomic s-orbitals of the C and B atoms in the ring, with the lowest energy one of these MOs (MO 1) being located on the C atoms which is furthest away from the B atoms, and the highest energy one of these MOs (MO6) being located on the B atom which is the most "distorted" out of the ring.
This agrees with simple ideas of electronegativity because it is expected that the most electronegative and therefore lowest energy atom will feature the lowest energy MO. In this case, C atoms are more electronegative and therefore lower energy than B atoms, and hence the lowest energy MOs are located on the C atoms.
MOs 7-15 result from the various in-phase and out-of-phase interactions between the atomic orbitals in the molecule, with the number of nodes increasing with increasing energy. Thus MO 7 has no nodes; MO 8 and 9 have one node; MO 10, 11 and 12 have two nodes; MO 13 has three nodes; and MOs 14 and 15 have a more complicated phase distribution, with more repulsive interactions than the previou MOs.
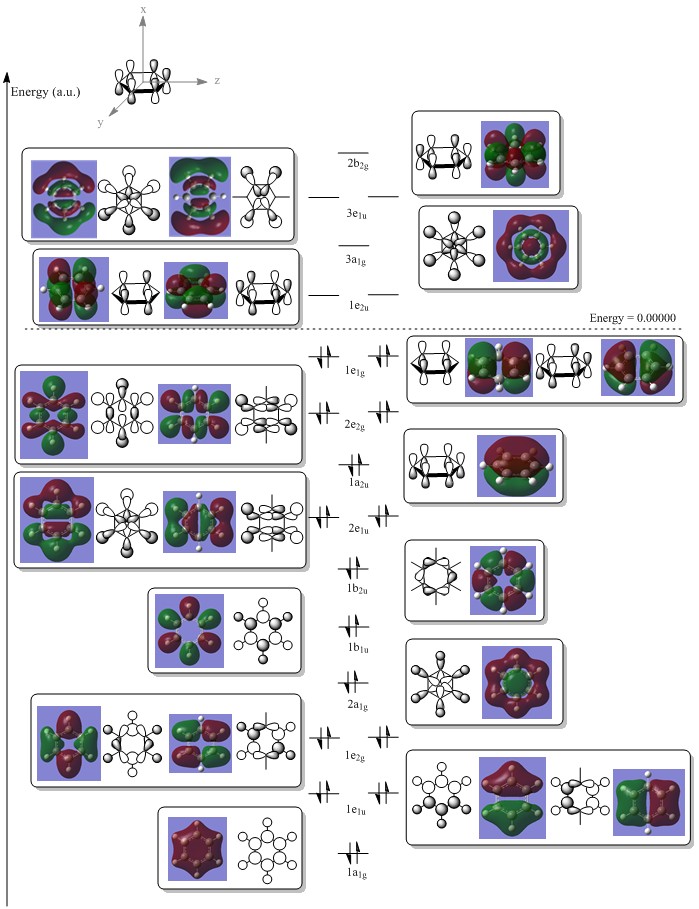
MO 16 begins to resemble the the predicted LCAO MO for benzene, shown below. MO 16 is seen to strongly resemble MO 1 for benzene, with one single node going along the plane of the ring.
MO 18 and 19 seem to resemble MO 2 and 3 for benzene.
MO 17 may be roughly matched up to MO 4 for benzene, because two adjacent C atoms and two adjacent B atoms are the same phase, whereas the remaining two C atoms on the opposite sides of the ring to each other are a different phase. However, a very large difference between MO 17 and benzene's MO 4 lies in the fact that MO 17 does not have a node going along the plane of the ring, which suggests that this MO is formed from atomic s-orbitals instead of p-orbitals.
Similarly, MO 20 and 21 can be matched up to MO 5 and 6 for benzene, but again, MO 20 and 21 seem to derive from s-AOs, not p-AOs as in benzene.
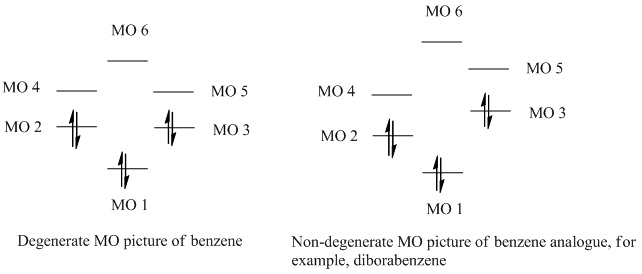
It is interesting that the ordering of diborabenzene MOs is slightly different to the predicted ordering of benzene MOs using LCAO, and this may be explained by the fact that diborabenzene is much less symmetrical than benzene, and therefore although the predicted LCAO MO diagram will resemble that of benzene, the degeneracy that exists for benzene will no longer exist for diborabenzene. This loss of degeneracy for benzene analogues is shown in the diagram below.
The LCAO MO diagram of benzene may be used to predict that of diborabenzene (1):
It is known that for benzene analogues, when one or more of the C atoms are substituted by different atoms, the degeneracy of the MO diagram is lost, due to a loss of symmetry of the molecule:
The idea of HOMO and LUMO does not really correlate the MOs of diborabenzene and benzene, because the HOMO/LUMO occurs at MO 20 and 21 for diborabenzene, compared to MO 2/3 and 4/5 for benzene. This observation can be rationalised by the argument that upon going from benzene to diborabenzene, symmetry has been lost and therefore the MOs have lost degeneracy, making it difficult to predict the relative ordering of MOs in a diborabenzene LCAO diagram and therefore making it difficult to predict which orbitals will be the HOMO and LUMO.
It should also be noted that the zero energy occurs somewhere between MO 13 and 14 in diborabenzene, compared to between MO 2/3 and 4/5 in benzene. This may suggest that the overall energy of diborabenzene is higher than benzene, however explicit comparisons will not be made here.
Optimisation of compound (2)
Compound (2) was drawn in Gaussview, using the optimised structure of (1), and a new input file was created. The method was kept the same as the previous optimisation: DFT/B3LYP, 6-31G(d,p). An additional input file was created including the additional keywords "opt(maxcycle)=50", to ensure that the calculation would not run for too long and would converge within 50 cycles. Both input files were submitted to SCAN.
When the calculation was finished, the log file was downloaded and viewed in Gaussview. It was found that the both of the calculations including and excluding the additional keywords "opt(maxcycle)=50" gave the same optimised structure, with the same energies. Therefore it was concluded that the structure of molecule (2) would be able to undergo optimisation calculations within 50 iterations.
http://hdl.handle.net/10042/to-7927
The structure of the optimised molecule (2) is given here.
The Summary of the optimisation is shown: 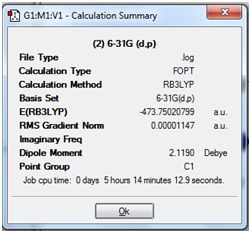
To check that the calculation had converged and therefore optimised properly, the log text file was opened to confirm that it showed the following:

Frequency Analysis of Optimised (2)
The structure of (2) obtained from the previous successful optimisation was used to create a new input file for frequency calculation. The method and basis set was kept the same, and the additional keywords "pop=(full,nbo)" were added. This input file was submitted to SCAN.
After the calculation was finished, the checkpoint file was downloaded and viewed in Gaussview.
http://hdl.handle.net/10042/to-7928
The Summary of the obtained structure is shown:
It can be seen that no "imaginary" frequencies were calculated.
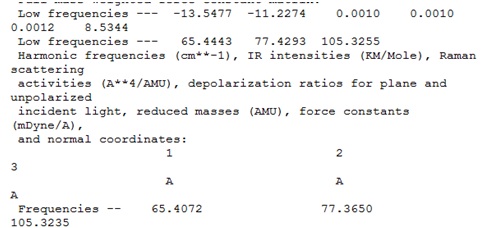
The logfile was checked to ensure that "zero" frequencies were not very large and negative. A section of the logfile is given:
It can be seen that one of the "zero" values (-13.5477) is less negative than the -10 limit. However, all of the values for vibrational frequencies were found to be positive, and so it was concluded that molecule (2) had optimised well and a minimum energy geometry was found.
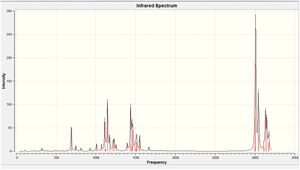
The IR spectrum that was obtained from the frequency calculation is shown.
Geometry Analysis of Optimised (2)
One of the aims of this project was to compare the structure of (2) with (3) to see whether or not, upon reduction of (2), the N atoms rehybridise to go from a trigonal planar to a pyramidal geometry.
Therefore the following analysis will look at the bond lengths and the dihedral angles of the optimised structures of (2) and (3), as well as the geometry around the N atom.
First of all, it can be seen that the 6-membered ring is not planar, with one of the B atoms lying above the plane of the ring, and the other B atom slightly below the plane. Similarly, each of the the N-groups attached to the B atoms are also pointing up and down, respectively.
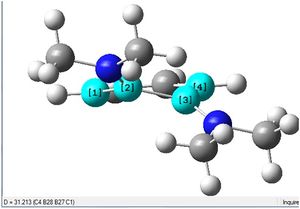
The C-B-B-C dihedral angle was found to be 31.2 degrees, as shown.
It was also seen that each of the N-groups were trigonal planar as expected, shown.
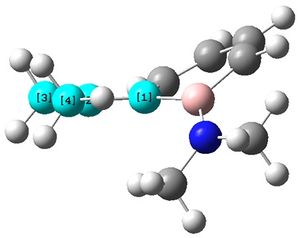
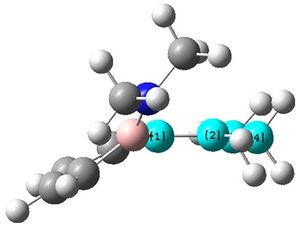
The bond lengths of the optimised structure of (2) were visualised in ChemBio3D:
The above data and observations will be compared with the optimised structure of (3) in the following exercise.
Optimisation of compound (3)
The optimised structure of (2) was modified and then used to create a new input file for compound (3). The 6-membered ring was modified to include a delocalised 6-pi electron system, and when the input file was being created, all methods for the "optimisation" were kept as "DFT/B3LYP" and the basis set as "6-31G(d,p)", and an additional -2 charge was added to the input file. The structure of (3) before optimisation is shown:
After the calculation was finished, the output file was downloaded and viewed in Gaussview. http://hdl.handle.net/10042/to-7930
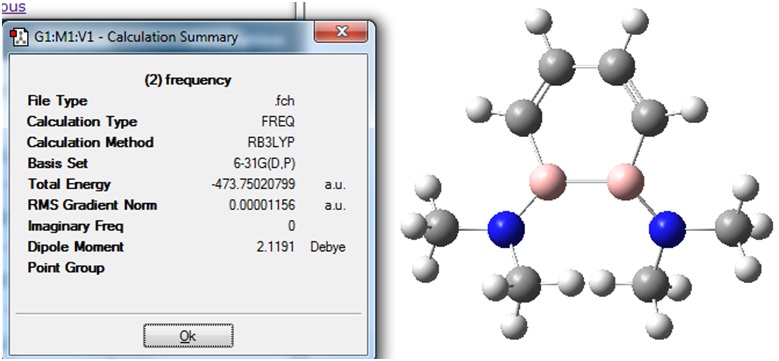
The optimised structure molecule (3) is shown
The Summary from the optimisation is shown: 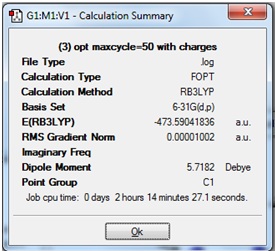
The output file was checked to see that the energy had converged and that a stationary point had been found:
The gradient was seen to be zero, and the lofile showed that the stationary point had been found. Therefore it was concluded that a stationary point had been sucessfully found.
Frequency analysis of optimised (3)
In order to confirm that the previous optimisation of (3) was successful, a frequency input file was created using the optimised structure of (3).
The calculation was changes to "frequency", the method and basis set was kept the same as for the "optimisation", and the additional keywords "pop=(full,nbo)" were added. This was submitted to SCAN.
When the calculation was completed, the file was downloaded and viewed in Gaussview:
The Summary file was checked to see that the total energy was the same as the optimised structure of (3), which was used to create the input file for frequency calculation:

It can be seen that the Total Energy of the molecule after the frequency calculation was the same as that after optimisation, confirming that the frequency calculation had been done on the correct structure, and no Imaginary Frequencies were calculated.
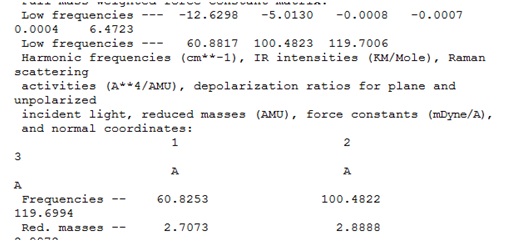
The output file was checked to see study the "zero" frequencies:
The absence of negative "real" frequencies meant that the calculated frequency values could now be analysed. There was however the presence of a "zero" frequency with the negative value -12.6298. This is just outside of the -10 limit, and it has not led to any negative vibrational frequency values. Therefore, it was concluded that the structure of (3) had been successfully optimised to obtain the lowest energy geometry, and the structure of (2) can subsequently analysed.
The calculated IR spectrum is shown.
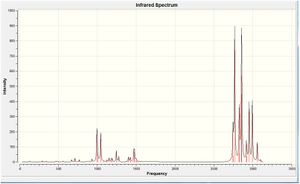
Geometry Analysis of (3)
The ring structure of the optimised molecule of (3) was now seen to be almost completely planar:
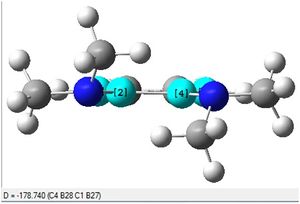
The C-B-B-C dihedral angle is seen to be 178.7 degrees, which is very close to 180 degrees. This suggests that the molecule (3) has gained aromaticity upon reduction from (2) because one of the definitions of aromaticity is planarity.
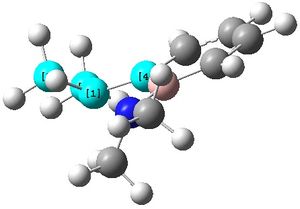
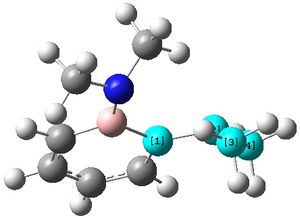
The two N-groups can now be seen to have a pyramidal structure as shown, compared to in molecule (2) when they were almost completely planar.
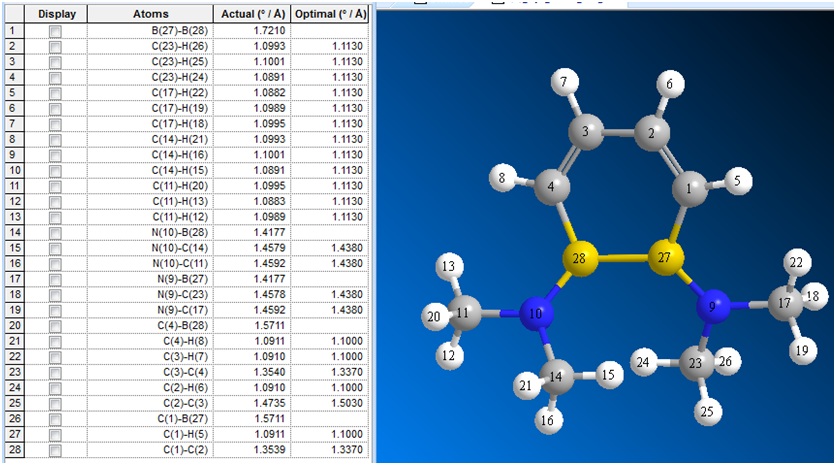
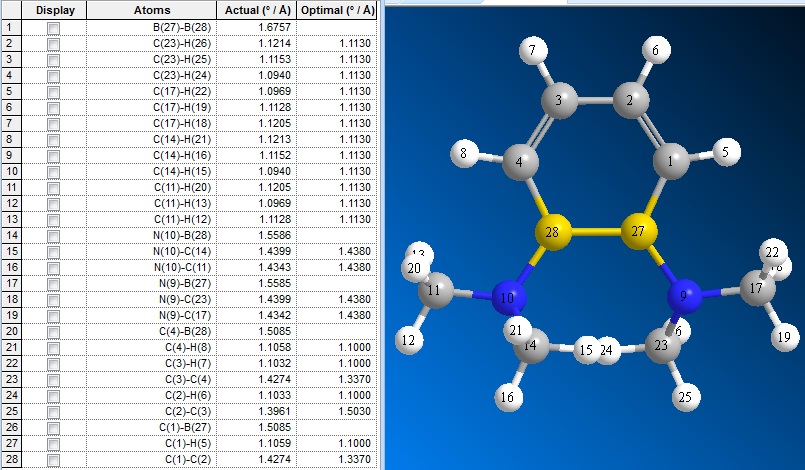
The bond lengths of (3) were visualised in ChemBio3D:
| C1-C3 | C1-C2 | C2-C4 | C3-B5 | C4-B6 | B5-B6 | B5-N7 | B6-N8 | |
|---|---|---|---|---|---|---|---|---|
| (2) | 1.35 | 1.47 | 1.35 | 1.57 | 1.57 | 1.72 | 1.42 | 1.42 |
| (3) | 1.43 | 1.40 | 1.43 | 1.51 | 1.51 | 1.68 | 1.56 | 1.56 |
| (4) lit.[2] | 1.41 | 1.42 | 1.41 | 1.51 | 1.51 | 1.71 | 1.50 | 1.50 |
In (2), there are large variations between the C-C bond lengths in the ring (1.35 vs 2.47 A), whereas upon reduction to form (2), the difference between the C-C bond lengths are smaller (1.43 vs 1.40 A).
It can also be seen that upon reduction of (2), both the C-B and B-B bond lengths are shortened, whereas the B-N bond lengths are lengthened.
The lengthening of the B-N bond agrees well with the idea that the N-group has rehybridised upon going from (2) to (3) due to the lone pair donation in (2) because. The B-N goes from having a double bond sp2 character to having a single bond sp3 character, and therefore the bond length shortens. This was supported by studying the geometry around the N group in (2) compared to in (3), when the geometry changed from trigonal planar to pyramidal.
Comparison of the bond lengths of (3) with the literature crystal (4) shows that the bond lengths calculated in this exercise are in agreement with experimental values. This demonstrates that the computational methods used in this exercise are powerful enough to give very realistic values for bond lengths.
Conclusion
In conclusion, it has been found that the reduction of (2) does indeed lead to a change in geometry about the N group, and this may be explained by study of the lone pairs on the N atom. Further study into the behaviour of the N lone pair in (2) and (3) could include NBO analysis of (2) and (3).
The ring geometry was found to gain planarity upon going from (2) to (3) and this suggests an increase in aromatic character.
The MOs of (1) were also found to show resemblances to benzene, which was expected because both molecule are isoelectronic to one another. However, many difference were also found between the MOs of both compounds due to the effect of substituting difference atoms into the ring system of benzene, and thus the removal of degeneracy.


