JoeWiki1
Year 2 Inorganic comp labs
BH3
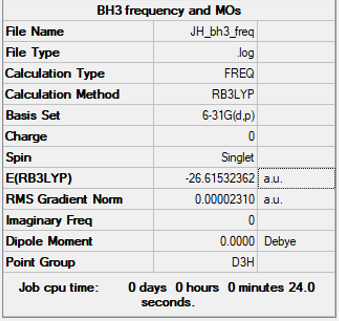
Method= RB3LYP, Basis set= 6-31G(d,p), Symmetry= D3h
Item Value Threshold Converged?
Maximum Force            0.000203     0.000450     YES
RMS     Force            0.000098     0.000300     YES
Maximum Displacement     0.000849     0.001800     YES
RMS     Displacement     0.000415     0.001200     YES
Link to frequency file: File:JH BH3 FREQ.LOG
Ng611 (talk) 13:00, 5 June 2019 (BST) This is an opt+freq file, not a pure freq file. You should do the optimization and frequency analysis as separate calculations.
Low frequencies --- -0.4072 -0.1962 -0.0055 25.2514 27.2430 27.2460
Low frequencies --- 1163.1897 1213.3128 1213.3155
Optimised BH molecule |
Vibration Data
| Stretch or Bend? | Intensity | Symmetry | IR active? | Wavenumber(cm-1) |
|---|---|---|---|---|
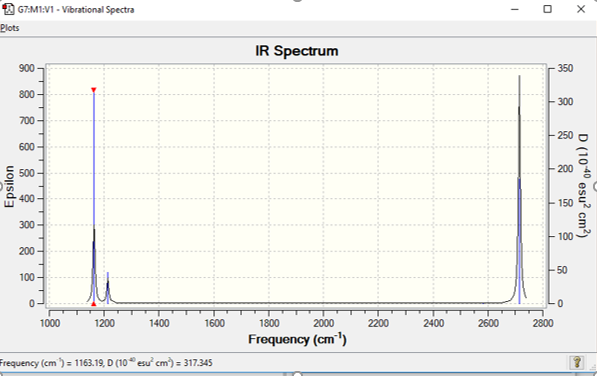
| Bend | 92 | A2" | Yes | 1163 |
| Bend | 14 | E' | Yes | 1213 |
| Bend | 14 | E' | Yes | 1213 |
| Symmetric Stretch | 0 | A1' | No | 2581 |
| Asymmetric Stretch | 126 | E' | Yes | 2714 |
| Asymmetric Stretch | 126 | E' | Yes | 2714 |
Ng611 (talk) 13:02, 5 June 2019 (BST) are your bending modes in-plane or out-of-plane?
Spectrum shows 3 peaks out of 6 vibrational modes given by BH3 shown in table. 1 is IR in active leaving 5 as it causes no change in dipole in the molecule. Two pairs in the 5 are degenerate meaning they have the same energy and therefore overlap, meaning only 3 peaks show.
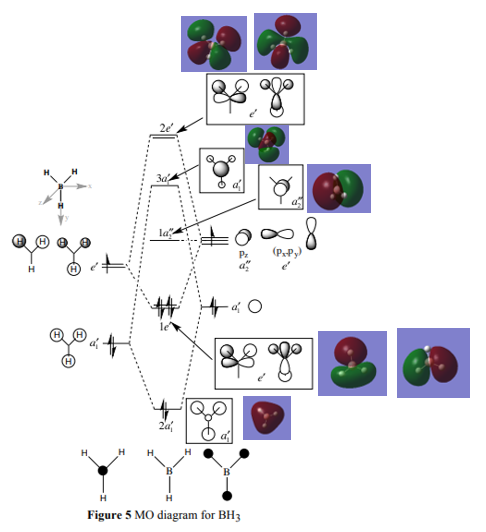
The LCAOs seem very accurate as they depict AOs which combine to form the real MOs very well. Minor issues arise from the fact that it can be said that the overlapping of the orbitals may not be able to be seen fully and the fact that the sizes of the AOs, which represents contribution isn’t consistent. Hydrogen is more electronegative then boron and is therefore lower in energy. Hydrogen should be contributing more to the bonding orbitals and born should be contributing more to the anti-bonding orbitals but for some of them this might not be able to be seen accurately. This shows that the LCAO is a useful tool for finding what a real MO would look like.
Ng611 (talk) 13:04, 5 June 2019 (BST) You're on the right track with this explanation; qualitative MO theory does not always correctly predict orbital contributions. Think about which individual orbital contributions are incorrect and what this tells you.
NH3
Method= RB3LYP, Basis set= 6-31G(d,p)
        Item               Value     Threshold  Converged?
Maximum Force            0.000013     0.000450     YES
RMS     Force            0.000006     0.000300     YES
Maximum Displacement     0.000039     0.001800     YES
RMS     Displacement     0.000013     0.001200     YES
Link to frequency file: File:NH3 OP JH.LOG
Low frequencies --- -8.5628 -8.5571 -0.0047 0.0454 0.1785 26.4189
Low frequencies --- 1089.7603 1694.1865 1694.1865
Optimised NH molecule |
NH3BH3
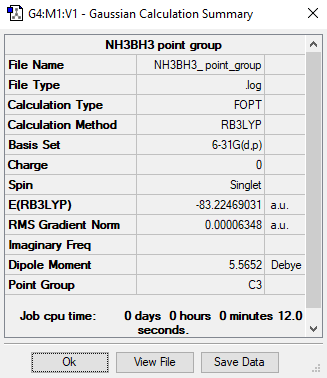
Method= RB3LYP, Basis set= 6-31G(d,p)
        Item               Value     Threshold  Converged?
Maximum Force            0.000122     0.000450     YES
RMS     Force            0.000058     0.000300     YES
Maximum Displacement     0.000514     0.001800     YES
RMS     Displacement     0.000296     0.001200     YES
Link to frequency file: File:NH3BH3 FREQ NEW.LOG
Low frequencies --- -0.0005 0.0003 0.0014 16.7270 18.7414 42.2600
Low frequencies --- 266.2799 632.3010 639.2486
Optimised NH3BH3 molecule |
Association energies
E(NH3)= -56.55776863 a.u.
E(BH3)= -26.61532362 a.u.
E(NH3BH3)= -83.22469031 a.u.
ΔE=E(NH3BH3)-[E(NH3)+E(BH3)], Therefore ΔE= (-83.22468960) - [(-56.55776863)+(-26.61532362)]= -0.05159806 a.u. (-134 KJ/Mol)
Ng611 (talk) 13:11, 5 June 2019 (BST) you've got the right value here in a.u. but your conversion is off.
The B-N dative bond is weak and this shown when compared to the Al-N bond which has an energy of 297KJ/Mol [2]
Ng611 (talk) 13:11, 5 June 2019 (BST) Why this particular bond? Can you provide a rationalisation?
NI3
Method= RB3LYP, Basis set= Gen
        Item               Value     Threshold  Converged?
Maximum Force            0.000102     0.000450     YES
RMS     Force            0.000075     0.000300     YES
Maximum Displacement     0.000858     0.001800     YES
RMS     Displacement     0.000629     0.001200     YES
Link to frequency file: File:NEW NI3 JH.LOG
Low frequencies --- -12.3845 -12.3781 -5.6129 -0.0040 0.0194 0.0711
Low frequencies --- 100.9307 100.9314 147.2333
Optimised NI molecule |
The optimised B-I bond distance is 2.18 angstrom
Ng611 (talk) 13:21, 5 June 2019 (BST) Bond lengths should be reported to 3 d.p.
Days 2 and 3 Project: Metal carbonyls
This sections of the wiki page focuses on metal carbonyls, more specifically their bond-lengths and CO bond frequencies. The metal-complexes which will be focused on are [Cr(CO)6], [Mn(CO)6]+ and [Fe(CO)6]2+. These were chosen as they come one after another in the d-block so it would be interesting to see how bond-lengths and bond frequencies vary across the period. 2 of the complexes are charged (positively) while one is neutral and this is something which must be taken into account when analysing bond-lengths and bond frequencies. An initial prediction would be that bond length increases across a period (as the metal complexes are becoming more positive meaning less overlap with the CO pi* and overall less back-donation and since back donation strengths the M-C bond less of this means an increases in bond length) and that bond frequencies increases.
[Cr(CO)6]
Method= RB3LYP, Basis set= 6-31G(d,p) CO and LanL2DZ for Cr
Item Value Threshold Converged?
Maximum Force            0.000110     0.000450     YES
RMS     Force            0.000041     0.000300     YES
Maximum Displacement     0.000705     0.001800     YES
RMS     Displacement     0.000334     0.001200     YES
Link to frequency file: File:CR(CO)6 JH 2.LOG
Low frequencies --- -0.0014 -0.0013 -0.0010 11.7482 11.7482 11.7482
Low frequencies --- 66.6574 66.6574 66.6574
Optimised Cr(CO) molecule |
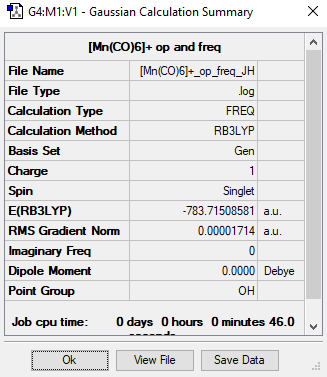
[Mn(CO)6]+
Method= RB3LYP, Basis set= 6-31G(d,p) CO and LanL2DZ for Mn
        Item               Value     Threshold  Converged?
Maximum Force            0.000054     0.000450     YES
RMS     Force            0.000024     0.000300     YES
Maximum Displacement     0.000430     0.001800     YES
RMS     Displacement     0.000204     0.001200     YES
Link to frequency file: File:-MN(CO)6-+ OP FREQ JH.LOG
Low frequencies --- -0.0007 0.0006 0.0009 4.7607 4.7607 4.7607
Low frequencies --- 76.3202 76.3202 76.3202
Optimised [Mn(CO)] molecule |
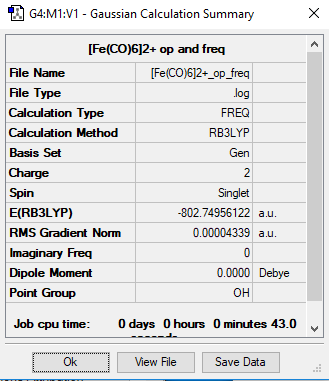
[Fe(CO)6]2+
Method= RB3LYP, Basis set= 6-31G(d,p) CO and LanL2DZ for Fe
        Item               Value     Threshold  Converged?
Maximum Force            0.000054     0.000450     YES
RMS     Force            0.000024     0.000300     YES
Maximum Displacement     0.000429     0.001800     YES
RMS     Displacement     0.000200     0.001200     YES
Link to frequency file: File:-FE(CO)6-2+ OP FREQ.LOG
Low frequencies --- -10.5293 -10.5293 -10.5292 -0.0014 -0.0011 -0.0009
Low frequencies --- 82.1285 82.1285 82.1285
Optimised [FE(CO)] molecule |
Analysing properties
| Metal complex | Bond Length(Å) |
|---|---|
| [Cr(CO)6] | 1.915 |
| [Mn(CO)6]+ | 1.908 |
| [Fe(CO)6]2+ | 1.940 |
The table above shows the bond metal centre-carbon bond lengths. It shows a decrease moving from Cr to Mn and from Mn to Fe there is an increase. This initial decrease in M-C bond length goes against what was predicted but after speaking to Professor Hunt it turns out a full explanation of this decrease in bond length is too complex for the course and so wont be provided.The later drastic increase is due to a contraction of the d-orbitals causing greater repulsion between the electrons leading to poorer overlap with the CO orbitals meaning less back-bonding and and weaker, so therefore longer, metal-carbon bonds. This agrees with the prediction made earlier.
| Metal complex | Intensity | Vibration type | Wavenumber(cm-1) |
|---|---|---|---|
| [Cr(CO)6] | 1637 | symmetric stretch | 2086 |
| [Mn(CO)6]+ | 879 | symmetric stretch | 2199 |
| [Fe(CO)6]2+ | 272 | symmetric stretch | 2297 |
This table above shows the wave-number and intensity all the IR active symmetric stretches of all the metal complexes CO ligands. As each complex has 13 atoms it is expected to have 3(13)-6= 33 vibrational modes but as shown in the vibrational spectra below many of these modes are IR inactive and have intensities of 0, an example of this is the totally symmetric C-O vibrations meaning they cannot be analysed given the fact that they don't appear. As predicted earlier across the period CO bond frequency would increase and this is due to back donation. Whilst back bonding causes an increase in the M-C bond there is also a increase in the CO bond length. The more positive the metal centre means contraction of the d-orbitals and this means that their is a less overlap between the d-orbital and CO pi* orbital and the less overlap with this orbital the stronger the CO bond.
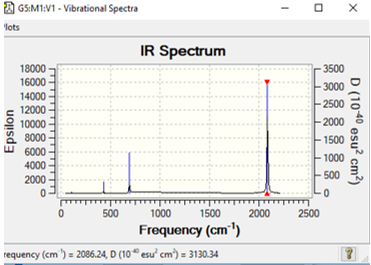
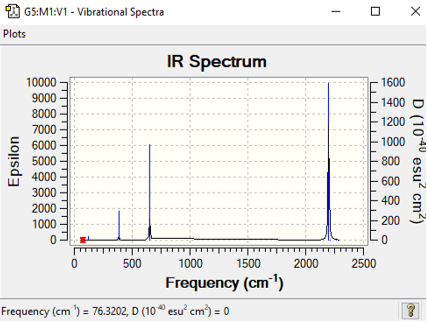
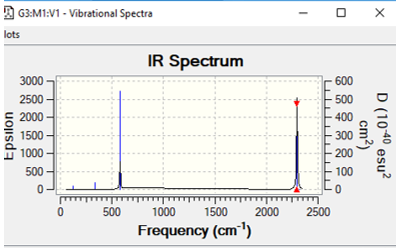
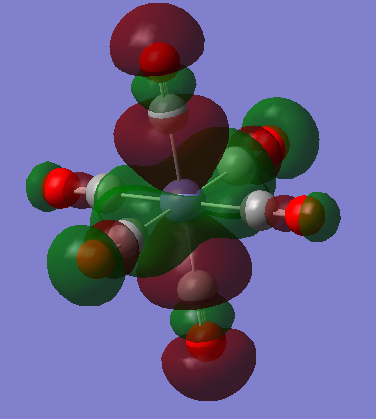
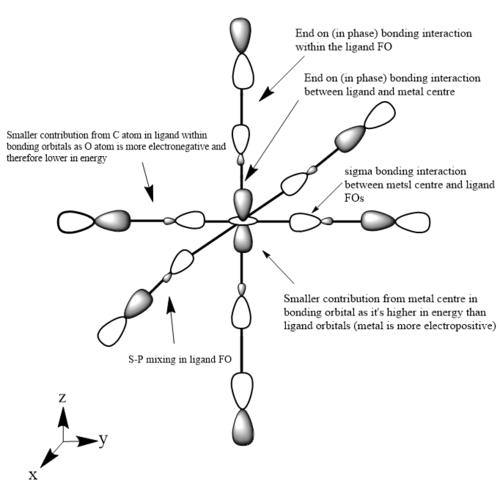
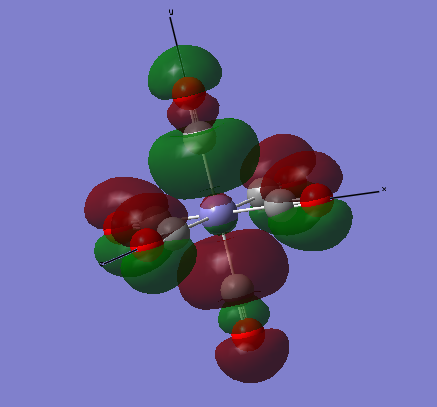
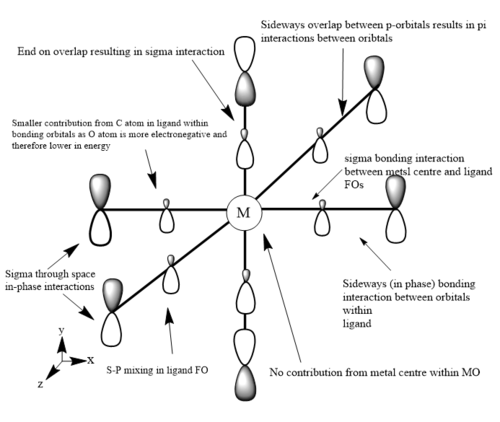
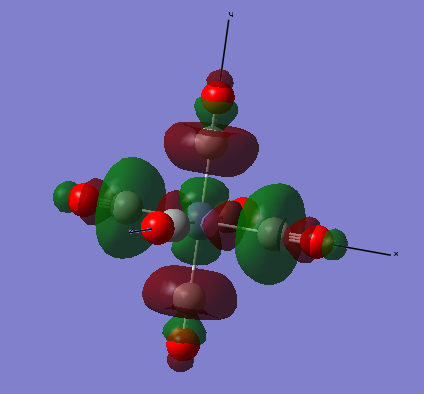
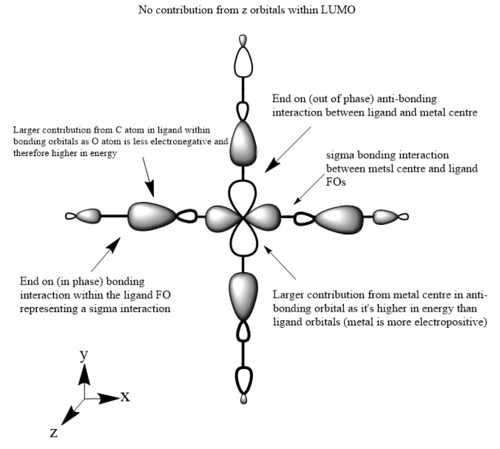
The images below are three of the molecular orbitals of the [Fe(CO)6]2+ complex with the corresponding LCAO drawn beside them. Also on the diagrams of the LCAOs there are annotations analysing the structure.
bonding MO 36 (eg)
bonding MO 46 (t1g)
Ng611 (talk) 13:20, 5 June 2019 (BST) Does your central metal ion have an s-orbital? It looks more p-like to me...
anti-bonding MO 50 (LUMO/eg)
Ng611 (talk) 13:20, 5 June 2019 (BST) Excepting MO46, your MO analysis was on point, well done!
References
[1]- Hunt. T, [online] Huntresearchgroup.org.uk, Available at: http://www.huntresearchgroup.org.uk/teaching/teaching_comp_lab_year2a/Tut_MO_diagram_BH3.pdf [Accessed 20 May 2019].
[2]- T. L. Cottrell,The Strengths of Chemical Bonds,2nd ed, Butterworth, London, 1958

