Jnchen
H + H2 System
Dynamics from Transition State Region
Transition state is the local maximum on the minimum energy path, so ∂V(r1)/∂r1=0, and ∂V(r2)/∂r2=0, which means transition state is at the energy minimum. However, the trajectory at the transition state is the local maximum on the minimum energy pathway, which enables the transition structure to roll towards reactants and products easily. Therefore, minima and transition structure can be distinguished by taking the secondary derivative. For minimum point, the secondary derivative should be higher than 0. However, at transition state, it is the maximum point, where ∂V2(q1)/∂q12<0, on the minimum energy path, where ∂V2(q2)/∂q22>0. So this point is the cross point of two curves with two secondary derivative values.
Trajectories from r1 = r2
rts = 0.9077500
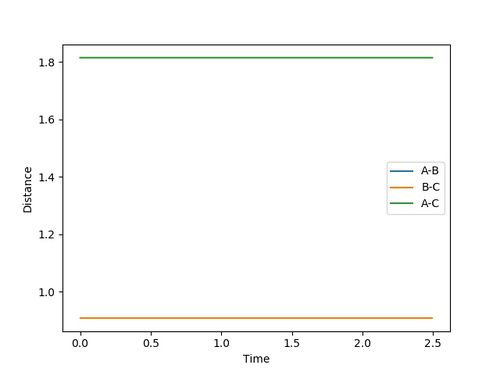
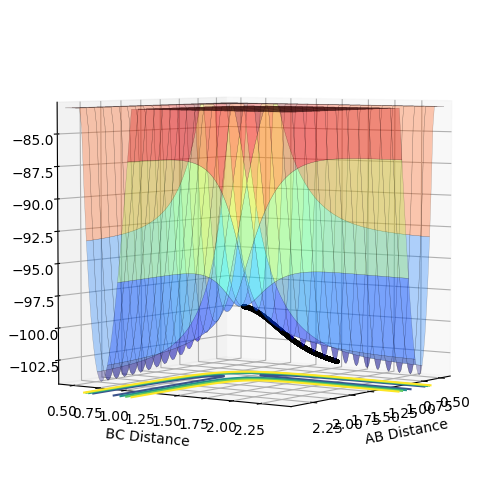
Because the trajectory stars at transition state, there is no initial momentum. The distance between three atoms, r1 and r2 are the same, and will stay the same without rolling to any other directions. Therefore, on the Internuclear Distances vs Time plot, distances between A-B, r2, and B-C, r1, stay constant at 0.9077500, and distance between A-C stays constant at 1.8155.
Calculating the Reaction Path
By setting r1 slightly higher than rts, the geometry was changed in the direction of the product and it rolls toward the product, B-C.
Trajectories from r1 = rts+δ, r2 = rts
1
Reactive and Unreactive Trajectories
g


