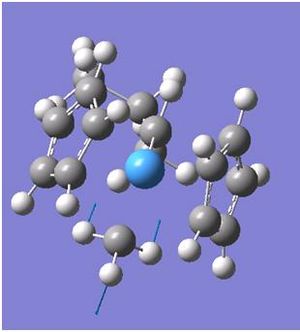
Jn307Module2:h1heisachemist
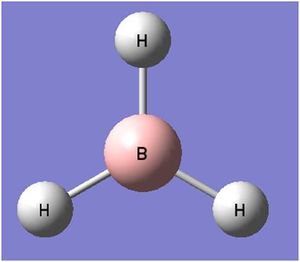
Optimisation of BH3
 |
 |
 |
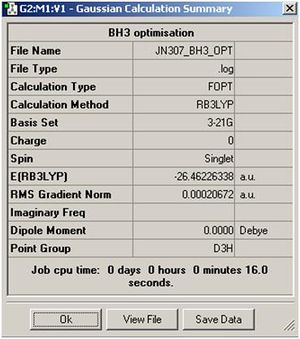
the method: B3LYP
the basis set: 3-21G
and what type of calculation to do: OPT
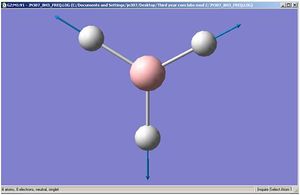
The BH3 molecule was optimise using the method of B3LYP which approximates some values in solving the schrodiger equation and the set 3-21G is used to accurately describe the molecule. we are using opt in order to minimise the energy and to get the lowest formation of the energy which is the minimum energy. this is done very quickly using gassium on the laptop as it is a very small molecule. the data was checked to see if all the values converged indicating that all the values had normalized for a while. As the graphs show, the molecules first starts off at a high energy, with the atoms quite far away. as the atoms comes together, the energy of both diagrams decrease until we reach the equilibrium, or the preferred energy of the molecule and this is where the minimum can be found. if the atoms are too close, Coulomb interactions from the nucleus and the electrons would repulse the atoms away from each other. this is shown in the potential energy diagram below.
The BH3 molecule was optimize using the method of B3LYP which approximates values in solving the Schrödinger equation and the set 3-21G is used to accurately describe the molecule. The method B3LYP is used because it is a quick method to use to calculate a molecule but has a low accuracy. The time it takes and the accuracy are needed to be balanced in order to be able to investigate a molecule to a certain degree of accuracy. The molecule is optimised in order to find the minimum energy of the energy well. This is found when all the values are converged and the IR frequencies are all positive suggesting an upward slope from the minimum. The data was checked to see if all the values converged indicating that all the values had normalized, this can be seen in the text file of the out file of the optimizing.
Both graphs show a decrease in energy as the molecule is optimised over time(Optimising Step Number). The first graph shows the total energy over time. This graphs show that as the molecule energy goes down, the atom would come together linearly with time. When the atoms has reached an equilibrium distance of around 1.19 angstroms, this agrees with experimental data of the bond lengths of 1.20 angstrom[1].The energy is minimised to -26.46 a.u. The molecular total energy is directly proportional to the bond distance of the atoms, and when the bond distance are at an equilibrium distance, the energy of the molecule will also become a constant.
The second graph shows the real mean squared or average of the gradient against time. As the time increases, the gradient goes from 0.035 to 0. There are three different gradients, the first gradient indicates the change as the atoms comes closer together but the bond does not form yet. Between 20-30 step numbers, the bonds are gradually formed; this is seen in the movement of the atoms in the diagram. After 35, the gradient becomes constant, the bond length becomes equilibrium and the energy becomes constant and therefore the gradient becomes zero.
The gradient is 0.00020672 which is much lower than the gradient of 0.001, which also shows that the energy has converged but in order to see it has fully optimised, a frequency analysis must also be taken.
NBO of BH3
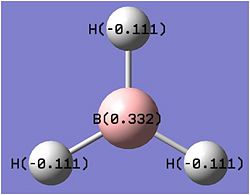
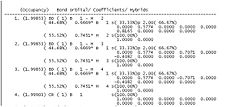
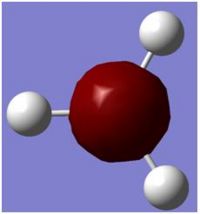
The above picture shows the NBO picture of the BH3 molecule. as iot shows, the hydrogen atoms contains the negative charge of -0.111 while the boron atom carries the positive charge of 0.332, these charge are balanced and shows that this molecule is an uncharged molecule.
on the data to the right, it shows that for the bond between the boron and the first hydrogen, Boron contributes 44.68% of the bond to the B-H bond of which 33% was of the 2s orbital and 67.67% was of p indicating that it was a hybridized sp2 molecule. Hydrogen contributes 55.52% to the B-H bond and is 100% s orbital. this is identical for all three B-H bonds and emphasis the triangular planer orbital of 120o molecule. The last occupancy is the 1s orbital, this does not bond to any of the hydrogens and is too low in energy to mix and therefore is 100% s orbital.
Molecular Diagram of BH3
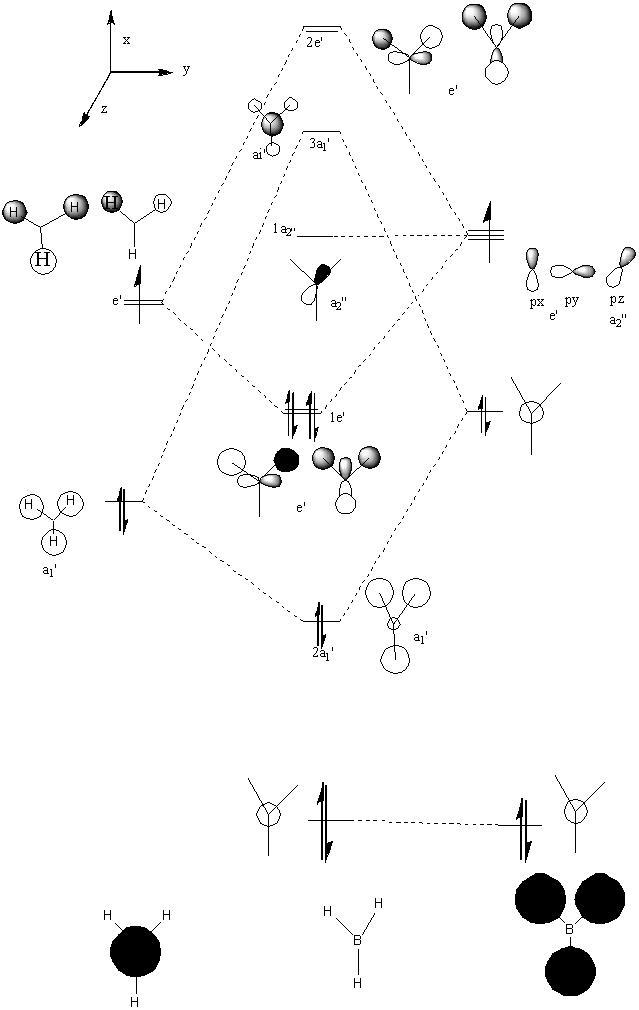
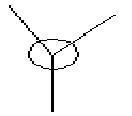
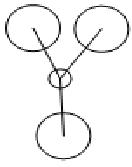
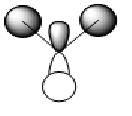
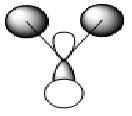
In molecular orbitals diagram, the molecule's symmetry group is first calculated from following the symmetry table. The molecule can be split with placeholders (black in the MO diagram) replacing the atoms and the orbitals are matched with the symmetry elements in the symmetry group. From the molecular orbital diagram to the left, the Boron 1s orbital is too low in energy and so cannot interact with any of the three hydrogen atoms, which leaves a non-bonding 1s orbital. The three hydrogens atoms are lower in energy than the 2s orbital because the hydrogen molecular orbitals are made up of 1s orbitals which are lower than 1s orbitals. The hydrogen 1s is still higher in energy in energy than the boron 1s orbital because boron has got more protons in its nucleus which contracts the electrons shells.
The Boron 2s and the hydrogens have the same symmetry element of a1' and therefore will bond forming the bonding orbital which is lower in energy than the anti-bonding orbital which is destabilised. The pz, py and py of the boron atom are the next highest molecular orbitals. py and py orbitals have the symmetry element of e' while pz have an a2 orbital. The hydrogen fragment have an e' symmetry, therefore the two e’ orbitals can bond as they have the same symmetry and are around the same energy. The pz orbital cannot bond with any orbitals and thus would be a non-bonding orbital. all together, there are three bonding and no non-bonding orbitals formed which means three bonds are formed, which corresponds to the three B-H bonds.
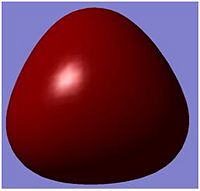
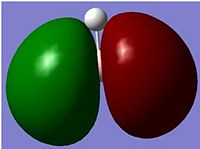
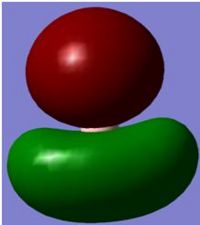
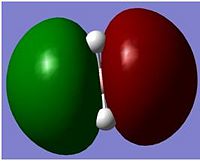
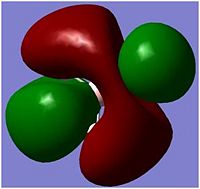
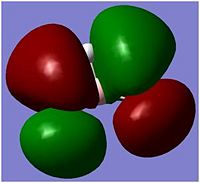
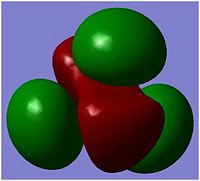
To calculate the real molecular orbitals of BH3, the molecule was optimised using the basis set of 3-21G, this step has already been achieved previously when learning how to optimise the BH3 molecule. The checkpoint file was then opened to get the optimized file of the BH3 in order to see the molecular orbitals diagram. The keywords pop=full and Full NBO was ran, in order to get the molecular diagrams of the molecule. After this has finished, the checkpoint file is opened and from results, the molecular orbitals can be viewed in gassview 5. First impressions DOI:10042/to-3036 show that the unoccupied molecular orbitals tend to be larger in size than the occupied molecular orbitals. This may be because, the occupied MO are lower in energy and so are closer to the nucleus, the anti-bonding wants to maximise the space to minimise the total unfavorable interaction.
Molecular Orbitals of BH3
Comment on the following questions: Are there any significant differences between the real and LCAO MOs? What does this say about the accuracy and usefulness of qualitative MO theory?
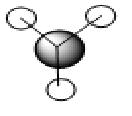
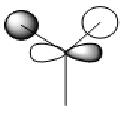
As the MOs above shows, the real and the LACO molecular orbitals are very similar to each other. This shows that the qualitative MO theory is accurate and useful compared with the real MOs.
Vibrational Motions of BH3
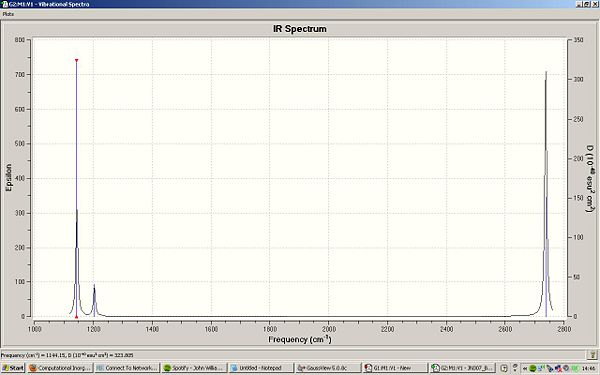
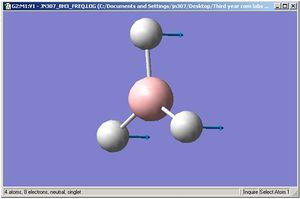
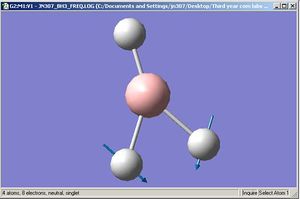
There are less than 6 peaks in the spectrum because though there are six frequencies in BH3, the intensity is so much smaller that it will get lost in the noise of the IR and therefore would not be detected. the e' are also degernate and only one peak would appear here. therefore, there are 6 frequencies, however one has got the intensity of 0 so shall not be seen, two are degernate to two others and therefore only three peaks are left in the spectrum which is shown.
Structural analysis of BCl
Calcalation Method = B3LYP
Basis Set = LANLZMB
Energy = -69.439 a.u.
The same method and basis set must be used for both the optimizationDOI:10042/to-3465 and the frequency in order to keep the data accurate and to use the same framework of the method and basis set. the basis set can again be analogies to the cars. if we used a basis set of 3 and then change to 1 basis set for the second calculation, we lose the accuracy of the basis set which in turn would not allow us to view the car in greater detail, or the molecular orbitals. likewise, should we begin with 1 basis set and switched to a 3 basis set for the second calculation, the 3 basis set would be working on that initial one basis set and would again lose the accuracy and would lead itself to more errors. The method determines the approximations used when solving the Schrodinger equation, by changing the method, we change the approximations which would lead to more errors as a different approximations would be used for the second calculations. therefore both method and basis set should be used for both calculations in order to reduce errors and to use the same approximations.
The frequency tells us the position of the energy potential of the molecules. A frequency analysisDOI:10042/to-3466 must be carried out in order to see if the minimum had been reached, this is seen by all the frequencies being positive in value. If the values are all negative, than the maximum had been reached and if one of them is a negative value then the transition state of the molecule has been found. It also allows us to confirmed that the data had been optimised completely or whether it has failed or if more also provides us with the vibrational and IR data which can then be compared with experimental data to check the accuracy of the data.
A bond is the electrostatic attraction between two atoms which when bonded will minimize the total energy of the system making the orbitals of the two atoms more stable. The molecule also process energy proportional to the Boltzmann distribution of energy where the molecules can possess a different proportional of energy, with more energy, the molecule’s bond can stretch which follows a natural potential well. In a classical theory, the bond would vibration for infinitely without breaking but in a real situation, at high enough energy, the bond would break.
After the optimisation of BCL3, it was found that the bond lengths of the B-Cl was found to be 1.86592 angstroms, which was in good agreement with the literature[2] value of 1.821 angstroms. Gaussview has therefore managed to fully optimised the simple molecule. The angle of the molecule is a planer 120o which is in good agreement and makes sense as there is no lone pair of electrons on the boron and the molecule is of a sp2 hybrid orbital.
For the ground state structure, by following the symmetry tree diagram, it was found to be D3h, this is what the symmetry that gaussview uses. Symmetry is important in order to show frequency and the IR spectrum as some vibrations that are symmetric would not be IR active or would be degenerate to each other. The BCL3 and the BH3 molecules are very simple, easy molecules to compute and hence the calculations would only take a few seconds at best to be completed.
Isomers of Mo(CO)4(PCL3)2
 |
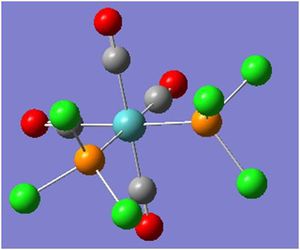 |
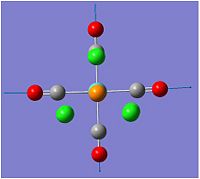
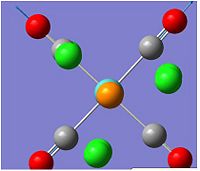
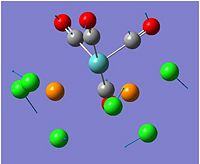
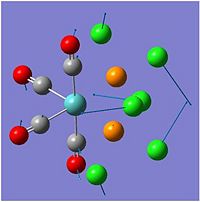
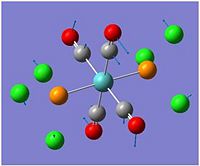
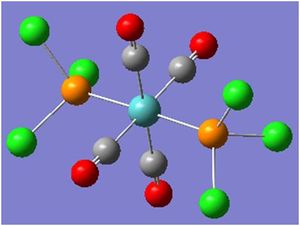
In the first optimising of the cis and trans isomers, the method used was B3LYP. and the pseudo poential was LANL2MB. Both results have all converged after running this optimisation. Cis: DOI:10042/to-3039 , Trans: DOI:10042/to-3040 . this optimising as it is only used to give us a rough estimation of the geometry of the molecule. There may also be many minimum and at this level of optimising, it is unsure whether this is the absolute minimum of the system. Clearly a second more accurate method is needed to minimise the isomers. Both results were checked in the results data to check that it has optimised completely before moving on. the gradient for the cis was 0.00013273 a.u and the gradient for the trans isomer after the first optimising was 0.00012499 a.u. This is also indicative that the moelcule has fulyl optimised the the gradients is much lower than the the required 0.001 gradient as it is written in the scripts.
For the Cis isomers, the best geometry to get the lowest minimisation is to rotate both groups so that one chlorine on one groups will be pointing up and the other will be pointing down. This is done by changing the dihedral angle of the molecule along a chosen C=O bond to 0o. these C=O bonds should be oppose to each other to ensure that one is pointing up and the other is pointing directly down. the other chlorine also need to be rotated in order to ensure that the molecular geometry between the carious P-Cl bonds remains unchanged.
The best geometry to achieve the lowest minimisation for the trans isomer is to make sure that both are eclipsed with one Chlorine from both groups lying parallel to the M-C bond. the formation initially was the staggered version from the 1st optimising. the angle was again changed by changing the dihedral angle of both Cl bond to 0o and to change around all the other Chlorines ions so there is a maximum distance between the chlorides.
After the best optimising for the isomers geometries have been set. a new gaussview file was created where the new method was LANL2DZ, which is a much better basis set to used and the electron convergence was set to
int=ultrafine scf=conver=9
. these were then ran and after it has completed the log file was checked in order to confirm that the convergence has taken place. The isomers has been optimised but it can still be checked by running the frequency analysis of both isomers. Data for the Second Optimising: Cis: DOI:10042/to-3041 , Trans: DOI:10042/to-3042 . The Cis gradient was 0.00000664 a.u and the gradient for the trans was 0.00002993 a.u. The gradients again show that the molecule isomers has beeen fully optimised as the gradient is below 0.01, the gradient is much lower than the gradients done previously which may indicated a lower minimum.
finally, a frequency analysis was ran in order to checked that both cis and trans isomers were completely minimised. Cis = DOI:10042/to-3037 Trans = DOI:10042/to-3038 , there are no negative frequencies indicating that the molecule has been completely minimised.
Vibrations of the C=O stretches in the Cis and Trans Isomers
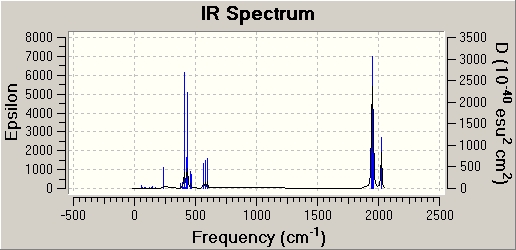
In this data, the cis C=O vibrations shows 4 different frequencies at varying intensities, this would be easily picked up from the IR spectrum as shown above. This supports the theory that the number of CO vibrational bands to related to the molecule.
|
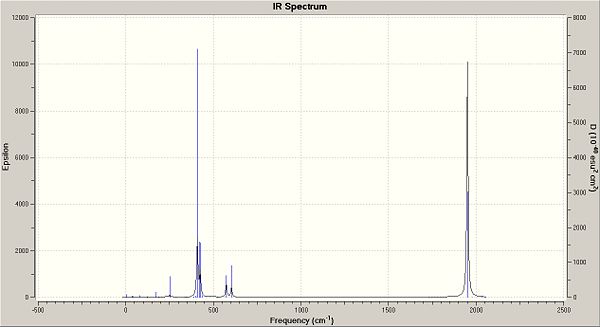
In the trans isomers, four frequencies can be seen in the data table however the frequency at 2031.15 cm-1 is symmetrical and therefore will not be seen in the IR spectrum. At 1977.37 cm-1, there is a low intensity and thus this peak would get lost in the noise of the IR spectrum. the last two of 1950.47 cm-1 and 1951.10 cm-1 are very close in both frequency and intensity and therefore can be seen as degenerate as each other. as well as this, the table above shows that the movement of the molecule are also identical. therefore, there would only be one C=O frequency in the IR spectrum of the Trans Isomer.
The IR diagram of the cis and trans isomers are pretty similar to each other. There is a large peak just below 500cm-1 and a high peak at just below 2000cm-1 The peak at 500cm-1(/sup) indicates the C-H vibrations while the peak at 2000cm-1 indicates the carbonyl movements. There are also small peaks around these larger peaks which are variations of the same movement of the molecule.
Comparison between literature and calculated CO stretches
| Calculated/ cm-1 | Literature[3]/cm-1 |
|---|---|
| 1945.27 | 1897 |
| 1948.65 | 1908 |
| 1958.33 | 1927 |
| 2023.29 | 2023 |
The data shows that the frequency of 2023cm-1 from the literature value is exact and shows that the calculations is in good agreement. However, the other C=O stretches was higher than the calculated values, which may have been because we have replaced the 3 phenol groups with Cl in order to make the calculations much simpler. If the calculation were done using phenol, the vibrations may be more exact but altogether, the data seems to match the literature values and therefore is a good approximation for the cis ligand.
Bond Lengths of the Isomers
comment on the structures compare relevant geometric parameters from the optimised geometries and experimental literature values (it is up to you to find these values). You don't have to find exactly the same molecule, as we have used a model to reduce the computational cost! In this case try to use literature values to estimate a rough range for the bond length (for example Mo-N single vs Mo=N double bonds). We are looking to see if your computation is a good one, and you haven't made some mistake which has allowed the calculation to complete, but gives rubbish results. This is part of computational chemistry ... always checking that your results make sense, as the computer cannot do that for you. While this is useful it shouldn't take up a large portion of your time, 1-2 hrs max! If you can't find the values you need, tell me how you searched for them and offer suggestions for another way of checking the accuracy of your calculations the web or a wiki might be a good place to get an estimate of a bond length for setting up a job, it is not a good place to obtain a "reference" value. However there are some places that are good, for example the CRC Handbook of Chemistry and Physics is a very useful resource. compare the computed cis and trans geometries
| Bond | Cis bond Length/a.u. | References bond lengths
[4]/a.u. |
Trans bond lengths/a.u. | References bond lengths[5]}}/a.u. |
|---|---|---|---|---|
| Mo-P | 2.51 | 2.529 | 2.44 | 2.50 |
| Mo-C | 2.05 | 1.982 | 2.06 | 2.005 |
| C=O | 1.175 | 1.14 | 1.17 | 1.164 |
| P-Cl | 2.24 | 1.84 | 2.24 | 1.828 |
Relative energies of the Trans and Cis Isomers
 |
 |
if you have time, test your prediction by carrying out the calculations!
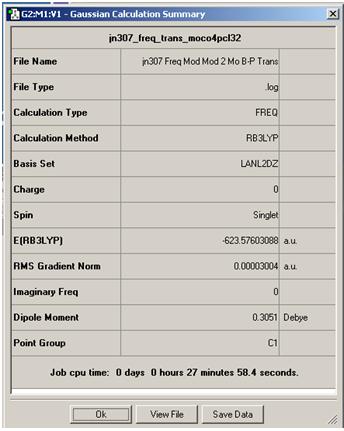
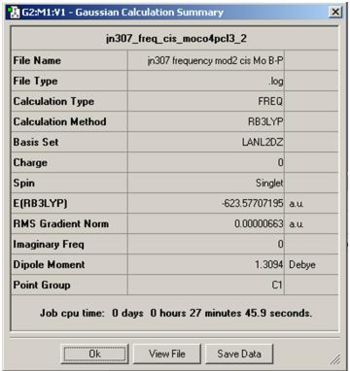
In the Summary page for the second optimisation of the cis and Trans isomers, it was found that the Trans total energy is -623.5760 Hartree, while for the cis isomers, the total energy was found to be -623.577 Hartree. By muiltipling this by 2625.5, we shall get units of KJ/mol. Therefore for trans, the total energy was -1637198.869 KJ/mol and the cis isomer was -1637201.602 kj/mol. This indicates that the cis isomer is the most stable out of the two with an energy difference of 2.73 KJ/mol. This energy is not that large and therefore one isomers would not form in a higher ratio than the other. However, the PCL3 ligand is much larger than the CO ligands, and i would have assumed that the trans isomer would be the most stable in order to minimise the steric hindrance of the molecule. the Trans isomers may also have a lower transition stage which in a irreversible reaction which would make a higher ratio of trans product. In a reversible reaction, the reaction may make the trans product first before reverting back to the reactant and onto the cis product. if we increased the bulkiness of PR3, the trans isomer would become more lower in energy as the ligands on the cis isomers becomes too close which would increase the total energy of the molecule.
low and/or Negative Frequencies of Cis and Trans Isomers
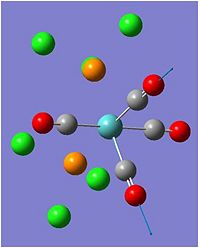
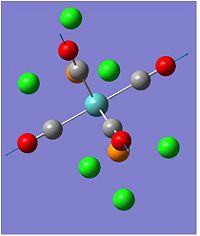
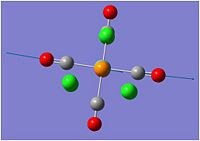
comment on the IR spectra Do any of your vibrations have a very low or negative frequency? Animate these vibrations using Gaussview and on a diagram clearly show the movement of the relative groups. If a vibration/rotation has a very low energy, IE a very low frequency, what do you think is happening at room temperature? compare the computed IR frequencies for the carbonyl ligand with experimental values (2nd year lab! or from the literature). compare the computed IR carbonyl frequencies for the cis and trans conformers. Do you get the number of bands predicted from symmetry? If you don't, offer a suggestion as to why not! if you are taking the "Symmetry and Spectroscopy" course it would be good practice to assign the vibrational spectra
In both IR spectrums of the cis and trans isomers, the low frequencies, generally below 20 cm-1 shows a generally rocking movement between the atoms of the molecules. At room temperature, this may indicates the vibrational of the molecule. At low temperatures, molecules tend to vibrate rather than be perfectly stationary, and thus these molecules will be constantly vibrating at these specific frequency.
MINI PROJECT 2
In this investigation, i shall be investigating the bonds lengths and vibrations of the Tantalum complex in a Schrock Alkylidenes. in a Schrock Alkylidenes, the double bond is formed by the backbonding from the p orbital into an empty d orbital orbital of the metal. as well as this, one electron will be donated to the metal in a sigma fashion to a p orbital on the metal. this would form a strong M=C bond. i shall investigate changing the R group on the molecule below and to investigates how the bond lengths, angle and the frequency of the IR of the CO bond changes as the R groups increases. The spin of all molecules will thus be a triplet spin as there are two spins of unpaired electrons.
Schrock Allidenes have some conditions in order for it to not be a fisher carbene. The metal must have a high oxidation number, prefable a early transition metal though there are some exceptions and pi-donor ligands which are usually alkyl. Electron withdrawing groups would disrupt the strong M=C bond and thus would get a fischer carbene.
Initially the decision was to have extremes R groups in order to better quantify how the molecules will changed with increasing sterics affects. the groups initially chosen was to have R=H, 6 carbons straight and branched and then investigate a pentadiene, a benzene and a substituted benzene ring. the conditions set in gaussview as:
Method: DFT
Basis Set: B3LYP
Additional Keywords: opt=loose
pseudo-potential = LANL2MB
Maxcycle =50
However, after waiting for the molecules to optimised, it was discovered that not all the values was converged except for when R=H. I then had to rethink, and believed that i have overextended myself too much by drawing bigger molecules that gaussview could not handle.
Imaged of an unsuccessful optimision when R=benzene: DOI:10042/to-3450
I then changed my method in making R=H,Ch3, Ch2ChH3, CH2CH2CH3, CH(CH3)CH2CH3, CH2CH(CH3)CH3. this would allow me to investigate the affect of increasing the R groups in the sChrock complexes. These molecules became optimised using the above method shown. It is now possible to investigate how by either changing the length or making a branch on an alpha or beta carbon will affect the molecular complex.
After the rough optimition has occurred, i then created another optimising gfl file with the following conditions and ran on the Scan.
Method: B3LYP
Additional Keywords: int=ultrafine scf=conver=9
 pseudo-potential: LANL2DZ
Maxcycle =50
As there are 3 different scans for 6 different molecules, the time and resources that we have are not enough in order to be able to measure the energies of the singlet and triplet spin of two identical molecules. However, i was able to scan the first optimision when R=H of which the energy of the triplet scan was slightly lower. Therefore, i have decided to use the triplet spin throughout my investigation. After Each optimization, the data was checked in word pad to check that all the values has converged before moving on to the next part. For R=H, the MO and NBO was also investigated because as the smallest molecule, it would be the quickest to scan.
Bond Lengths
After the second optimisation, the bond lengths were checked to see whether the bond remains a double bond compared with the methyl groups. the data is shown in the table below:
| R group | bond length of Ta=C | Bond length Ta-C | Difference | angle C-M=C |
|---|---|---|---|---|
| H | 2.14773 | 2.23860 | 83.147 | |
| CH3 | 2.15029 | 2.23914 | 86.521 | |
| CH2CH3 | 2.15172 | 2.23926 | 86.711 | |
| CH2CH2CH3 | 2.15155 | 2.23965 | 86.521 | |
| CH(CH3)CH2CH3 | 2.15457 | 2.23858 | 86.711 | |
| CH2CH(CH3)CH3 | 2.15225 | 2.23931 | 86.554 |
it can be seen from the table above that as the chain is increased in a linear fashion, the bond length of Ta=C gradually increases, this may be because as the chain increases, the bond length needs to increases in order to minimise sterics effects. the backbonding to the carbon may have also increases with an increasing linear chain which would also destablised the Ta=C slightly. As well as the Ta=C bond increasing, it can be seen that the Ta-C also increases as the linear chain increases, this may be because of the increasing backbonding from the metal to the carbon single bond which would result in a higher bond length. The angles also increases as the linear chain increases, this is also due to the increases steric bulk the molecule felt but the molecule needs to be careful not to be too close to the two cyclopentadiene rings cis to them.
On average, the bond difference between both bonds are between 0.15 a.u. i believe that this is an measurable difference between the double bond and the single bond bonded to the Ta but an NBO analysis of when R=H would help distinguish between the two different Schrock Alkylidenes molecules. Therefore a NBO with the conditions of:
NBO=FULL
was performed after the second optimisation.
NBO when R=H
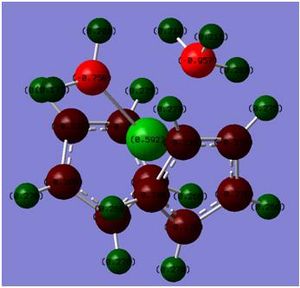
The NBO when R=HDOI:10042/to-3448 and ch2ch2ch3DOI:10042/to-3447 was investigated and compared with each other. This would allow me to see the nuclephilicity of the Ta=C carbon atom.
 |
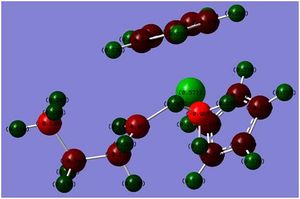 |
The NBO when R=H and when R=CH2CH2CH£ shows a drastic change in the polarity of the nucleophilic carbon. When R=H, the carbon double bonded to the metal Ta is -0.758 however when R=CH2CH2CH3, the carbon has a decreased polarity of -0.451. This is a large change and represents the idea that the carbon electron density is becoming more diffused and hence a poorer nucleophile against electrophiles. As the R groups increases, the reaction with the nucleophilic carbon will become slower, this may also be in part to the increased stability a bulky group would have on the R group of the carbon because of the spread of the electron density.
 |
 |
The Summary text file associated with the log file shows an interesting development. The methyl group itself appears to be a sp2 orbital while, the double bonded Ta-C appears to be more like a sp orbital. nevertheless, a difference can clearly be seen in the hybridised orbitals of the molecule. This may also show that the double bonded Ta=C may exhibit some triple bond characteristics and the methyl may form some kind of single bond/ double bond overlap, which also supports the argument that the carbon would be more nuclephilic that due to the orbital overlap shown above. Comparison of the two groups shows is given in the table below:
| R group | Atom | s contriubution/% | p contribution /% |
| H | C= | 46.11 | 53.01 |
| C- | 32.38 | 67.62 | |
| CH2CH2CH3 | C= | 43.06 | 56.02 |
| C- | 32.52 | 67.48 |
The data above shows the hybridized orbitals on the double bonded C= and the methyl group. As it can be seen, as we increased the R group substitutes on the double bonded carbon, the s character contributes less while the contribution of the p orbital increases. Earlier, it was found that the bond lengths increased as the R groups increased, the electron density in the nucleophilic carbon also decreases as it becomes more diffused along the chain carbons. Therefore, it would be higher up in a molecular orbital diagram as the bond between the Ta and the carbon becomes weaker, which would result in less contribution from the s orbital. The methyl group has no noticeable change in contribution to the Ta metal complex.
Summary of data optimized and frequency analysis
| R Group | H | CH3 | CH2CH3 | CH2CH2CH3 | CH(CH3)CH2CH3 | CH2CH(CH3)CH3 |
| 1st Optimization | DOI:10042/to-3360 | DOI:10042/to-3363 | DOI:10042/to-3365 | DOI:10042/to-3368 | DOI:10042/to-3370 | DOI:10042/to-3372 |
| 2nd Optimization | DOI:10042/to-3361 | DOI:10042/to-3364 | DOI:10042/to-3366 | DOI:10042/to-3369 | DOI:10042/to-3371 | DOI:10042/to-3373 |
| Frequency analysis | DOI:10042/to-3362 | DOI:10042/to-3367 |
MO when R=H
In the Optimisation of all the molecules, i was unable to procure molecular orbitals due to using the triplet spin state instead of the singlet. If more time was given the molecular orbitals between the chain's R group are of significant interest in order to see how a secondary or tertiary carbon would affect the molecular orbital overlap between the Ta=C, this would also allow us to view the energies of the HOMO and LUMO and to see how the stabilization will be affected by changing the position of the methyl group.
Vibrational differences when R= H, Ch3 and CH2CH2CH3
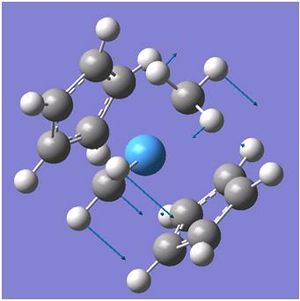
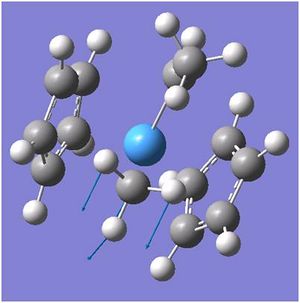
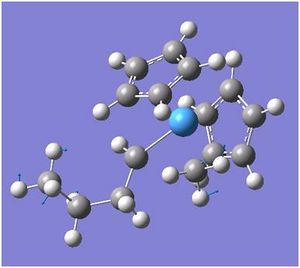
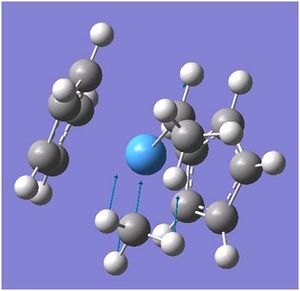
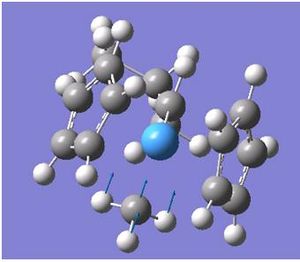
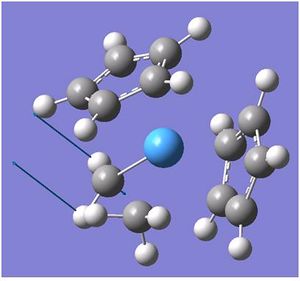
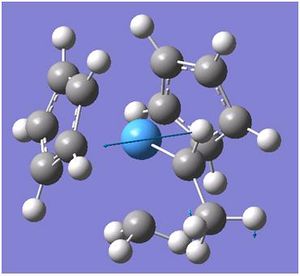
The graphs tries to show a graphical representation of the methyl and the R groups vibrational movement as we increases the R group. in order to chart the stability of the molecule, a constant was sought which was the methyl group cis to the R group. When we changed the R group from H to Ch3, a drastic change can be seen in the frequency. The middle one is associated with the movement of the C-H in the methyl groups, as we changed from a H to a CH3, the intensity increases by around 5 a.u. and the frequency increases indicating a longer bond and hence a more destablised bond. However when we add two carbons to the CH3 groups, the C-H becomes lower in frequency and the intensity slightly increases, in some ways, the bond becomes stronger and more rigid, this may be because due to the -CH3 slightly further out as well as the cyclopendaidene on the other side, the methyl must conform closer to the Ta metal and hence cannot be as free as it wants to be due to sterics. The other frequencies does not tell much about the different stability of the molecules, although, from H to CH3 there is a much lower intensity in the frequency which may be because of the increased sterics around the molecule which prohibits the movement of the atoms.
In Conclusion, it can be seen that as the R groups increases, the bond length of C=O generally increases to limit steric interaction, the NBO also shows a more diffused carbon which suggests that the carbon has become less nuclephilic and therefore cannot an electrophile as well as it can. However, with a diffused electron density, the bond should be more stable and thus cannot degrade as easily allowing for more complicated reactions to occur. If time would allow me, i shall uses the singlet and see how benzene MO diagram would affect the Schrock Alkylidenes.
References and Citations
- ↑ ="Adsorption of BH3 on Si(100)−(2×1)"<DOI:10.1021/jp9726246 "/
- ↑ ="Structure of the triphenyl phosphate-boron trichloride adduct"<DOI:10.1107/S0567740882008565 /
- ↑ ="A convenient synthesis of cis-Mo(CO)4L2 derivatives (L = Group 5a ligand) and a qualitative study of their thermal reactivity toward ligand dissociation <DOI:10.1021/ic50187a062 "/
- ↑ ="Steric contributions to the solid-state structures of bis(phosphine) derivatives of molybdenum carbonyl. X-ray structural studies of cis-Mo(CO)4[PPh3-nMen]2 (n = 0, 1, 2) <DOI:10.1021/ic00131a055 "/
- ↑ ="Crystal structures of trans-[Mo(CO)4(PPh3)2] and 1,4-bis (diphenylphosphino)-2,5-difluorobenzene <DOI:10.1016/S0020-1693(96)05133-X "/

