Jd26154
Reaction Dynamics of Triatomic systems
Exercise One
The first system to analyse was the collision of a single hydrogen atom (A) with a diatomic hydrogen(BC) by plotting the the length of A-B and B-C.
Nf710 (talk) 16:40, 2 June 2017 (BST) These are different starting conditions
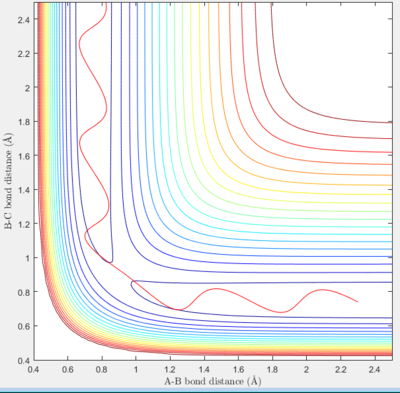
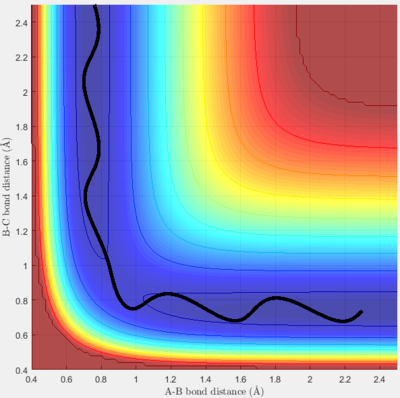
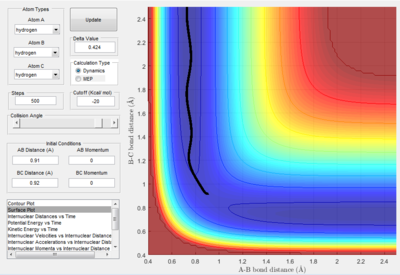
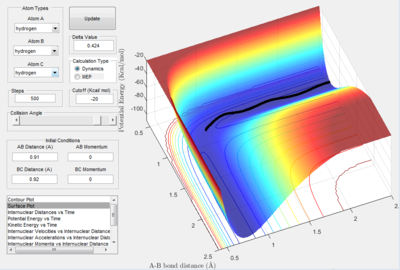
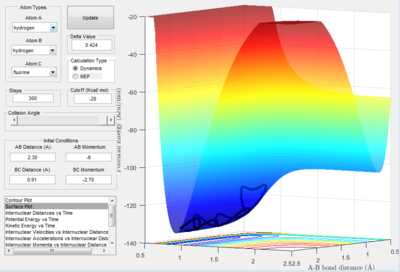
The conditions for this reaction profile shows an initial A-B and B-C distance of 2.30 and 0.74 respectively. The initial momenta A was -2.7 and BC was 0. The plots are the contour and surface plots respectively.
This reaction profile corresponds to a reactive trajectory, where a reaction is taking place. It is evident that from both plots, the reactant channel i.e. the area before the collision has occured, is the the oscillating trajectory as A-B decreases up to 1 Å, followed by the transitions period from 1 Å to 0.6 Å, followed by an increase in the bond length B-C as C is projected away from the newly formed molecule AB. The oscillation in the reaction channels are due to the osciallilations of the molecular bond (B-C in reactants and A-B in products) resulting in the oscillations of the A-B distance.
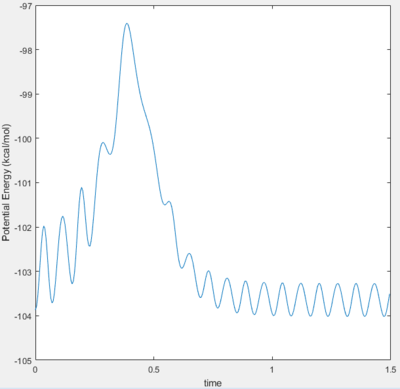
The energetics of this reaction can be easily displayed using the potential energy against time plot.
Before 0.5 s, the increase in potential energy is due to the repulsive forces of the hydrogen atom with the hydrogen molecule. The transition state is the peak of this plot i.e. the point where the A-B distance and the B-C distance are at their smallest simultaneously. The peak then drops off as the C atom is projected away to an energy value equal to that of the starting energy value of the reactants. The reaction is neither Endothermic or Exothermic as the energy of both the products and the reactants are equal. The oscillations are reflective of the constant switching between kinetic and potential energy of the molecule. The peaks of the oscillations show the point of maximum potential energy and the kinetic energy is low and the molecule begins to repel. At the trough, the potential energy is lowest and the kinetic energy is high, thus moving faster.
What value does the total gradient of the potential energy surface have at a minimum and at a transition structure? The gradient of the minimum and maximum (transition structure) are given by the differential of the potential energy with respect to nuclear distance, shown to be zero at these points. To distinguish between the minimum and maximum, the second differential of the potential energy with respect to nuclear distance where the sign of the second differential dictates whether the peak is a maximum or a minimum. A positive and negative second differential will be a minimum and maximum respectively. If the second differential is zero, then there is a point of inflection which would prove to not be very useful. The transition state is where along the reaction coordinate there is a maximum value, whereas along other directions the potential shows a minimum. This is characteristic of a Transition state.
Nf710 (talk) 16:43, 2 June 2017 (BST) What you are talking about here is changing the basis into the normal modes. The reaction coordinate becomes one of the bases
What value does the total gradient of the potential energy surface have at a minimum and at a transition structure?
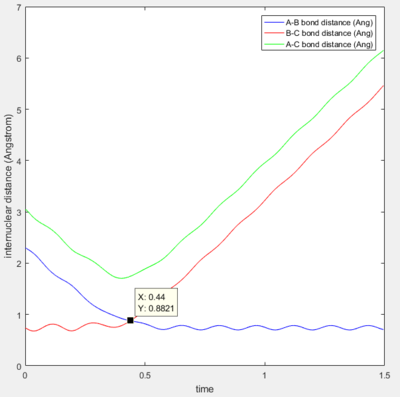
The difference in molecular distance can also be expressed using the following internuclear distance against time plot.
Here it is evident that A-B bond distance decreases to a minimum equal to the B_C bond distance. This is followed by the increase of the B-C distance as the C hydrogen is projected away. The parallel nature of the AC and BC prove that the C hydrogen is being projected away as the distance between these two parallel lines is equal to the bond length A-B. The best estimate for the transition period is given at the point where the B-C distance and A_B distance are equal, i.e. when the red and blue lines intercept. This is also the point when the A-C angle ~~~~ (surely you mean bond length) is at a minimum. Immediately after the intercept, the B-C bond distance increases as C is projected away. The internuclear distance at the transition is 0.8821 Å at time 0.44 s.
Therefore at the transition state, the AB and BC bond distance are equal. From the analysis of the surface plot along the reaction trajectory i.e. where the transition state appears as a maximum, it is evident that the transition state has a bond length of AB and BC from 0.90 to 1. By varying the equal lengths AB and BC on the internuclear distance plot, the bond distance at the transition period is given when the lines are not oscillating and parallel, this value is given at 0.91.
Comment on how the mep and the trajectory you just calculated differ.
The MEP plots show the tranjectory of the reaction along the point of lowest energy. This shows line which follows the minimum of the potential curve, thus providing a straight line with no oscillations.
The Dynamic trajectory gives a line which oscillates about the points of lowest energy due to vibrational motion. The molecules vibrations is a constant transferal of energy between kinetic and potential.
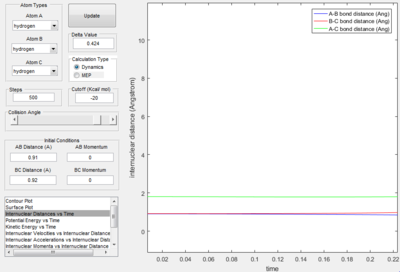
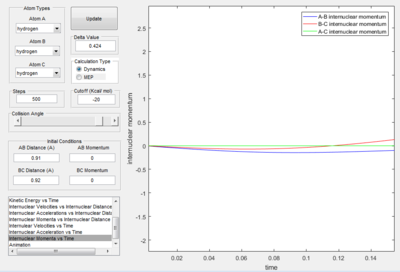
The above images above are the internuclear distance v time plot and the momentum v time plot respectively. At time = 0 s, i.e. the point of the transition state, it shows that the AB bond distance and the BC bond distance are the same (corresponding to the transition state) and the AC bond distance is constant. The average momenta for the transition period is shown to be zero, which also corresponds to a symmetrical transition state.
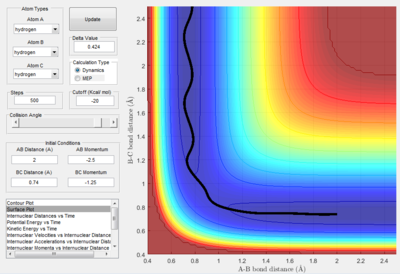
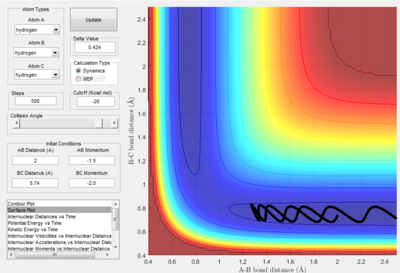
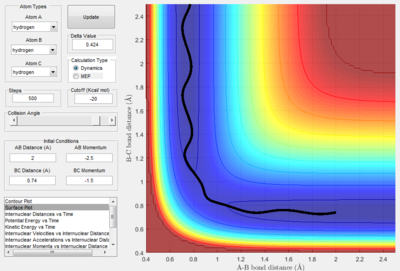
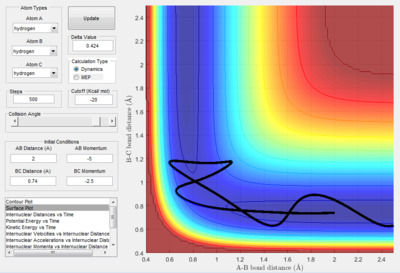
Complete the table by adding a column reporting if the trajectory is reactive or unreactive. For each set of initial conditions, provide a screenshot of the trajectory and a small description for what happens along the trajectory.
| p1 | p2 | Reactive/Unreactive |
|---|---|---|
| -1.25 | -2.5 | Reactive |
| -1.5 | -2.0 | Unreactive |
| -1.5 | -2.5 | Unreactive |
| -2.5 | -5.0 | Reactive but reacts backwards |
| -2.5 | -5.2 | Reactive |
The first momentum variation (p1 = -1.25 and p2 = -2.5) shows a typical reactive trajectory where there is little oscillation due to the smaller momentum.
The second momentum variation (p1 = -1.5 and p2 = -2.0) shows reaction trajectory where no reaction occurs as not enough momentum (i.e. kinetic energy) is provided by the collision for there to be a reaction, thus the A hydrogen is reflected backwards.
The third momentum variation (p1 = -1.5 and p2 = -2.5) shows reaction trajectory where there is a reactive trajectory. Comparing this trajectory to the surface plot where p2 = -2.0, it is evident that the momentum required to pass the transition state is between -2.0 and -2.5.
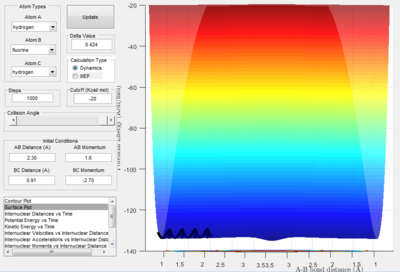
The fourth momentum variation (p1 = -2.5 and p2 = -5.0) shows reaction trajectory where there is a enough kinetic energy to pass over the transition state, but the system has too much kinetic energy so the molecule immediately reacts again, resulting in the projection of A back on its original trajectory.
The fifth momentum variation (p1 = -2.5 and p2 = -5.3) shows reaction trajectory where there is a enough kinetic energy to pass over the transition state, but this has even more kinetic energy than the previous variation. This results in the molecules first reacting once towards the products, then towards the reactants, then back towards the products.
State what are the main assumptions of Transition State Theory. Given the results you have obtained, how will Transition State Theory predictions for reaction rate values compare with experimental values? The analysis of the previous data shows that the transition state is a peak when observed along the reaction coordinate but a trough at every other point.2 This is important when determining the energy barrier of the reaction required for the reactants to become products.2 For this particular reaction, the bond distances of the transition state are equal where each outer hydrogen (A and C) are at equal distance to the inner hydrogen (B). The average momentum at the transition period can also be assumed to be zero at the transition period due to the symmetrical nature of the transient species. The momentum data shows that both reactants and products are influenced by the initial momentum of the system, where insufficient kinetic energy results in a failure to meet the energy demand of transition state and there is no reaction, also where there was an over excess of kinetic energy and the newly formed products react again to form the reactants, thus reversing the reaction trajectory back over the transition state. Therefore the rate of reaction can be determined by the analysis of the momentum of the reactants and the energy of the transition state. This is evidence of the quasi equilibrium introduced by Eyring where the transition complex is in equilibrium with the reactants and the products, thus at the transition state, the reaction could either return to the reactants, or progress towards the products.2
Nf710 (talk) 16:52, 2 June 2017 (BST) Not every other point. Dimension.
Nf710 (talk) 16:55, 2 June 2017 (BST) If you are going to talk about TS in this man you need to back it up with the flux equations from ATkins. Typically a simpler explanation would be that TS theory does not account for recrossing of the TS. So here you are proving there is some recrossing
Exercise Two
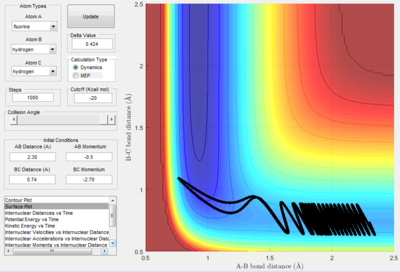
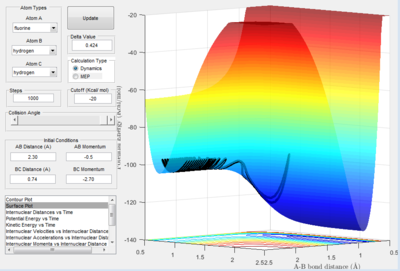
Classify the F + H2 and H + HF reactions according to their energetics (endothermic or exothermic). How does this relate to the bond strength of the chemical species involved? Locate the approximate position of the transition state. From the analysis of the F - H2 system, the following surface potentials were produced:
It is evident here that the products are considerably lower in energy than the reactants, thus showing that this is an exothermic reaction. The reaction takes place with a very low momentum of the fluorine atom i.e. 0.5, yet still overcomes the 'transition state'. Lower energy products reflects the stability of the HF bond.
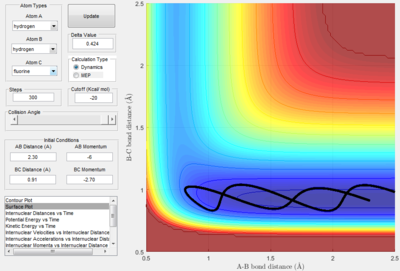
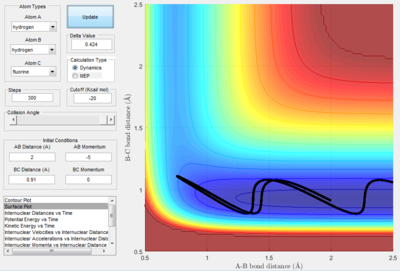
Here the reaction of HF and H is portrayed. The reaction is evidently endothermic as the products (H2 + F) are much higher in energy than the reactants. Again this reflects the strength of the HF bond relative to the H2 bond.
When the FH bond is BC respectively. As the products and the reactants are the same (i.e. a symmetrical reaction plot), you cannot determine whether the reaction is endothermic or exothermic unless a marker (such as an isotope of Hydrogen i.e. deuterium) is used.
Hammonds postulate can be used to estimate the structure of the transition state as it states 'If two states are formed consecutively, with only a small difference in energy, the transition state will resemble the stucture which is closest in energy'.
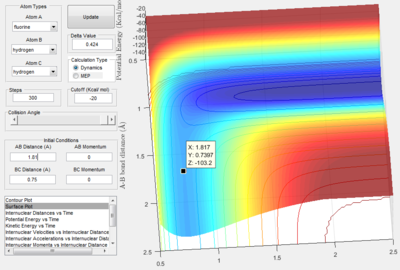
From analysis of the surface plot of the F - H2 reaction, it is evident that the transition state lays closer to the higher energy point, thus the transition state resembles the reactants. It appears that the bond H-H bond length will remain at the standard length of 0.75 Å 3 and the F-H bond will be considerable greater than its standard length of 0.91 Å 3. By manipulating the bond lengths, the trajectory of the transition state is given as a single spot at zero momentum:
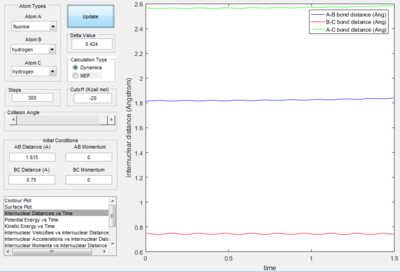
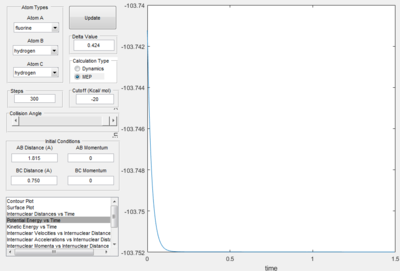
To confirm that this is the transition state, the internuclear distance v time plot shows three parallel lines (after further trial and error of the bond distances provided by the surface potential plot), thus proving that the bond distances are equal in the transition state:
Therefore the H2 (BC) bond length at the transition state is 0.750 Å and the F-H bond length is 1.815 Å.
Report the activation energy for both reactions. In order to calculate the activation energy, the following calculation can be used:
Activation energy = Energy of reactants - Energy of Transition period
The energy of the transition state from the potential energy surface is given as -103.2 kcal mol-1.
| Reaction | Reactant energy / kcal mol-1 | Activation energy / kcal mol-1 | Activation energy / kJ mol-1 |
|---|---|---|---|
| H2 + F --> HF + H | -103.3 | 0.1 | 0.4 |
| H + HF --> H2 + F | -130.6 | 27.4 | 114.6 |
A more accurate representation of the transition state can be achieved from the MEP of the potential energy vs time plot:
This plot shows that a more accurate representation of the transition is -103.75 kcal mol-1. The variations of the data is as followed:
| Reaction | Reactant energy / kcal mol-1 | Activation energy / kcal mol-1 | Activation energy / kJ mol-1 |
|---|---|---|---|
| H2 + F --> HF + H | -103.3 | -0.45 | -1.89 |
| H + HF --> H2 + F | -130.6 | 26.85 | 112.34 |
Nf710 (talk) 17:05, 2 June 2017 (BST) How can there be 2 different activation energies for a forwards and backwards reaction in the same potential energy surface?
In light of the fact that energy is conserved, discuss the mechanism of release of the reaction energy. How could this be confirmed experimentally?
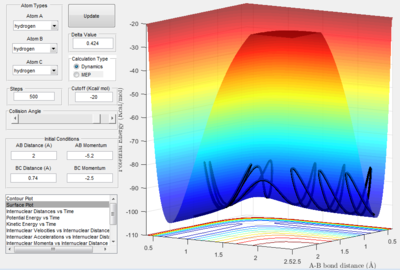
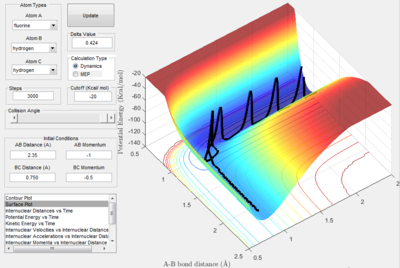
The reaction conditions and the potential surface plot were as followed: HH bond length = 0.75 Å, FH bond length = 2.35 Å. HH momentum = -0.5 Ns FH momentum = 1 Ns
When considering the conservation of energy of the system, the decrease in energy of products (i.e. as this is an exothermic reaction) must cause an increase in energy of another form. The conversion of the kinetic energy to vibrational energy is evident in the large oscillations of the reaction trajectory once the FH product has been formed. These oscillations oscillate about the point of lowest energy. The maximum energy of the oscillations is isoenergetic with the energy of the reactants thus corresponding to a conservation. The vibrational oscillations will eventually reduce as non-radiative decay causes the reduction of energy by heat emission. Initially, the momentum of the fluorine must be high enough to get close to the hydrogen molecule to initiate a reaction. Once the molecules are close enough, the reaction follows through due to the high stability of the FH bond. Calorimetry would be an effective way of measuring this reaction as it follows the heat formation due to collisions, thus corresponding to the kinetic energy of the system according to collision theory.
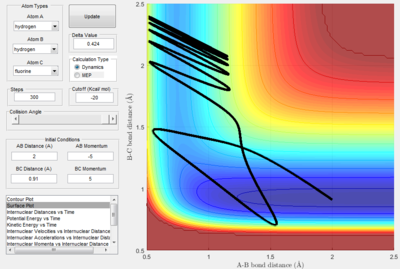
Setup a calculation starting on the side of the reactants of F + H2, at the bottom of the well rHH = 0.74, with a momentum pFH = -0.5, and explore several values of pHH in the range -3 to 3 (explore values also close to these limits). What do you observe? Note that we are putting a significant amount of energy (much more than the activation energy) into the system on the H - H vibration When the momentum is between pHH is -3 Ns to -2.6 Ns, the system has enough energy to go to completion. Between -2.6 Ns and -2 Ns the reaction has enough energy to go to completion, but reacts further to return to reactants. From -2 Ns to 1.7 Ns, the system does not have enough energy to go to completion. From 1.7 Ns to 3 Ns, the system has enough energy to go to completion.
Discuss how the distribution of energy between different modes (translation and vibration) affect the efficiency of the reaction, and how this is influenced by the position of the transition state. The relative ability for vibrational energy to promote a reaction where the transition state resembles more of the products is greater than translational energy was described by Polyani 1. Since this reaction shows a system where there is a transition period that resembles the products, Polyani's rules apply. As translational energy is prependicular to vibrational motion, on the potential surface, a large kinetic energy translational energy and no vibrational should see no reaction. The difference in values can be explained by the vibrational energy having an effect on whether the reactants can go to products.
This surface plot energy proves the prediction, that no reaction occurred. However, once the vibrational energy is increased to a point, the system can now pass over the transition period and allow for a product production.
Nf710 (talk) 17:09, 2 June 2017 (BST) Polyanis rules apply in both directions. You would just need more kenetic energy instead. if you were doing the exotheremic
Nf710 (talk) 17:12, 2 June 2017 (BST) You should have proved polyanis rules the other way. This report needs to be more concise. Your answer contain alot of unnecessary points that make it hard to read. Keep it more concise. Label your figures. Use diagrams and equations where you can to get your points across. this makes it much easier for the reader.
References
[1] Bowman, J. M. (2012). Theoretical Study of the Validity of the Polanyi Rules for the Late- Barrier Cl + CHD 3 Reaction, 4, 4–7.
[2] Atkins, Physical Chemistry, 10th Addition, Chapter 21C, pg 895.
[3] Krane, Kenneth, Modern Physics, 2nd Ed., Wiley, 1996

