Jd2615
Molecular Modelling - Optimization
NH3 molecule
Optimization of Ammonia
Ammonia was drawn and optimized using GaussView. The calculation method was B3LYP which provides a type of approximation that are made in solving the Schrödinger equation. The basis set for this calculation is 6-31G(d,p) which means a medium level accuracy. The final energy of ammonia was -56.55776873 a.u. The RMS Gradient Normal is 0.00000485 a.u. The point group of the molecule is C3V. The optimization file is linked to here
Geometric information
N-H bond length is 1.01798 Angstroms. HNH bond angle is 105.741 degrees.
Item Table
Item               Value     Threshold  Converged?
 Maximum Force            0.000004     0.000450     YES
 RMS     Force            0.000004     0.000300     YES
 Maximum Displacement     0.000072     0.001800     YES
 RMS     Displacement     0.000035     0.001200     YES
 Predicted change in Energy=-5.986277D-10
 Optimization completed.
    -- Stationary point found.
test molecule |
Vibrational modes

Ammonia with its four atoms would expect six vibrational modes according to 3N-6 rule, which is reflected in the display vibrations after the optimization. Modes 2 and 3 are degenerate and modes 5 and 6 are degenerate. Modes 1,2 and 3 are 'bending' vibrations where modes 4, 5 and 6 are 'bond stretch vibrations. Mode 4 shows a highly symmetric vibration. Mode 1 is the 'Umbrella' mode as it resembles the opening and closing of an umbrella. I would expect to see 2 band in an experimental spectrum of gaseous ammonia because modes 4 to 6 have small changes in dipole moment, so there will be no/small peak observed. Modes 1 to 3 will show only 2 peaks because 2 and three have degenerate modes.
Charge Analysis
The values of the charges for the atoms were -1.125eV for Nitrogen and 0.375eV for Hydrogen. When comparing these values with what is expected, Nitrogen would be negative as it is more electronegative, therefore it pulls electron density onto it from the N-H bond, thus making Hydrogen positive.
log File
Here is the link to the log file File:JD2615 AMMONIA OPT.LOG
Hydrogen (H2)
test molecule |
Optimization of Hydrogen
The calculation method was B3LYP. The basis set for this calculation is 6-31G(d,p) which means a medium level accuracy. The final energy of Hydrogen was -1.17853636 a.u. The RMS Gradient Normal is 0.00000017 a.u. The point group of the molecule is D∞h.
Item Table
         Item               Value     Threshold  Converged?
 Maximum Force            0.000000     0.000450     YES
 RMS     Force            0.000000     0.000300     YES
 Maximum Displacement     0.000000     0.001800     YES
 RMS     Displacement     0.000001     0.001200     YES
 Predicted change in Energy=-1.164081D-13
 Optimization completed.
    -- Stationary point found.
Vibrational modes
There is only one vibrational mode for Hydrogen, at a frequency of 4465.68Hz. However; no peak will show in an infrared spectrum because there is no change in dipole moment.
Charge analysis
The charge analysis for hydrogen shows that both charges on the atoms are 0.0eV. This is because there is no difference in electronegativity between the atoms, so no variations in electron distibutions.
Log File
Here is the link to the log file File:JD2615 HYDROGEN OPT.LOG
Nitrogen
Optimization of Nitrogen (N2)
The calculation method was B3LYP. The basis set for this calculation is 6-31G(d,p) which means a medium level accuracy. The final energy of Nitrogen was -109.52412868 a.u. The RMS gradient 0.00000060 a.u. The point group of the molecule is D∞h.
test molecule |
Item Table
Item               Value     Threshold  Converged?
 Maximum Force            0.000001     0.000450     YES
 RMS     Force            0.000001     0.000300     YES
 Maximum Displacement     0.000000     0.001800     YES
 RMS     Displacement     0.000000     0.001200     YES
 Predicted change in Energy=-3.401167D-13
 Optimization completed.
    -- Stationary point found.
Vibrational Modes
There is only one vibrational mode for Nitrogen, at a frequency of 2457.33. However; no peak will show in an infrared spectrum because there is no change in dipole moment.
Charge analysis
The charge analysis for Nitrogen shows that both charges on the atoms are 0.0eV. This is because there is no difference in electronegativity between the atoms, so no variations in electron distibutions.
Energy calculation for ammonia
E(NH3)= -56.55776873
2*E(NH3)= -113.1155375
E(N2)= -109.52412868
E(H2)= -1.17853636
3*E(H2)= -3.53560908
ΔE=2*E(NH3)-[E(N2)+3*E(H2)]= -0.05579974 a.u.
ΔE= -146.50222853 kJmol-1
According to the values in a.u., the molecule is more stable as ammonia because the production of ammonia is exothermic resulting in a product that's lower in energy than the reactants.
Log file
Here is the link to the log file File:JD2615 OPT NITROGEN.LOG
Molecular Modelling - Molecule of choice
Methane (CH4)
test molecule |
Optimization of Methane
The calculation method was B3LYP. The basis set for this caluclation is 6-31G(d,p) which means a medium level accuracy. The final energy of Nitrogen was -40.52401404 a.u. The RMS gradient 0.00003263 a.u. The point group of the molecule is TD.
Item Table
Item               Value     Threshold  Converged?
 Maximum Force            0.000063     0.000450     YES
 RMS     Force            0.000034     0.000300     YES
 Maximum Displacement     0.000179     0.001800     YES
 RMS     Displacement     0.000095     0.001200     YES
 Predicted change in Energy=-2.256034D-08
 Optimization completed.
    -- Stationary point found.
Geometric information
The C-H bond length for methane is 1.09197 Angstroms and the HCH angle is 109.471 degrees.
Vibrational Modes
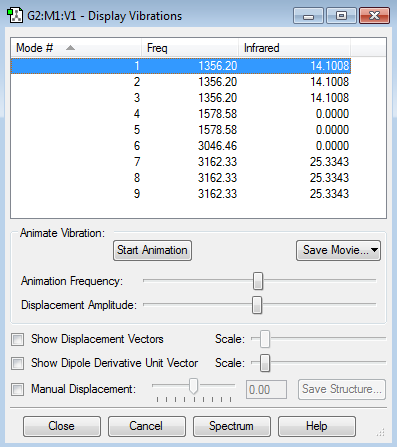
There are 9 vibrational modes available for Methane, however only 2 peaks in an infrared spectrum will be visible. Degenerate modes 1-3 will be seen as a peak and degenerate modes 7-9 will also be a peak. The modes 4-6 will show no peak as there is no change in dipole moment for an infrared absorption.
Charge Analysis
Charge analysis of methane shows that the charge on both atoms is 0.233 and -0.930 for Hydrogen and Carbon respectively. This is due to the greater electronegativity of Carbon which draws electron density from the CH bond onto it, increasing electron density around it and making it negative compared to Hydrogen.
Log file
Here is the link to the log file File:JD2615 METHANE OPT.LOG
Molecular Orbitals of Methane
This AO is the 1s orbital around the Carbon atom. This orbital is too low in energy, thus too close to the nucleus of the Carbon atom to interact with the 1s orbitals of the Hydrogen.
This orbital is the lowest energy sigma bonding MO. It involves the interaction of one of the 1s of Hydrogen and the 2s of the Carbon atom.
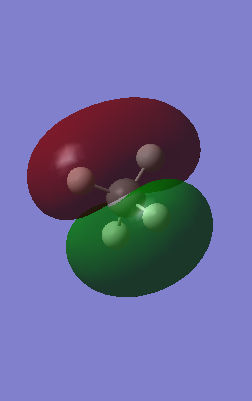
This sigma orbital is composed of the 1s of hydrogen and the 2px of carbon.
This sigma orbital is composed of of the 1s of hydrogen and the 2py of carbon.
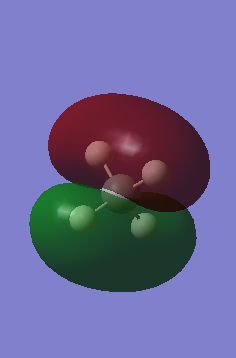
This sigma orbital is composed of the 1s of hydrogen and the 2pz of carbon.
All these orbitals ore occupied with 2 electrons each of which are all bonding orbitals. It is also possible to qualitatively describe these orbitals with Ligand group orbitals (LGOs), which are often represented in a Molecular Orbital diagram.
Ethanal (CH3CHO)
test molecule |
Optimization of molecule
The calculation method was B3LYP. The basis set for this calculation is 6-31G(d,p) which means a medium level accuracy. The final energy of Ethanal was -153.83572833 a.u. The RMS Gradient Normal is 0.00000576 a.u. The point group of the molecule is C1.
Geometric information
The geometric information of Ethanal is as follows. The CH bond length for the methyl group is 1.09693 Angstroms. The CH bond length for the Carbonyl group is 1.11435 Angstroms. The CC bond length is 1.50723 Angstroms. The CO bond length is 1.21070 Angstroms. The CCO angle is 124.642 degress. The CCH (Carbonyl group Hydrogen) angle is 114.770 degrees. The CCH (Methyl group Hydrogen) 110.500 degrees.
Item table
Item               Value     Threshold  Converged?
 Maximum Force            0.000009     0.000450     YES
 RMS     Force            0.000005     0.000300     YES
 Maximum Displacement     0.000682     0.001800     YES
 RMS     Displacement     0.000373     0.001200     YES
 Predicted change in Energy=-4.915085D-09
 Optimization completed.
    -- Stationary point found.
Vibrational modes
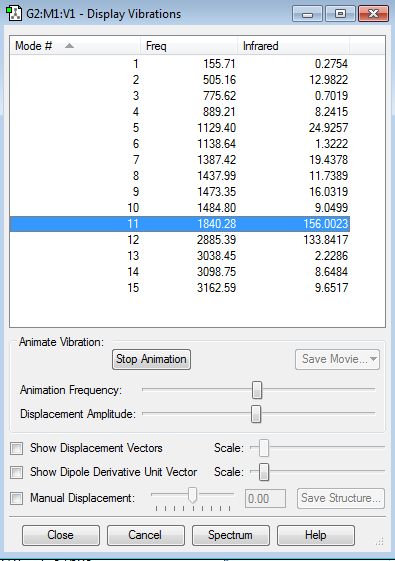
There are 15 vibrational modes available. Some of the lower Infrared values will not show large peaks in an infrared spectrum. The most iconic peak for a Carbonyl compound is the Carbonyl stretch at a frequency around 1850Hz (Vibrational mode 11). Another large peak in the Infrared spectrum will be at 2885.39Hz (Vibrational mode 11) which corresponds to the CH stretch where the CH bond is in a Carbonyl group.
Charge Analysis
On the Methyl group of ethanal, the charge of the Carbon is -0.794 eV and 0.256 eV. This shows that the Carbon is more electronegative than the Hydrogen, therefore drawing electron density onto it. Also the charge on the adjacent Carbon atom is 0.409eV. The positive charge on the carbon of the Carbonyl group is due to the electronegativity of the Oxygen atom (Charge = -0.521eV) which draws electron density off the Carbonyl Carbon, thus making it partially positive.
Molecular orbitals
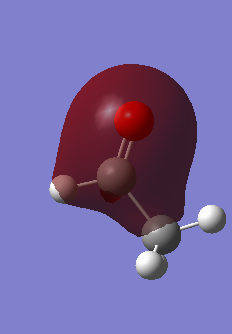
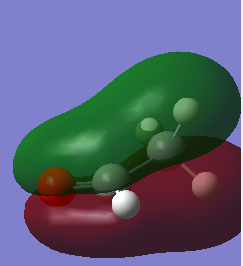
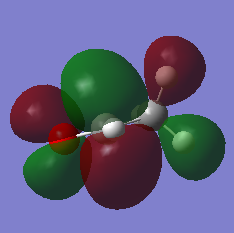
This MO is the interaction between the C 2s orbital and the Oxygen 2s orbital to form a sigma bond between the Oxygen and the Carbon. The electron density surrounds both the Carbon and Oxygen of the Carbonyl group, whereas also stretching out slightly over the C-C and C-H bond.
This MO sees s contribution from the atoms of the methyl group and the CH of the carbonyl group forming a sigma bond stretching electron density over all these contributing atoms. There is also s contribution on the Oxygen atom which contributes to the Sigma star (antibond) between the carbon and the oxygen.
This MO sees p contribution from the Oxygen atom and the two Carbon atoms to form a Pi bond between the Carbon and the oxygen, where the electron density stretches out over the methyl group due to s contribution from the hydrogen atoms. The Pi system is above and below the plane of the carbonyl group.
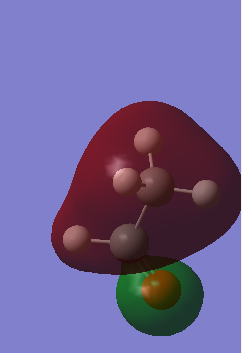
This orbital sees p contribution from the Oxygen atom forming a Pi star (antibond) between the Carbon and the Oxygen atom of the Carbonyl group. The p contribution to the Pi star overlaps with the s contribution of the Hydrogen atom on the Carbonyl group, causing electron density between the atoms and forming a sigma bond. This is also the case between the two carbon atoms where the p orbitals overlap to form a sigma bond.
This orbital is the LUMO of ethanal which is the Pi star due to contributions from 2p orbitals of the Oxygen and the Carbon of the carbonyl group. Also there is contribution from the 2p orbitals of the methyl group which overlaps with the Hydrogen 2s orbitals, causing sigma bonds. The larger lobe above the Carbon Atom is the site of electron overlap during Nucleophilic attack of a carbonyl.
Log file
Here is the link to the log file File:JD2615 ETHANAL OPT 3.LOG

