JadeDamon2
Techniques of molecular mechanics and semi-empirical molecular orbital methods for structural and spectroscopic evaluations
Introduction
Molecular mechanics can be used in order to study and probe the properties of molecules including molecular strain, stereoselectivity and steric effects as well as determining which of two or more conformations will be more favorable. This was the first method used for modelling in this project. This is undergone by optimizing the molecular geometry in order to achieve a minimum energy structure. From this the final energy can be analysed with respect to its individual energy contributions including bending, stretching, van der waals contribution and torsion. For this part of the project, ChemBio3D was used in order to determine the minimum energy structures for a range of molecules.
However, molecular mechanics does have some limitations. As a parametric method, it uses an interpolative technique, as it acquires and uses data from previously experimentally characterized molecules which means that it is unable to investigate molecules which are not deemed 'well known'. Thus, this method is unable to model the kinetic control of a reaction which is often sought-after by computational chemists. Likewise, molecular mechanics cannot be used for functional groups which the program does not have pre-stored data for, once again making unusual molecules hard to analyse. As a final point, in order to investigate the properties of molecules which require a knowledge of the electron distribution of a molecule including aromaticity and frontier orbital interactions, one must use quantum mechanical methods such as molecular modelling rather than molecular mechanics.
Therefore, the second part of this project required the use of semi-empirical and DFT molecular orbital theory in order to investigate regioselectivity effects and Neighbouring group participation as well as monosaccharide chemistry.
The last part of the project was concerned with simulating the spectroscopic data of a literature molecule which has two isomers. The NMR and IR data was computed and compared with experimental values. This helped determine whether 13C and 1H predicted data using the GIAO approach can be used in order to assign the NMR to each isomeric product.
The hydrogenation of the cyclopentadiene dimer
Dimerization of cyclopentadiene

Dicyclopentadiene is a highly useful reactive intermediate and therefore has a wide range of applications including hydrogenation and polymerization reactions. [1]
Cyclopentadiene dimerises in a Diels alder reaction, or more specifically a [4+2] cycloaddition, which theoretically could yield two different products, the exo- and endo-isomer. In reality however, the endo-isomer is synthesized exclusively and this dimerisation was considerably studied by Alder and Stein.[2] (the endo product is seen on the right in the adjacent scheme).
Chembio 3D was used in order to determine the total energies of the endo- and exo-isomers by optimizing the molecules using an MM2 (molecular mechanics 2) field and the results are summarized in the table below.
| Endo-isomer | Exo-isomer | |
|---|---|---|
| Energy (kcal/mol) | 33.9975 | 31.8765 |
| dipole-dipole | 0.4475 | 0.3775 |
Exclusivity of one product being formed over another suggests that the reaction is either thermodynamically or kinetically controlled. The thermodynamic product is the one which is the most thermodynamically stable and hence has the lowest overall energy, whereas the kinetic product is the one which is produced fastest and via the lowest energy transition state. Because of this the thermodynamic reaction is reversible whilst the kinetic reaction is irreversible.
The energies of the two isomers in the table above show that the exo-isomer is lower in energy than the endo-isomer, meaning that the exo-isomer is the most thermodynamically stable. Hence,the reaction is kinetically controlled with the endo-transition state being lower in energy than the exo-transition state meaning that it is formed first. This makes sense when considering the reaction scheme as diels-alder reactions occur at low temperatures and are irreversible, conditions which best suit a kinetically controlled reaction.
The relative stability and therefore preferential synthesis of the endo-product can be attributed to the Endo-rule. The endo-rule states that the endo-isomer of a product will be formed despite the exo-isomer being more stable. This is because of favourable bonding interactions and can be best observed in an illustration of the frontier orbitals as shown below.
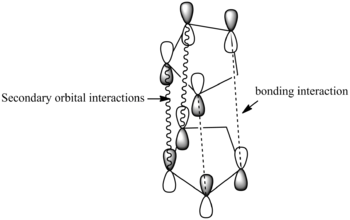
On forming the endo product the cyclopentadiene molecules come together such that the orbitals are in the correct symmetry and a new σ-bond is formed as shown by the dashed lines. However, this is not the only interaction between orbitals that occurs, there is a secondary orbital interaction between the orbitals of the alkenes as shown by the wavy lines. These attractive HOMO/LUMO interactions lead to an association between the two molecules that stabilizes the endo-transition state and encourages the molecule to come together forming the endo-product only.[3]
The dihedral angles in the two molecules can also be compared as the torsional energy is higher in the endo-form than the exo-form. This can be credited to the fact that as seen in the jmol files of both molecules, the exo-isomer has an almost antiperiplanar conformation whereas the endo-isomer is much more compressed resulting in the higher energy.
Hydrogenation of dicyclopentadiene
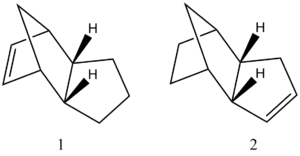
Looking in more detail at the hydrogenation reaction of dicyclopentadiene, two different dihydro comformations are initially formed as shown in the adjacent scheme. After a prolonged period of hydrogenaton,the tetrahydro comformers are formed. The energies of the different dihydro isomers was also determined by optimization of the molecule using ChemBio 3D, with the results for the total energy as well as the relative components of the total energy being shown in the table below.
| Isomer 1 | Isomer 2 | |
|---|---|---|
| Energy (kcal/mol) | 34.9643 | 29.2475 |
| dipole-dipole (kcal/mol) | 0.1622 | 0.1410 |
| stretching contribution(kcal/mol) | 1.2856 | 1.1303 |
| bending contribution (kcal/mol) | 20.5791 | 13.0161 |
| torsion contribution(kcal/mol) | 7.6552 | 12.4120 |
| Van der waals contribution(kcal/mol) | 4.2331 | 4.4395 |
The energy of isomer 2 is lower than isomer 1 and hence it can immediately be shown that the second isomer is more thermodynamically stable than the first. An explanation for this mismatched stability can be provided by looking at the difference in ring strain between each molecule. The alkene bond angles in isomer 1 consists of a 109.8° C-C=C bond angle whilst isomer 2 has and average C-C=C bond angle of 112.8°. Comparing these angles to the idealised sp2 angles of 120° confirms that the angles in isomer 1 would be more compressed and hence strained and this clearly explains why isomer 1 is less stable. Looking at the bending energy which is the energy association caused by the angle between atoms, also assists in this explanation, as the bending energy is much lower in isomer 2, again suggesting that isomer 1 experiences higher ring strain. The stretching energy contribution refers to the energy association of stretching bond lengths away from their optimal bond length and in this case the stretching contribution is smaller in the more thermodynamically stable isomer.
Thus, the thermodynamic product has been found to be isomer 2.
Taxol is a pharmaceutical drug which is used in the treatment of a variety of cancers including breast, lung and ovarian cancer. Synthesising the molecule via an oxy-cope rearrangement primarily leads to the synthesis of two different isomeric intermediates, one with the carbonyl pointing up(3 in the diagram below) and one with the carbonyl pointing down(4). This Oxy-cope rearrangement was investigated and found to be a reversible process as shown in the scheme below.[4]
The two isomers are known to exhibit antropisomerism, which is the distinction between two different conformations and this arises due to restricted rotation about a bond, in this case the single bond attached to the carbonyl and this prevents interconversion between the two intermediates. Clearly, it can be seen that the addition of the carbonyl depends on which isomer is most stable.

The most stable antropisomer was investigated and ChemBio 3D was used to run an MM2 force-field in order to determine the lowest energy conformation and optimize the two intermediates.
| 3 | 4 | |
|---|---|---|
| Energy (kcal/mol) | 47.8396 | 41.3808 |
| dipole-dipole (kcal/mol) | -1.7249 | -2.0090 |
| stretching contribution (kcal/mol) | 2.7840 | 2.6020 |
| bending contribution (kcal/mol) | 16.5397 | 10.4186 |
| torsion contribution(kcal/mol) | 18.2556 | 19.3771 |
| Van der waals contribution (kcal/mol) | 13.1106 | 12.9186 |
Both isomers originally appeared to have a boat conformation of the cyclohexane ring after MM2 optimization, a high energy form and in order to lower the energy of the two isomers further, both were converted to chairs, a known energy minima as illustrated by the simplified diagram[5]. This allowed the lowest energy structures to be found. It could also be assumed from this that the lowest energy isomer would yield the lowest energy values for each conformer shown in the graph.
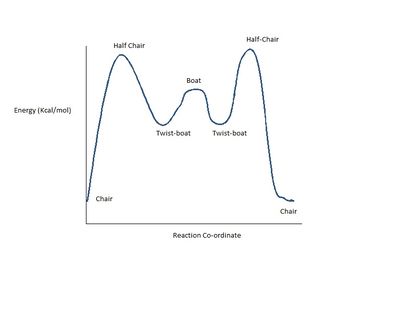
The table summarizing the energies of isomers 3 and 4 shows that the lowest energy intermediate is isomer 4, which results in it being the the most theromodynamically stable isomer. Therefore, it would be expected that eventually the least stable isomer(3) would be converted to its more stable pair, the carbonyl pointing down isomer(4) and this was infact seen experimentally as shown by L.Paquette et al. [6]. The reasons for this isomers superior stability can be attributed to the individual energy components, for example its lower bending and stretching energies. These show that isomer 4 has a less strained geometry than isomer 3 hence making it more stable.
| 3 | 4 | |
|---|---|---|
| Energy (kcal/mol) | 70.5501 | 61.2786 |
This set of isomers then under went an MMFF94 field optimization with the results being summarized in the table above.Comparing these values directly to those run using the MM2 field shows that the energy values between the two methods differ significantly. This is not surprising considering that the two different force fields use different methods for optimization. The first, MM2 reproduces, as precisely as possible the equilibrium covalent geometry of the inputed structure by using a large set of parameters which are updated regularly for experimentally investigated molecules. Comparatively, MMFF94 uses ChemBio3D to examine the molecule in terms of each atom and then calculates a new position of each atom such that the potential energy of the molecule is minimized. Using this new position each atom in the model is moved in order to achieve a minimum total energy. [7] Although these are different calculation techniques producing different values, the pattern remains the same with isomer 4 being lowest in energy and hence it can confidently be confirmed that isomer 4 is the most stable isomer looking at both force-field methods.
Reactivity of the alkene in the taxol intermediate
As isomer 4 is the most stable isomer, it's assumed that this is the isomer that would undergo further reaction. However, the hydrogenation of the alkene is a process which occurs very slowly and the reason for this can be explained by discussing hyperstable alkenes and Bredt's rule. Bredt's rule states that a double bond cannot be placed on a bridgehead of an ring system molecule and hence, when alkenes placed on Bridgeheads were discovered they received special treatment by scientists. It was learnt that these special bridgehead alkenes, known as hyperstable alkenes were less strained than there parent hydrocarbons, a phenomenon known as negative Olefin strain energy, which can be computed by empirical force field programs. This can be attributed to the fact that there is twisting around these double bonds, which reduces the π-overlap, causing the HOMO energy to increase and comparably the LUMO energy to decrease, resulting in an overall smaller HOMO-LUMO gap. Thus,the hyperstable alkenes, although still showing strain due to the alkene and the ring, have comparatively decreased reactivity due to the location of these double bonds. [8] The reason that these hyperstable alkenes are stabilized is due to their location at the bridgehead, which makes these molecules more thermodynamically stable than molecules with the alkene located at a different position and are therefore much harder to hydrogenate.
Regioselective Addition of Dichlorocarbene to a diene

Molecular orbital theory was then used in order to investigate the regioselective addition of dichlorocarbene to a diene, the reaction scheme for which can be seen above. Reactivity can be controlled by orbitals in reactions which involve electrophilic reagents such as dichlorocarbene. This reaction cannot be fully modeled using the MM2 force-field method used previously and instead also requires a MOPAC interface optimization as this can correctly predict the energy of the orbitals calculated and is also able to produce visualizations of the orbitals. This reaction is particularly interesting to investigate as the electron interactions within the diene determines which alkene in the diene reacts with the dichlorocarbene.
The diene was first optimized using an MM2 force-field which gave an minimum energy value of 17.8945 Kcal/mol and was then optimized again, this time using MOPAC(MP6) giving a heat of formation of 22.8277 Kcal/mol. The geometries found by these optimizations were then compared by overlaying the two molecules and the result is shown in the table below.
| superimposed structures |
| |||
| C(27)-C(2) | 0.1299 Å | |||
| C(33)-C(8) | 0.0687 Å | |||
| C(28)-C(3) | 0.0771 Å |
Looking at the overlay shows that there is a difference between the two optimization methods, when inspecting the total geometry of the molecules, when they are superimposed(MM2 top face, MOPAC bottom face). This is due to the fact that the electronic effects are amplified in the MOPAC calculation as it takes into consideration through space interactions, so it shows that the chlorine atom and the electron rich alkene repel each other, causing this alkene containing ring to be pushed down compared to that same alkene containing ring in the MM2 optimization.
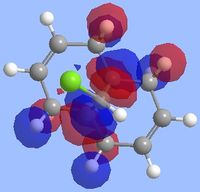
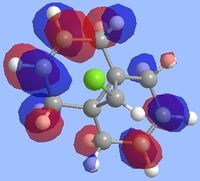
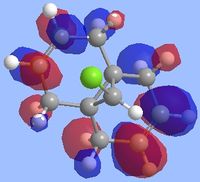
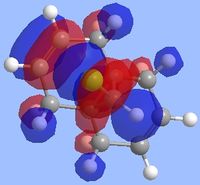
Literature states that the dichlorocarbene should react on the alkene which is endo to the chlorine substituent[9](the alkene on the opposite face) and the reason for this can be explained by looking at the molecular orbitals which were computed as shown below. The key points to look at in these molecular orbitals are their energies and also the electron density distribution as this can help identify why this reaction is regioselective.
From the molecular orbital visualizations it can be seen that the highest occupied molecular orbital(HOMO)contains most of its electron density localized onto the alkene which is next to the chlorine atom within the diene(the endo alkene). This would suggest that the this particular alkene acts as a nucleophile and hence would be most likely to react with the dichlorocarbene, an electrophile. Conversely, the LUMO orbital shows that the alkene which is on the opposite face of the chlorine(the exo alkene) has a larger electron density contribution in the LUMO and hence this alkene would preferentially react with nucleophiles.
Two other molecular orbitals which assist in explaining the reaction regioselectivity is the HOMO-1 orbital and the LUMO+2 orbitals as these visualizations show an important interaction, an antiperiplanar orbital interaction between the Cl-Cσ* and the exo alkene πC=C bond. This leads to an increased stabilization of the exo alkene compared to the endo alkene, making it respectively less reactive for an electrophilic addition.
Stretching frequency analysis
The stretching frequency was run and the file uploaded to D-space can be found here:DOI:10042/22950 . The stretching frequencies for the key bonds are shown in the table below.
| Bond | frequency (cm-1) |
|---|---|
| endo alkene | 1757.34 |
| exo alkene | 1737.03 |
| c-cl | 770.86 |
The πC=C bond from the exo alkene is shorter than the endo alkene, which confirms the result seen by the molecular orbital interaction. This is because the orbital interaction and the donation of electron density from the C-Clσ* orbital results in an increase in the anti-bonding character of the exo double bond, causing the bond to weaken and hence the stretching frequency to decrease reducing the double bond character of the alkene.
Thus, the information gained from both the molecular orbital analysis and the stretching frequency analysis explain the results found in the literature written by Rzepa et al.
Monosaccharide chemistry and the mechanism of glycosidation

Glycosidation is the process by which a carbohydrate replaces a functional group X with a nucleophile as shown in the mechanism above. In this mechanism the reaction is assisted intramolecularly by the C-OAC bond and the stereochemistry of this bond determines the overall stereochemistry of the product and in particular the stereochemistry of the Nu-C bond. This phenomena is due to the neighboring-group-participation, a process which occurs if a functional group is placed near a reaction centre, such that the neighbouring group is able to change the course of a reaction or even assist in the departure of a leaving group[10], as seen here. More specifically for this reaction the NGP occurs from this adjacent acetyl group in the first intermediate forming the oxonium cation in the second intermediate. The nucleophile which attacks the cation can either attack from the top or bottom face and which face it attacks depends on whether the final product is an α-anomer or β-anomer form.
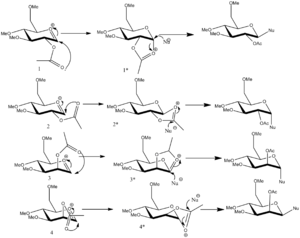
There are four possible conformational orientations with which the carbonyl oxygen of the acetyl group can exist two axial and two equatorial and these are shown in the scheme below(numbered 1-4) with the secondary intermediates formed shown respectively (1*-4*). Two different optimizations were carried out on the molecule in order to gain the minimum energy structure, MM2 and MOPAC/PM6. The 4 conformations which were computed were acetyl group equatorial down, acetyl group equatorial up and two differing acetyl axial up positions and these are shown(1-4 in the scheme below). The minimum energy structures for the secondary intermediates for each of these conformations were also computed (1*-4* in the scheme below).
| Intermediate | ||||||||
|---|---|---|---|---|---|---|---|---|
| Stretch(kcal/mol) | 2.6661 | 2.4372 | 2.8693 | 2.3915 | 1.9317 | 2.7313 | 1.8502 | 2.6549 |
| Bend(kcal/mol) | 12.4960 | 10.5318 | 12.7240 | 15.1759 | 21.2267 | 18.3697 | 14.4197 | 18.9403 |
| Stretch-bend(kcal/mol) | 0.9411 | 0.8663 | 1.0681 | 0.8630 | 0.6964 | 0.7491 | 0.6022 | 0.8981 |
| Torsion(kcal/mol) | 0.1163 | 4.0772 | 1.7906 | 2.2224 | 7.6803 | 5.8009 | 7.6630 | 6.7143 |
| Non-1,4VDW(kcal/mol) | 0.6339 | -1.6510 | 1.4880 | -3.7508 | -4.4725 | -3.6347 | 18.5191 | -2.0099 |
| charge/dipole(kcal/mol) | -26.8418 | -16.7682 | -26.9359 | 1.8714 | 3.0367 | 2.4246 | 2.5432 | -0.7517 |
| dipole/dipole(kcal/mol) | 8.9542 | 5.9611 | 7.1662 | 3.9341 | -0.2560 | -1.2093 | -0.1660 | 0.0086 |
| MM2 total energy(kcal/mol) | 17.4855 | 26.0749 | 18.8028 | 36.3280 | 41.7248 | 44.0602 | 40.2936 | 44.8377 |
| MOPAC heat of formation(kcal/mol) | -88.09863 | -79.64669 | -88.33690 | -69.36273 | -91.64257 | -66.84380 | -86.31145 | -62.99549 |
The table above shows the individual energy components and the total energy(kcal/mol)from the MM2 optimization and the heat of formation(kcal/mol)from the MOPAC optimization. The table clearly shows that isomer 1 and isomer 3 are the lowest energy structures and looking at the scheme shown above can explain why. Both isomer 1 and 3 form the trans-products rather than the cis-prducts and as literature[11] states that the trans-product is almost exclusively formed for this reaction and the lower energy intermediates could provide an explanation for this. It can also be noted from that table that as expected, all of the secondary intermediates are higher in energy than their primary counterparts. The reason why this is expected is due to the fact that the molecule becomes more strained due to the formation of a ring in each case. These secondary intermediates(1*-4*) can also aid in the explanation of why the cis-product is formed in the cases of intermediates 2* and 4*. These intermediates are higher in energy than the trans-product intermediates, due to the fact that these acetyl containing rings are distorted and hence they hinder the attack of the nucleophile in a trans position so that the cis-products are formed instead.
Comparing these energies with those computed by MOPAC optimization show a similar pattern, with intermediates 1 and 3 being lower in energy than 2 and 4. MOPAC optimization differs from MM2 due to the fact that the first method able to form bonds with weren't initially depicted and break those that were.
The difference between MM2 and MOPAC was then investigated further by analyzing the bond distances between the anomeric carbon and the acetyl oxygen for the primary intermediates with the results being shown in the table below.
| 1 | 2 | 3 | 4 | |
|---|---|---|---|---|
| MM2(Å) | 2.7 | 3.8 | 2.6 | 4.1 |
| MOPAC(Å) | 1.6 | 3.8 | 1.5 | 3.9 |
It is evident from the table above that the distances between atoms are smallest for the two lowest energy conformations. This is easily rationalized as the additional strained and distorted nature of the conformations of intermediates 2 and 4 would indeed result in the increased bond distance between the anomeric carbon and acetyl oxygen. The reason why the decreased distances lead to a lower energy can also be explained as being due to the fact that a decrease in atom distance would lead to a more favorable interaction between atoms and therefore a lower energy. The decrease in distance for all intermediates when using MOPAC over MM2, bar 2 which is the same, could be explained by the method MOPAC uses to undergo optimizations as previously described. By making and breaking bonds the MOPAC optimization may have produced an optimization which brought the anomeric carbon and acetyl oxygen closing by changing existing bonds, thereby decreasing their distances.
Lastly, the O-C-O angles for intermediates 1-4 using the MOPAC optimization were studied and can be found in the table below.
| 1 | 2 | 3 | 4 | |
|---|---|---|---|---|
| 104.8° | 153.6° | 102.3° | 153.3° |
Comparing these angles to the Bürgi-Duntiz angle of 107° [12] which is an ideal angle of attack of the nucleophile in an SN1 reaction yields interesting results. Intermediates 2 and 4 have bond angles which differ significantly from this idealized angle and this suggests that these do not have strong neighboring-participation-interactions and hence are less stabilized structures, where as intermediates 1 and 2 have much closer angles and hence the formation of these would be greatly favored, again justifying why the trans-product is preferentially formed.

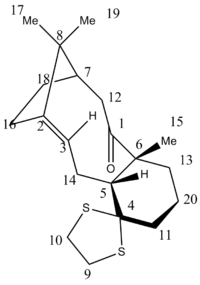
Spectroscopic analysis is an important technique which can be used to decipher between different isomers of a molecule. More specifically, NMR spectroscopy is a great tool for identifying molecules as it gives information on molecular environment in terms of chemical shift values and also the connectivity between the atoms in the molecule. Computational modelling can be used in order to predict and model the NMR spectra of molecules and this can then be compared and contrasted with known literature values. The 13C NMR data for another intermediate of taxol as shown in the scheme below was computed. Firstly, the molecule was optimized using an MM2 force-field optimization giving an energy of 64.2215 kcal/mol. The geometry and the density functional level(DFT) were then calculated by undergoing a RB3LYP Gaussian optimization with a 6-31G(d,p) basis set. Once this was achieved, another calculation was run on the optimized molecule and this allowed the NMR spectrum for the intermediate to be computed. The calculation file was uploaded to D-space and can be found here:DOI:10042/23043 .
The table below describes the 13C NMR spectrum chemical shift values for both the computed molecule and also those found in literature[6].
| Atom No. | Computed chemical shift(ppm) | Literature value chemical shift (ppm) | Chemical shift difference |
|---|---|---|---|
| 1 | 209.211 | 211.49 | 2.279 |
| 2 | 146.7965 | 148.72 | 1.9235 |
| 3 | 117.6815 | 120.9 | 3.2185 |
| 4 | 83.457 | 74.61 | -8.847 |
| 5 | 62.5735 | 60.53 | -2.0435 |
| 6 | 53.1038 | 51.3 | -1.8038 |
| 7 | 51.7128 | 50.94 | -0.7728 |
| 8 | 47.0751 | 45.53 | -1.5451 |
| 9 | 44.7995 | 43.28 | -1.5195 |
| 10 | 40.3557 | 40.82 | 0.4643 |
| 11 | 39.6814 | 38.73 | -0.9514 |
| 12 | 34.9447 | 36.78 | 1.8353 |
| 13 | 31.5697 | 35.47 | 3.9003 |
| 14 | 28.6537 | 30.84 | 2.1863 |
| 15 | 26.0437 | 30 | 3.9563 |
| 16 | 25.8413 | 25.56 | -0.2813 |
| 17 | 23.0122 | 25.35 | 2.3378 |
| 18 | 22.062 | 22.21 | 0.148 |
| 19 | 20.836 | 21.39 | 0.554 |
| 20 | 17.8172 | 19.83 | 2.0128 |
The differences in chemical shift values between literature and computed chemical shifts values were then calculated and this was combined and shown in the bar chart below, which shows the chemical shift difference in ppm for each carbon atom in order of decreasing total chemical shift value. The atom numbers correspond to the carbon atoms labelled in the diagram.
The table and bar chart show that the results between computed and experimental values for most atoms are very similar showing good levels of accuracy. There is a discrepancy however, with carbon atom 4, as there is a difference in chemical shift value of 8.8 and this can be explained as some carbon atoms being attached to heavier atoms, for example sulphur atoms in this case, can result in the computed values undergoing spin orbit coupling errors and this explains why the values differ heavily in this case. Apart from this anomaly all values are within a suitable range and hence it can be concluded that the isomer has been correctly assigned by literature values and also shows how valuable computational modelling is for determining the difference between isomers and looking at spectroscopic data.
2-phenyl-3-(pyridin-4-yl) and 3-phenyl-2-(pyridin-4-yl) pyridine derivatives: equimolar isomers
Introduction
Aromatic and substituted-aromatic rings form important components of many biological molecules both natural and synthetic and a vast number of these involve isomers and the stereochemical control of these isomers has become very important. The molecules to be investigated in this project are the two isomers 2-phenyl-3-(pyridin-4-yl)-1H-pyrrolo[3,2-c]pyridine and 3-phenyl-2-(pyridin-4-yl)-1H-pyrrolo[3,2-c]pyridine with isomer 1 being shown on the left and isomer 2 on the right of the scheme shown below. These molecules are particularly important due to their biological properties as the azaindole ring is a key part of the skeleton of kinase inhibitors[13] and HIV-1 inhibitors[14].

The synthesis above occurs via a palladium catalyzed heteroannulation giving a 50:50 ratio of isomers 1 and 2 at a moderate yield of 60%.[15] M.livecchi and el investigated whether the cause of the regioselectivity was due the initial alkynes differing electronic R groups, with the phenyl ring (R1 showing differing properties to the electron rich pyridine ring. However, as the ratio of isomers was equimolar this was found not to be the case and the rest of this project will be used to look at the similarities and differences that arise between these isomers using spectroscopic techniques and hence will allow one to look at if the isomers can be differentiated between using NMR and IR spectroscopy.
Optimization
Firstly, the two isomers were optimized using an MM2 force-field and as the molecules have a very rigid structure with few possible conformations and minimal free rotation, the minimum energy structures are shown in the table below along with their individual energy contributions.
The structure of the isomers can be found in the table below:
| Isomer 1 | Isomer 2 | |
|---|---|---|
| Stretch | 1.5313 | 1.4826 |
| Bend | 17.2427 | 17.1276 |
| Stretch-Bend | 0.1069 | 0.0963 |
| Torsion | -1.2606 | -1.1760 |
| Non-1,4 VDW | 1.2357 | 1.0068 |
| 1,4 VDW | 18.9498 | 18.9891 |
| Dipole/Dipole | 0.3183 | 0.2681 |
| Total Energy(kcal/mol) | 38.1240 | 37.7946 |
The optimized conformations for both molecules involve the two non-fixed aromatic rings in an out of the plane conformation, minimizing the steric effects and lowering the total energy of the structures. The energies of the two isomers confirm that the isomers are very similar as shown by both their total energies and also their individual energy contributions. The similar bending energies show that the isomers are equally strained due to the number of rings and the total energies validate that the isomers are equivalently thermodynamically stable and hence this explains why both molecules are equally synthesized in a 50:50 ratio as neither would be preferential over the other in terms of energy.
13C NMR analysis
Next, the 13C NMR was computed for both isomers by optimizing the geometry using the density functional level(DFT) which was calculated by undergoing a Gaussian optimization. Once this was achieved, another calculation was run on the optimized molecule and this allowed the NMR spectrum for the isomers to be computed. The files were uploaded to D-space and the file for isomer 1 can be found here:DOI:10042/23065 and the file for isomer 2 found here:DOI:10042/23066 . Both NMR spectra were computed in DMSO as this allowed for direct comparison with the literature NMR chemical shift values.
Some discrepancies were found between the computed 13C NMR shift values and those found in literature[15] with the chemical shift values for both isomers being found in the table below.

The first difference which was observed between computed and literature values was the number of chemical shift values. Where all 18 carbon's were correctly identified using computational methods, only 13 chemical shift values were identified from the experimental data and therefore in order to adequately compare the different methods and identify the two isomers, similar literature value chemical shifts were assigned to more than one computational chemical shift value as this is what M.Livecchi et al appears to have done, although some chemical shift values appear to have been ignored altogether. There are also two distinct chemical shift values for each isomer specifically 149.9ppm and 128.8ppm for isomer 1 and 149.6ppm and 129.4ppm that appear in literature but not in the computed data and a number of hypotheses could be considered to explain this. Firstly, that an impurity was present in both samples which would account for these values or, that there was a typing error in the write up of the journal.
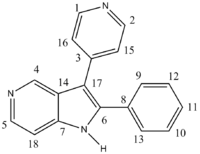
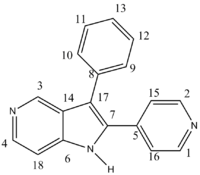
The structures below show the atoms discussed in the table for each isomer.
| Isomer 1 | Isomer 2 |
|---|---|
 |
 |
The compatibility of the remaining literature and computed chemical shift values taking into account the assumptions made above, are shown in the bar charts below which quantitatively show the differences in chemical shifts between computed and experimental values.
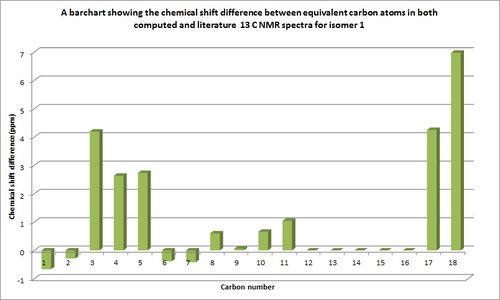
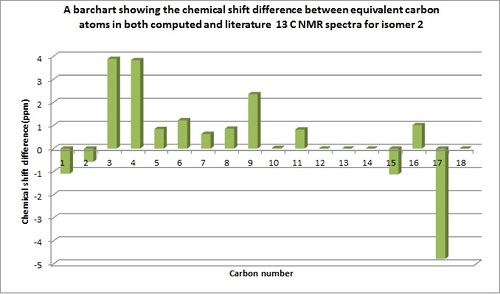
It should be noted that some of the computational chemical shift values which were not seen in literature are displayed by a zero chemical shift difference on the bar charts. The reasons that these were not found could be due to reason previously stated, the carbons which appear to have not be assigned. From the comparable chemical shift values it can be seen for both isomers that there is a good similarity between the chemical shift values with most having less than 4ppm chemical shift difference. Any dissimilarities between chemical shift values i.e for isomer 1 atom 18 and isomer 2 atom 17 could be due to the slight conformational flexibility of the molecule. The computed NMR value will only calculate chemical shift values for the depicted isomer conformations, whilst the experimentally produced NMR's would take into account all conformations of the molecules including conformations due to bond rotations and also intra molecular atom exchanges.
From the images of the two structures it would appear that the two atoms on each molecule which would distinguish between the two isomers would be atoms 17 and 6 for isomer 1 and 17 and 7 for isomer two as these are the atoms which are connected to the varying groups. But in hindsight and looking at more detail at the potential carbon environments, due to the nature of the R groups, with the piridyl ring featuring a N atom so far away from the carbons being discussed, the four carbons would experience little effect from the nitrogen and hence these carbons could not be used to distinctively differentiate between the two isomers and this is shown in the table above where both literature and computational values only margainly vary between the two respective molecules. Therefore, I believe that they would have been unable to distinguish between the two isomers based on 13C NMR. This disbelief furthered when comparing the literature values recorded for each isomer as shown below.
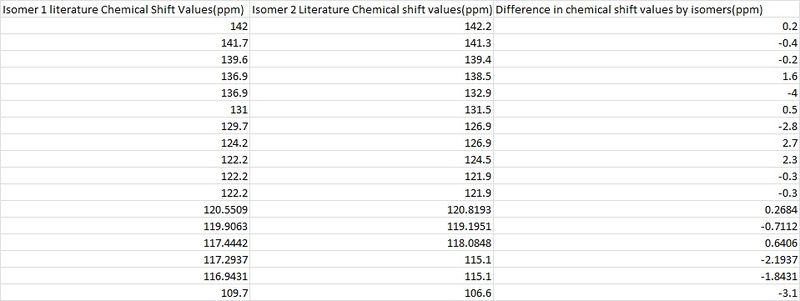
Looking at the table above it is clear to see that the literature isomer 13C NMR values shown in the table above hardly differ, once again confirming that assigning isomers based on this method could not have been achieved successfully.
1H NMR analysis
The 1H NMR spectra for each isomer was then computed using the same method as shown above for the 13C NMR and the files uploaded to D-space can be found in the above section.

Once again, it is key to note here that some assumptions have been made as the literature 1H NMR spectra[15] referenced a 8H multiplet as having a chemical shift range for isomer 2 between 7.52−7.36ppm whereas the computed values separate this into smaller peaks of 1H,1H,2H,2H,1H,1H and hence for interpretation purposes, the average of the literature value was taken in order to compare them against computed results. The same was found for isomer 1, where literature expresses a 6H multiplet with values of 7.52−7.40, whereas the computed values separated these into smaller peaks of 3H,1H and 2H and hence the average of this was once again taken. Degenerate hydrogen's were shown twice in the table below so that each proton could be compared to its literature value as best as possible.
The computed 1H NMR chemical shifts appeared correlate better with literature values than the 13C NMR chemical shift values, as they all fit well and there were no computational chemical shift values that were unable to be assigned. Each proton assigned in the table above is shown in the scheme below.
| Isomer 1 | Isomer 2 |
|---|---|
 |
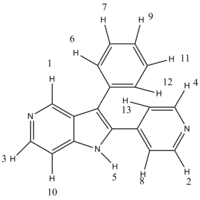 |
A bar chart was then produced, directly comparing each computed chemical shift value with its literature counterpart for both isomers and this can be seen below.
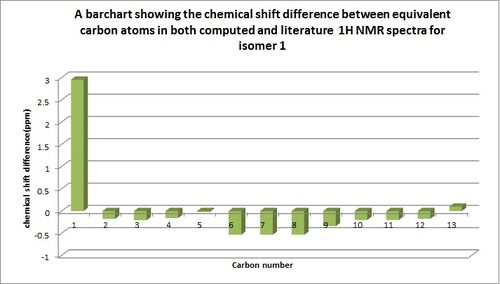
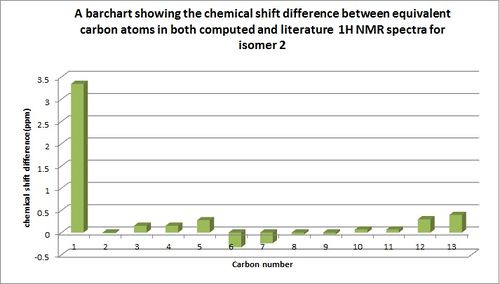
These show only a small disparity in chemical shift values between literature and computed values, showing that these have been assigned accurately as the chemical shift values do not appear to differ by more than 4ppm. Although computational 1H NMR spectra is useful for comparison purposes and prediction of the structure of molecule there are some limitations due to the fact that computed NMR data is unable to predict the multiplicity of peaks and hence describes every chemical shift value as having a singlet multiplicity.
Comparing the two molecules in order to distinguish between the two isomers once again leads to complications and once again I am unsure as to how the isomers were assigned when looking at the chemical shift values and structures. Firstly, looking at the structures of the two molecules and their proton environments, it was found that no hydrogen's could be used in order to accurately characterize the two isomers. The fact that1H NMR cannot be used to differentiate the isomers was then further confirmed by comparing the literature values for isomers 1 and 2 as shown in the table below.

The maximum difference here between the chemical shift values of a proton between isomers is 0.16ppm, a value so small that it is clear that M.Livecchi et al could not have successfully differentiated between isomers using 1H NMR.
Frequency and IR analysis
As the NMR values showed discrepenices between the the computational and literature values, a frequency analysis was run on the two isomers in order to ensure that the minimum energy structures were optimized using a B3LYP method and 6-31G(d,p) basis set. The frequency analysis confirmed that the final lowest energy conformation was determine rather than an intermediate,as the low frequencies for both isomers are in the correct range and the real frequencies are all positive. The optimization files were uploaded to D-space and the file for isomer 1 can be found here:DOI:10042/23270 and the file for isomer 2 can be found here:DOI:10042/23271 .
Isomer 1
Low frequencies ---    0.0006    0.0010    0.0010    1.9592    3.7426    7.6109
 Low frequencies ---   44.5014   53.3642   60.1863
Isomer 2
Low frequencies ---   -4.7620   -1.9802   -0.0005    0.0004    0.0005    5.6420
 Low frequencies ---   42.4631   50.9196   60.0394
The free energy differences between the two isomers were then evaluated as shown in the table below.
| Isomer | Free energy(Hartee) | Free energy(kcal/mol) |
|---|---|---|
| Isomer 1 | -857.805917 | -538273.2 |
| Isomer 2 | -857.805109 | -538272.7 |
The free energy values can be described in terms of the equation:ΔG = ΔH - TΔS and therefore depends upon the enthalpy and entropy of the molecules. The free energies between the two isomers are very similar and this shows that they have similar stability and hence this further explains why the isomers are synthesized in a 50:50 ratio as one does not appear to be more stable than the other.
The IR spectra for both molecules was then computed to detect whether this method would be adequate in differentiating between the two isomers and the IR spectra are shown below.
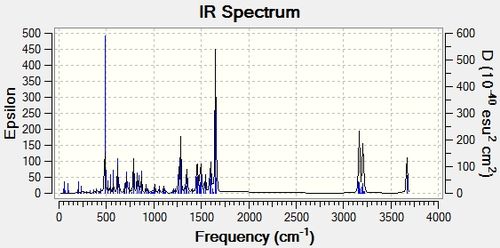
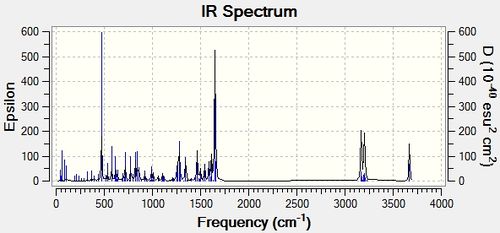
The literature values for both isomers are identical as shown in the table below which means that that this analytical tool could not have been used by M.Livecchi et al in order to differentiate between the two isomers. The computed values were the compared between isomers in order to determine whether this was still the case and the table below confirms that the computed IR frequencies are also very similar and hence, this technique is not adequate for distinguishing between the two molecules. The stretching frequencies for the computed and experimental values were then directly compared and the results are shown in the table below.
The above computed IR frequencies are not the only ones that were found, there were many others but it appears that these were not at a high enough intensity to be seen in the experimental IR spectrum. These frequencies are due to the large number of stretching and bending frequencies that are present as the molecule is large and contains a large number of aromatic rings. There is a good comparison between the computed and literature values apart from one experimental peak at 2964cm-1 and 2928cm-1 and as this is present in both experimental IR's it could have been an impurity peak.
Conclusions
In conclusion, it can clearly be seen that the three techniques discussed 1H NMR, 13C NMR and IR spectroscopy are not adequate techniques in distinguishing between the two isomers 2-phenyl-3-(pyridin-4-yl)-1H-pyrrolo[3,2-c]pyridine and 3-phenyl-2-(pyridin-4-yl)-1H-pyrrolo[3,2-c]pyridine. This is due to the fact that each technique yielded almost identical results for each isomer and hence there were no distinguishable analytical features which could be used to describe them individually. Therefore, it is clear that the identification of these isomers carried out by M.Livecchi et al cannot have been by these methods and thus the other methods of identification used by this literature paper were looked at. These included melting point and Rf values although this techniques are not good as primary identification methods as they are only useful as methods of distinction between the two isomers if the values have been previously reported. Hence, I am unsure as to how they distinguished between the two isomers but I would suggest that a method would be xray crystallography.
These conclusions highlight the importance of computational chemistry, as both a prediction tool and also an aid in understanding experimental techniques and methods carried out, as they allowed the confirmation that these isomers could not be differentiated between and also enabled the experimental values to be probed to see whether or not they had been accurately assigned.
References
- ↑ "Scandium-Catalyzed Copolymerization of Ethylene with Dicyclopentadiene and Terpolymerization of Ethylene, Dicyclopentadiene, and Styrene" Li, Xiaofang; Hou, Zhaomin Macromolecules(2005) pp 6767–6769
- ↑ An Unexpected Bispericyclic Transition Structure Leading to 4+2 and 2+4 Cycloadducts in the Endo Dimerization of Cyclopentadiene P Caramella,P Quadrelli and L Toma J. American. Chem. Soc. (2001) p.1130-1131
- ↑ Organic Chemistry J. Clayden, N. Greeves, S. Warren and P. Wothers Oxford University Press(2001) p916-917
- ↑ The first thermally-induced retro-oxy-cope rearrangement S.W.Elmore and L. Paquette Tetrahedron letters(1991) p319
- ↑ Toward Consistent Terminology for Cyclohexane Conformers in Introductory Organic ChemistryD J. Nelson, C N. Brammer j.chem.ed (2011) vol. 88 p.292-294
- ↑ 6.0 6.1 3.31 Sigmatropy within 1 -Vinyl-2-alkenyl-7,7-dimethyl-exo-norbornan-2-01~. The First Atropselective Oxyanionic Cope rearrangement L.Paquette, N.A.Pegg,D.Toops,G.D.Maynard and R.D.Rogers J. Am. Chem. Soc.(1990) vol.112, p227-283
- ↑ Cambridgesoft(2013) Predicting bond angles via Energy minimization[online] Available from http://chembionews.cambridgesoft.com/Articles/articlesPrinterVersion.aspx?featureclipID=140[Accessed 2nd February 2013]
- ↑ Evaluation and Prediction of the Stability of Bridgehead olefins W.F. Maier, P. Von Rague Schleyer, J. Am. Chem. Soc.(1981) vol.103 p1891
- ↑ A molecular orbital and cyrstallographic study of the structure and π-facial regioselectivity of 9-chloro-1,4,5,8-tetrahydro-4a,8a-methanonaphthalene B. Halton, R,Bosese and H.S. Rzepa, J. Chem. Soc(1992) p447-451
- ↑ Organic reaction mechanisms R K Bansal 3rd ed.(1998) Tata McGraw-Hill publishing Company Ltd p.424
- ↑ DFT studies of the role of C-2–O-2 bond rotation in neighboring-group glycosylation reactions D.M.Whitfield, T.Nukada In. Biological sciences(2007) vol.343, p1291-1304
- ↑ leming, Ian (2010) Molecular Orbitals and Organic Chemical Reactions: Reference Edition I.Leming, John Wiley and Sons(2010), p214–215
- ↑ M.Lefoix, G.Coudert, S.Routier,B.Pfeier, D.H Caignard,J.Hickman, A.Pierre, R.M.Golsteyn, S.Le ́ once, C.Bossard, J.Y.Merour, ́ Bioorg. Med. Chem.(2008) vol.16 p5303
- ↑ T.Wang, Z.Yin, Z.Zhang, J.A.Bender, Z.Yang, G.Johnson, Z.Yang,L.M.Zadjura, C.J.D’Arienzo, D.D.Parker, C.Gesenberg, G.A.Yamanaka,Y.Gong,H.Fang,N.Zhou, B.V.McAuliffe, B.J.Eggers, L.Fan,B.Nowicka-Sans, DI.B.Bicker,Q.Gao, R.J.Colonno,P.Lin,.A.Meanwell,J.F.Adow, J. Med. Chem.(2009) vol52, p7778
- ↑ 15.0 15.1 15.2 Palladium-Catalyzed Synthesis of 2,3-Disubstituted 5-Azaindoles via Heteroannulation Reaction and of 2-Substituted 5-Azaindoles through Domino Sila-Sonogashira/5-Endo Cyclization M.Livecchi,G.Calvet,F.Schmidt, J.Org.Chem(2012) vol.77, p5006-5016

