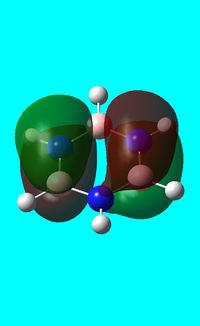
JadeDamon
Introduction
Over the course of this project GaussView was used in order to carry out optimisation, frequency, MO analysis and natural bond orbital analysis of a range of molecules including BH3, BBr3, TlBr3,NH3 and NH3BH3, under a range of different methods and basis sets. It was also used in order to create input log files for HPC scans.
Gaussian modelling can be used in order to optimize a molecule and thereby collect thermodynamic information and kinetic data. During the optimisation of a molecule, if we assume that the nuclei have a given position, then we can solve the Schrodinger equation and therefore determine the electron density and energy of the nuclei in that position, known as the SCF part of the Schrodinger equation. In Gaussian, this is achieved by carrying out the optimisation of a molecule via one method, which then gives us the optimum position for the nuclei at that specific electronic configuration. From this, we can then determine the equation for the particular position of the nuclei at each point and this can be achieved by moving the nuclei between different SCF's until the lowest energy geometry is found, which is known as the optimised geometry.
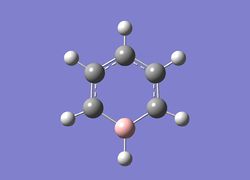
The aromaticity of benzene, boratabenzene, pyridinium and borazine was then investigated and the natural charge distributions and molecular orbitals were compared and contrasted. This allowed the effect of adding electropositive and electronegative atoms to benzene to be probed and the difference in molecular orbital energy to be explained.
Finally, the importance of modern molecular modelling technology was shown in terms of accuracy and significance. It allows us to visualize and model real molecules successfully, aiding our understanding of experimental data and results.
BH3
Optimisation of BH3
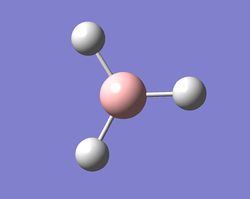
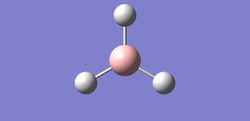
The first molecule to be investigated was BH3 and the molecule was created on gaussView with a fixed boron atom and B-H bond lengths of 1.5Å.
The first optimisation carried out used a B3LYP method with a 3-21G basis set and the optimisation .log data for BH3 can be found Here. The method used describes the type of equations and approximations used in order to solve the Schrodinger equation. The basis set shows the level of accuracy of the calculation. This particular basis set, 3-21G, has a low accuracy, although this does mean that the speed of the calculations are faster than those with a higher accuracy.
The table below summaries the key information gained from the optimisation of the molecule and the molecules key physical data.
The gradient shows that the molecule has been optimised, due to the fact that the value tends towards zero. The B-H bond length also shows that the molecule has been optimsied, due to the fact that it differs from the non-optimised value of 1.5Å. Comparing the optimised bond with the literature value of 1.19Å[1] shows that the molecule has been optimised well as it matches experimental data.
Another way of ensuring that the optimisation has been carried out correctly and to completion is by looking at the final set of force and displacements in the .log data. This data tells us that the forces are converged, where the force is the gradient of an energy v.s distance plot. The converging of a displacement means that the energy does not change for a small displacement and the values shown in the data state that the displacements have also converged. An easy way to see this is by ensuring that the 'Value' is less than the 'Threshold' for each force or displacement.
 Item               Value     Threshold  Converged?
 Maximum Force            0.000413     0.000450     YES
 RMS     Force            0.000271     0.000300     YES
 Maximum Displacement     0.001610     0.001800     YES
 RMS     Displacement     0.001054     0.001200     YES
 Predicted change in Energy=-1.071764D-06
 Optimization completed.
    -- Stationary point found.
                           ----------------------------
                           !   Optimized Parameters   !
                           ! (Angstroms and Degrees)  !
 --------------------------                            --------------------------
 ! Name  Definition              Value          Derivative Info.                !
 --------------------------------------------------------------------------------
 ! R1    R(1,2)                  1.1935         -DE/DX =    0.0004              !
 ! R2    R(1,3)                  1.1935         -DE/DX =    0.0004              !
 ! R3    R(1,4)                  1.1935         -DE/DX =    0.0004              !
 ! A1    A(2,1,3)              120.0            -DE/DX =    0.0                 !
 ! A2    A(2,1,4)              120.0            -DE/DX =    0.0                 !
 ! A3    A(3,1,4)              120.0            -DE/DX =    0.0                 !
 ! D1    D(2,1,4,3)            180.0            -DE/DX =    0.0                 !
 --------------------------------------------------------------------------------
Optimisation plots of BH3
During an optimisation, we find an energy for a fixed nuclei by solving the Schrodinger equation for the electrons, with the assumption that the Born-Oppenheimer approximation is enforced. These individual nuclear positions can then be collectively represented by an energy E(R), with the R being the collective co-ordinates for the nuclear positions. This means that if one of the nuclei were moved slightly then the energy would change, due to the fact that the interactions would no longer be the same.
Optimising a molecule uses concepts similar to the Morse potential curve for a diatomic molecule, due to the fact that there is a repulsive interaction between nuclei when they are close together and as the distance between them (R) decreases the energy increases, showing that the energy(E) is R dependent. As the atoms move further away from each other they reach a stable point, which is usually the equilibrium point and this is where the potential energy is lowest. At this point, the nuclei and electrons are able to arrange themselves such that the system is in equilibrium and there are no net forces on the molecule. Hence, optimising a molecule involves finding this stable configuration of electrons and nuclei and therefore the most stable point. This is achieved by comparing the energies found by each Schrodinger calculation. As each optimisation is carried out and each Schrodinger equation solved, the energy of the new equation is checked and if lower than the previous, the program 'moves' in that direction until the stable point is found. This could also be described as the program traversing a PES.
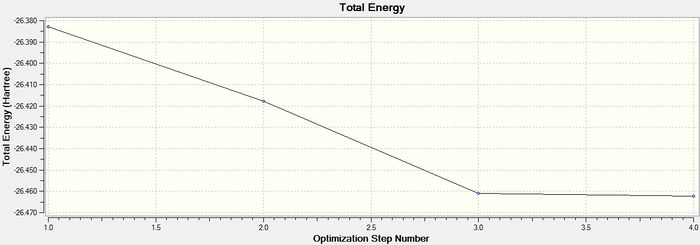
The graph below is the total energy curve of the BH3 molecule and this shows the program traversing in order to find the lowest energy structure of the molecule. This means that each point of the graph describes the energy of the molecule at each step of the optimisation.
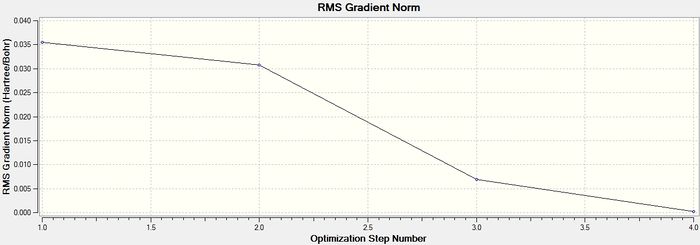
The graph below shows the RMS gradient, which gives the gradient of the energy of the molecule at each step of the optimisation. A gradient is defined as a change in the value of one quantity(x) with respect to the change in a given variable(y) giving the form dx/dy. When two atoms in a molecule are at their equilibrium bond distance, they are at a potential energy minimum. This means that they are in the potential energy well on a PES. As the equation F= -dE/dr (where F is force, E is energy and r is internuclear distance) shows, the gradient is actually the force between atoms and at equilibrium, the force between atoms is zero and hence the gradient is zero for a minimum energy structure. This is why the molecule is fully optimised when the gradient tends towards zero as shown in the previous summary table.
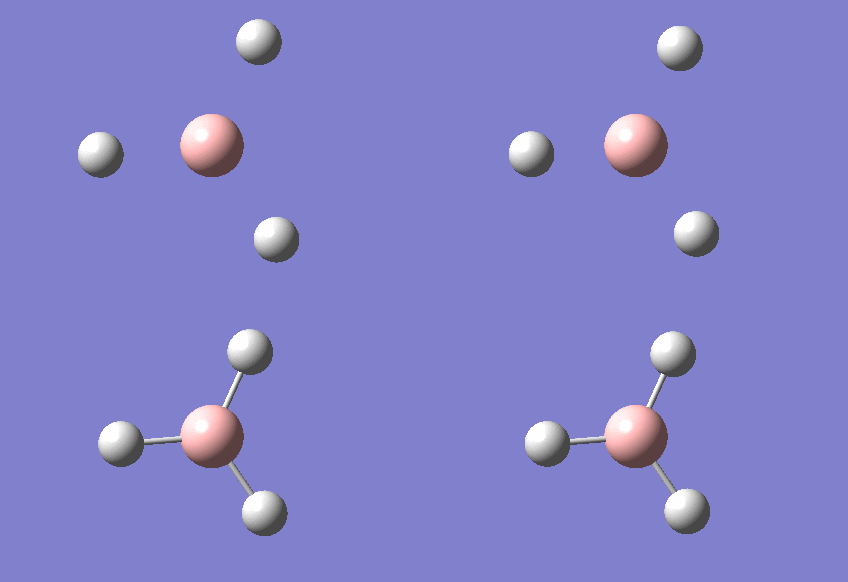
The position of the nuclei in the molecule at each step of the optimisation can be seen in the animation. From the animation, it can be seen that the first conformation of the molecule appears to have no bonds where as the second and third comformations do, which is shown by the fact that the atoms are not always connected by bonds in the computation.
A chemical bond is an electrostatic interaction between atoms. In more detail for this molecule, the bonds are covalent which means that the bonds are formed via a sharing of electrons in the electron cloud overlap between atoms. The reason that the bonds cannot be seen in this first comformation is due to the fact that Gaussian shows bonds based on a per-determined distance criteria and hence in the first comformation the distance between the atoms has exceeded the pre-defined distance value. This does not, however, mean that there is no bond between the atoms, as there may still be interactions between these atoms in the molecule, just ones that cannot be shown by Gaussian.
The last structure refers to the lowest energy point on the optimisation plots and hence this has the smallest gradient and a negative energy.
Optimisation of BH3 using a 6-31G basis set
Another optimisation of BH3 was carried out this time with a basis set of 6-31G. The optimisation .log data for BH3 can be found here.
The table below summaries the key information gained from the optimisation of the molecule and the molecules key physical data.
The gradient once again tends towards zero which confirms that the molecule has been optimised. The final set of force and displacements are all converged in the .log data shown below verifying that the optimisation has occurred to completion. All of the 'values' are also less than the 'threshold'.
 Item               Value     Threshold  Converged?
 Maximum Force            0.000433     0.000450     YES
 RMS     Force            0.000284     0.000300     YES
 Maximum Displacement     0.001702     0.001800     YES
 RMS     Displacement     0.001114     0.001200     YES
 Predicted change in Energy=-1.189019D-06
 Optimization completed.
    -- Stationary point found.
                           ----------------------------
                           !   Optimized Parameters   !
                           ! (Angstroms and Degrees)  !
 --------------------------                            --------------------------
 ! Name  Definition              Value          Derivative Info.                !
 --------------------------------------------------------------------------------
 ! R1    R(1,2)                  1.1914         -DE/DX =    0.0004              !
 ! R2    R(1,3)                  1.1914         -DE/DX =    0.0004              !
 ! R3    R(1,4)                  1.1914         -DE/DX =    0.0004              !
 ! A1    A(2,1,3)              120.0            -DE/DX =    0.0                 !
 ! A2    A(2,1,4)              120.0            -DE/DX =    0.0                 !
 ! A3    A(3,1,4)              120.0            -DE/DX =    0.0                 !
 ! D1    D(2,1,4,3)            180.0            -DE/DX =    0.0                 !
 --------------------------------------------------------------------------------
TIBr3
Optimisation of TlBr3
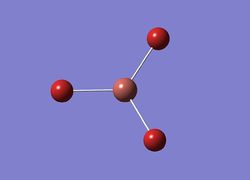
The next molecule which was optimised was TlBr3 which is a much heavier molecule than BH3 due to the fact that thallium has 81 electrons and bromine has 35 electrons. Both of these elements show effects which cannot be recovered by the usual Schrodinger equation basis set. Therefore, a LanL2Dz basis set was used. This medium level basis set uses pseudo potentials in order to take into account the heavier elements used in this optimisation. This time, the optimisation was carried out using a high-performance computing facility (HPC) and the file uploaded to D-space can be found here: DOI:10042/22451 . For this particular optimisation the symmetry was restricted to D3H and the tolerance increased to very tight (0.0001) and this is done in order to avoid false minima.
The table below summaries the key information gained from the optimisation of the molecule and the molecules key physical data.
Comparing the experimental bond distance with the literature value of 2.51Å [2] shows that the lengths are similar and hence the molecule optimised by Gaussian is accurate.
The item data below shows that the molecule was optimised as all of the force and displacement constants have converged.
      Item               Value     Threshold  Converged?
 Maximum Force            0.000413     0.000450     YES
 RMS     Force            0.000271     0.000300     YES
 Maximum Displacement     0.001610     0.001800     YES
 RMS     Displacement     0.001054     0.001200     YES
 Predicted change in Energy=-1.071764D-06
 Optimization completed.
    -- Stationary point found.
                           ----------------------------
                           !   Optimized Parameters   !
                           ! (Angstroms and Degrees)  !
 --------------------------                            --------------------------
 ! Name  Definition              Value          Derivative Info.                !
 --------------------------------------------------------------------------------
 ! R1    R(1,2)                  1.1935         -DE/DX =    0.0004              !
 ! R2    R(1,3)                  1.1935         -DE/DX =    0.0004              !
 ! R3    R(1,4)                  1.1935         -DE/DX =    0.0004              !
 ! A1    A(2,1,3)              120.0            -DE/DX =    0.0                 !
 ! A2    A(2,1,4)              120.0            -DE/DX =    0.0                 !
 ! A3    A(3,1,4)              120.0            -DE/DX =    0.0                 !
 ! D1    D(2,1,4,3)            180.0            -DE/DX =    0.0                 !
 --------------------------------------------------------------------------------
BBr3
Optimisation of BBr3
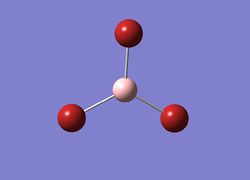
Next, BBr3 was optimised using a GEN basis set with the additional key words "pseudo= read gfinput". This is an interesting molecule due to the fact that it contains both heavy atoms, requiring a pseudo-potential and a light atom which is treated more accurately using a full basis set. Hence a mixture of pseudo-potentials and basis sets were required for this optmisation. The .log data for the optimised BBr3 molecule can be found here.
The table below summaries the key information gained from the optimisation of the molecule and the molecules key physical data.
Comparing the B-Br bond length of 1.93 Å with the literature value of 1.893Å [3] shows that the lengths are very similar and hence the molecule optimised by Gaussian is accurate.
The item data below shows that the molecule was optimised as all of the force and displacement constants have converged.
      Item               Value     Threshold  Converged?
 Maximum Force            0.000008     0.000450     YES
 RMS     Force            0.000005     0.000300     YES
 Maximum Displacement     0.000036     0.001800     YES
 RMS     Displacement     0.000023     0.001200     YES
 Predicted change in Energy=-4.026780D-10
 Optimization completed.
    -- Stationary point found.
                           ----------------------------
                           !   Optimized Parameters   !
                           ! (Angstroms and Degrees)  !
 --------------------------                            --------------------------
 ! Name  Definition              Value          Derivative Info.                !
 --------------------------------------------------------------------------------
 ! R1    R(1,2)                  1.934          -DE/DX =    0.0                 !
 ! R2    R(1,3)                  1.934          -DE/DX =    0.0                 !
 ! R3    R(1,4)                  1.934          -DE/DX =    0.0                 !
 ! A1    A(2,1,3)              120.0            -DE/DX =    0.0                 !
 ! A2    A(2,1,4)              120.0            -DE/DX =    0.0                 !
 ! A3    A(3,1,4)              120.0            -DE/DX =    0.0                 !
 ! D1    D(2,1,4,3)            180.0            -DE/DX =    0.0                 !
 --------------------------------------------------------------------------------
Comparing the bond distances of BH3,BBr3 and TlBr3
The table below summarises the bond distances between the optimised BH3,BBr3 and TlBr3.
| BH3 | 1.19Å |
| BBr3 | 1.93Å |
| TIBr3 | 2.65Ǎ |
From this table it can be seen that the longest bond distance in an optimised molecule is the Tl-Br bond distance. The table also shows that the molecule with the heaviest central atom(Tl) has a much larger bond distance for B containing molecule and also that the lightest ligand H, leads to the smallest bond distance. Therefore the lightest ligand and the lightest central atom combined lead to the shortest bond distance.
The individual atoms and ligands can be studied in more detail by looking at their electron configurations as seen in the table below.
| H | 1s1 |
| B | 1s22s22p1 |
| Br | [Ar]4s23d104p5 |
| Tl | [Xe]6s25d106p1 |
Directly comparing BH3 and BBr3 shows that the only difference between them is the ligand H or Br and this alone leads to the large difference in bond distance. Hydrogen and bromine have a large size difference, as shown by their electron configurations, where bromine has a much larger electron configuration than hydrogen. Bromine has much more diffuse orbitals than hydrogen and bromine also shares an electron from its 4p orbital, where as hydrogen shares an electron from its 1s orbital. Bromine having more diffuse orbitals than hydrogen leads to weaker orbital overlap and hence a poorer electron interaction with the electrons in the 2p boron orbital, leading to a longer bond being formed.
The Pauling electronegativities of each ligand can also be compared with the value of hydrogen being 2.20 and bromine 2.96. Evaluating these with respect to the boron electronegativity value of 2.04, shows that a bromine-boron bond is more polar than a boron-hydrogen bond due to the greater difference in electronegativity between the two atoms. Taking this into account the BH3 molecule has covalent bonds with little ionic character, where as the BBr3 molecule has covalent bonds which much greater ionic character as the electrons are drawn towards the bromine in the bond.
Comparing TlBr3 and BBr3 shows that the only difference this time is the central atom. Thallium is a much larger atom than boron, as shown by their electron configurations. This difference in size results in more diffuse orbitals in thallium and hence a poorer orbital overlap between the 6p electrons of thallium with the 4p electrons of bromine, than the overlap of the 2p orbitals of boron with bromine. This poor orbital overlap leads to a longer bond. As well as orbital overlap, thallium will also have greater shielding of its nuclear charge by the electrons due to its increased size compared to boron.
Frequency analysis of BH3
Next the frequency analysis was run for BH3 with a constrained symmetry of D3H and the .log data file can be found here. A frequency analysis is carried out in order to confirm that the optimisations carried out by Gaussian have produced the lowest energy or minimum structures of the molecules.
A table summarising the key data for the frequency analysis is shown below.
The item data below shows that the molecule was optimised as all of the force and displacement constants have converged.
Item               Value     Threshold  Converged?
 Maximum Force            0.000003     0.000450     YES
 RMS     Force            0.000002     0.000300     YES
 Maximum Displacement     0.000013     0.001800     YES
 RMS     Displacement     0.000009     0.001200     YES
 Predicted change in Energy=-6.854715D-11
 Optimization completed.
    -- Stationary point found.
                           ----------------------------
                           !   Optimized Parameters   !
                           ! (Angstroms and Degrees)  !
 --------------------------                            --------------------------
 ! Name  Definition              Value          Derivative Info.                !
 --------------------------------------------------------------------------------
 ! R1    R(1,2)                  1.1923         -DE/DX =    0.0                 !
 ! R2    R(1,3)                  1.1923         -DE/DX =    0.0                 !
 ! R3    R(1,4)                  1.1923         -DE/DX =    0.0                 !
 ! A1    A(2,1,3)              120.0            -DE/DX =    0.0                 !
 ! A2    A(2,1,4)              120.0            -DE/DX =    0.0                 !
 ! A3    A(3,1,4)              120.0            -DE/DX =    0.0                 !
 ! D1    D(2,1,4,3)            180.0            -DE/DX =    0.0                 !
 --------------------------------------------------------------------------------
The low frequency values for this analysis are shown below.
Low frequencies ---   -6.9471   -6.9095   -0.0273   -0.0003    0.7219    6.7701
 Low frequencies --- 1163.0029 1213.1581 1213.1583
The first row shows the low frequency values and a valid range for these values is between -15cm-1 to 15cm-1. The low frequency values in real terms can be explained by looking at the fact that every molecule has 3N-6 vibrational modes. The low frequencies represent the -6 vibrational frequencies of this equation and hence the motions of the molecules center of mass. The bottom row represents the 'real' vibrational frequency values and are always positive.
Animating the vibrations of BH3
| No. | Animation | Frequency(cm-1) | Infared | Symmetry D3H point group | Type of Vibration | |||
| 1 |
|
1163 | 92.5653 | A2“ | 3H bending in and out of plane | |||
| 2 |
|
1213.16 | 14.0563 | E' | 3H in plane rocking | |||
| 3 |
|
1213.16 | 14.0558 | E' | 2H symmetric scissoring 1H stationary | |||
| 4 |
|
2582.48 | 0.000 | A1' | 3H symmetric stretching | |||
| 5 |
|
2715.61 | 126.3355 | E' | 2H asymmetric scissoring 1H stationary | |||
| 6 |
|
2715.61 | 126.3294 | E' | 3H asymmetric stretching |
A computed IR spectrum of BH3
The computed IR spectrum for this molecule is shown below.
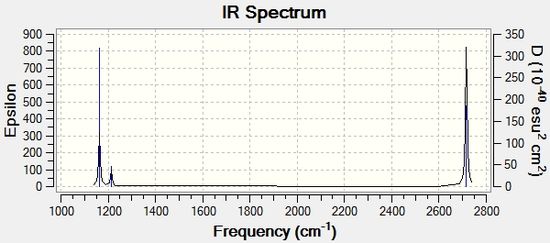
Looking at the IR spectrum it can be seen that although there are 6 vibrational modes, there are only 3 peaks. This is due to the fact that vibrations 2 and 3 and 5 and 6 have the same IR frequencies and hence have the same energies making them degenerate. The degeneracies mean that two of the peaks consist of two different vibrational modes each creating one overall peak. There is also a peak missing at 2582.42cm1, which should exist due to the 4th vibrational mode. The reason for its absence is due to the fact that in order for the vibrational mode to be IR active there needs to be a change in dipole moment and as this vibrational mode consists of a symmetrical stretch there is no overall dipole and hence no peak on the IR spectrum.
Frequency analysis of TIBr3
A frequency analysis was then carried out on a TIBr3 molecule using HPC and the file uploaded to D-space can be found here: DOI:10042/22454 .
A table summarising the key data for the frequency analysis is shown below.
The item data below shows that the molecule was optimised as all of the force and displacement constants have converged.
Item               Value     Threshold  Converged?
 Maximum Force            0.000033     0.000450     YES
 RMS     Force            0.000022     0.000300     YES
 Maximum Displacement     0.000294     0.001800     YES
 RMS     Displacement     0.000192     0.001200     YES
 Predicted change in Energy=-1.457277D-08
 Optimization completed.
    -- Stationary point found.
                           ----------------------------
                           !   Optimized Parameters   !
                           ! (Angstroms and Degrees)  !
 --------------------------                            --------------------------
 ! Name  Definition              Value          Derivative Info.                !
 --------------------------------------------------------------------------------
 ! R1    R(1,2)                  2.651          -DE/DX =    0.0                 !
 ! R2    R(1,3)                  2.651          -DE/DX =    0.0                 !
 ! R3    R(1,4)                  2.651          -DE/DX =    0.0                 !
 ! A1    A(2,1,3)              120.0            -DE/DX =    0.0                 !
 ! A2    A(2,1,4)              120.0            -DE/DX =    0.0                 !
 ! A3    A(3,1,4)              120.0            -DE/DX =    0.0                 !
 ! D1    D(2,1,4,3)            180.0            -DE/DX =    0.0                 !
 --------------------------------------------------------------------------------
The low frequencies values for this analysis are shown below and this data confirms that the optimsied structure of TIBr3 is a minimum due to the fact that the 'real' frequencies are positive and the low frequencies are in the correct range.
Low frequencies ---   -0.0020   -0.0007    0.0000    1.1400    2.2030    2.2030
 Low frequencies ---   46.6768   46.6769   51.9152
Animating the frequencies of TIBr3
| No. | Animation | Infared | Frequency of TIBr3 (cm-1) | Symmetry D3H point group | Type of Vibration | |||
| 1 |
|
3.6828 | 46.68 | E' | 2Br in plane symmetric scissoring with 1Br stationary | |||
| 2 |
|
3.6827 | 46.68 | E' | 3Br in plane rocking | |||
| 3 |
|
5.8465 | 51.92 | A2“ | 3Br bending in and out of plane | |||
| 4 |
|
0 | 165.35 | A1 | 3Br symmetric stretching | |||
| 5 |
|
25.4828 | 210.84 | E' | 3Br asymmetric stretching | |||
| 6 |
|
25.4829 | 210.84 | E' | 2Br asymmetric scissory 1Br stationary |
A computed IR spectrum of TIBr3
The computed IR spectrum for this molecule is also shown below.
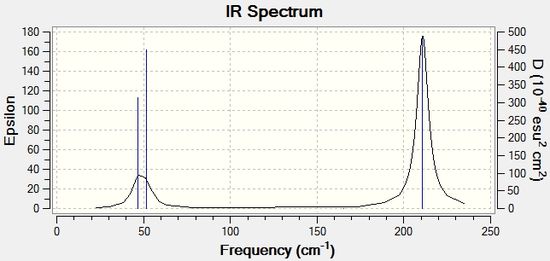
Once again the computed IR spectrum has 3 observed IR peaks and 6 vibrational modes and this is due to the fact that modes 1 and 2 and 5 and 6 have the same IR frequency values and hence have degenerate energies producing two peaks instead of 4. There is also one peak missing due to the symmetrical stretch seen in mode 4 and hence there are 3 peaks observed. The lowest real normal mode is 46.68cm-1.
Comparing the frequencies of TIBr3 and BH3
| Number | Frequency of TIBr3(cm-1) | Frequency of BH3(cm-1) |
|---|---|---|
| 1 | 46.68 | 1163 |
| 2 | 46.68 | 1213.16 |
| 3 | 51.92 | 1213.16 |
| 4 | 165.35 | 2582.48 |
| 5 | 210.84 | 2715.61 |
| 6 | 210.84 | 2715.61 |
There is a large difference in the value of the vibrational frequencies between the two molecules. The fact that the BH3 frequencies are larger than the TIBr3 frequencies suggest that the B-H bonds are stronger than the TI-Br bonds and hence are also shorter bonds.
Looking at Hooke's law it can be seen that the vibrational frequency is inversely proportional to reduced mass. This means that the larger the atoms in the bond the lower the bonds vibrational frequency. The result of this law can be seen clearly with the computed results, due to the fact that the TI and Br atoms are much larger than the H and B atoms and hence this results in the vibrational frequencies being much lower.
Looking at the IR spectra for both molecules, both display three peaks due to two different degeneracies and one symmetrical stretching mode. Both molecules also have the A2’ and E' modes close together and A1' and E' modes together, but with a large frequency gap between them. This is due to the fact that the first three modes are bending frequencies which have a much lower frequency than stretching frequencies, which are the last three modes. However, the ordering of modes in the two molecules differs with TlBr3 having a vibrational mode order of E',E', A2’, A1' E', E' and BH3 having a vibrational mode order of A2’, E', E', A1', E', E. The degenerate E' frequencies are higher in TlBr3 than BH3 and a reason for this could be due to the difference in mass between the two ligands, H and Br. The heavier Br ligand requires more energy to rock from side to side and also to undergo a scissoring motion and hence the E' modes are higher in frequency for this molecule.
In order to ensure accurate results for both the optimisation and frequency analysis calculations, the method and basis set used for each calculation must be the same. This is due to the fact that the total energy of each molecule is dependent on the type of basis set used and hence the energy of the molecules optimised using different basis sets cannot be compared. The theory behind this can be explained because different basis sets start opimisations from different points on a PES which can lead to the energy not converging at the lowest point.
Population analysis of BH3
Next a population analysis was carried out on BH3 producing its computed MOs using Energy and a 6-31G basis set. The file in D-space can be found here DOI:10042/22459 .
The table below summaries the population analysis data for the BH3 molecule.
MO diagram of BH3
The computed MO's were then used to create an MO diagram of BH3 using the LCAO method with each LCAO being drawn. The symmetries of the orbitals was obtained from the frequency analysis data as shown below.
1         (A1')--O         -6.771122         10.797475
   2         (A1')--O         -0.512674          0.905366
   3         (E')--O          -0.350883          0.728735
   4         (E')--O          -0.350883          0.728735
   5         (A2")--V         -0.066018          0.640307
   6         (A1')--V          0.168777          0.934518
   7         (E')--V           0.179500          0.644102
   8         (E')--V           0.179500          0.644102
There is only a small electronegativity difference between the hydrogen and boron atoms which means that there isn't a large difference in the energy of the atomic orbitals as shown by the diagram below. There is a non bonding orbital due to the pz orbital having 1a2“ symmetry, a symmetry which is not present in the hydrogen s orbitals.

From the MO diagram it can be seen that the HOMO's are the two 1e' orbitals with the LUMO being the non-bonding a2“ orbital.
The MO diagram with the LCAO MO's next to the computed or 'real' MO's can be used to show that there is not much difference between them. This shows that qualitative MO theory is accurate and useful as a method for describing the real molecular orbitals of molecules.
NH3
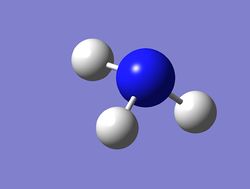
Optimisation of NH3
Next a molecule of NH3 was optimised using a 6-31G basis set. The .log data for this optimisation can be found here.
The table below summaries the key information gained from the optimisation of the molecule and the molecules key physical data.
Comparing the computed bond length with the literature value of 1.01Å [4] shows that there is a high level of accuracy in the Gaussian optimisation.
The item data below shows that the molecule was optimised as all of the force and displacement constants have converged.
Item               Value     Threshold  Converged?
 Maximum Force            0.000024     0.000450     YES
 RMS     Force            0.000012     0.000300     YES
 Maximum Displacement     0.000088     0.001800     YES
 RMS     Displacement     0.000056     0.001200     YES
 Predicted change in Energy=-1.776567D-09
 Optimization completed.
    -- Stationary point found.
                           ----------------------------
                           !   Optimized Parameters   !
                           ! (Angstroms and Degrees)  !
 --------------------------                            --------------------------
 ! Name  Definition              Value          Derivative Info.                !
 --------------------------------------------------------------------------------
 ! R1    R(1,2)                  1.018          -DE/DX =    0.0                 !
 ! R2    R(1,3)                  1.018          -DE/DX =    0.0                 !
 ! R3    R(1,4)                  1.018          -DE/DX =    0.0                 !
 ! A1    A(2,1,3)              105.7414         -DE/DX =    0.0                 !
 ! A2    A(2,1,4)              105.7479         -DE/DX =    0.0                 !
 ! A3    A(3,1,4)              105.7486         -DE/DX =    0.0                 !
 ! D1    D(2,1,4,3)            111.8631         -DE/DX =    0.0                 !
 --------------------------------------------------------------------------------
Frequency analysis of NH3
Next a frequency analysis was run on the molecule and the .log data file can be found here.
A table summarising the key data for the frequency analysis is shown below.
The item data below shows that the molecule was optimised as all of the force and displacement constants have converged.
Item               Value     Threshold  Converged?
 Maximum Force            0.000022     0.000450     YES
 RMS     Force            0.000011     0.000300     YES
 Maximum Displacement     0.000086     0.001800     YES
 RMS     Displacement     0.000055     0.001200     YES
 Predicted change in Energy=-1.604179D-09
 Optimization completed.
    -- Stationary point found.
                           ----------------------------
                           !   Optimized Parameters   !
                           ! (Angstroms and Degrees)  !
 --------------------------                            --------------------------
 ! Name  Definition              Value          Derivative Info.                !
 --------------------------------------------------------------------------------
 ! R1    R(1,2)                  1.018          -DE/DX =    0.0                 !
 ! R2    R(1,3)                  1.018          -DE/DX =    0.0                 !
 ! R3    R(1,4)                  1.018          -DE/DX =    0.0                 !
 ! A1    A(2,1,3)              105.7414         -DE/DX =    0.0                 !
 ! A2    A(2,1,4)              105.7479         -DE/DX =    0.0                 !
 ! A3    A(3,1,4)              105.7486         -DE/DX =    0.0                 !
 ! D1    D(2,1,4,3)            111.8631         -DE/DX =    0.0                 !
 --------------------------------------------------------------------------------
The low frequency values for this analysis are shown below and they show that the minimum structure was reached.
The low frequency values are also correct due to the fact that the low frequencies are in the correct range and all of the 'real' frequencies are positive.
Low frequencies ---   -8.6537   -0.0015   -0.0010    0.0012    9.6360   13.8430
Low frequencies --- 1089.3139 1693.9223 1693.9487
Animating the frequencies of NH3
| No. | Animation | Frequency(cm-1) | Infared | Symmetry C1 point group | Type of Vibration | |||
| 1 |
|
1089.31 | 145.4451 | E' | 3H bending in and out of plane | |||
| 2 |
|
1693.92 | 13.5607 | E' | 2H scissoring 1H rocking | |||
| 3 |
|
1693.95 | 13.5562 | A2“ | 2H scissoring 1H rocking | |||
| 4 |
|
3461.28 | 1.0589 | A1' | 3H symmetrical stretching | |||
| 5 |
|
3589.76 | 0.2690 | E' | 3H asymmetrical stretching | |||
| 6 |
|
3589.92 | 0.2700 | E' | 3H asymmetric stretching |
Computed IR of NH3 from the frequency analysis
The computed IR spectrum for NH3 is shown below.
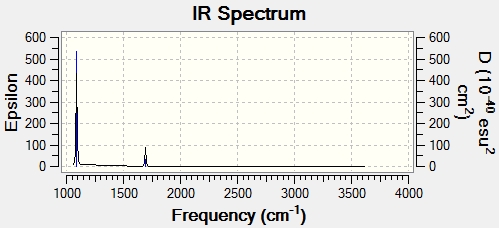
There are 2 peaks in the computed IR spectrum even though there are 6 vibrational modes for the molecule. This is due to the fact that modes 5 and 6 only have a small change in dipole moment and hence aren't IR active. Modes 2 and 3 have the same vibrational frequencies and therefore degenerate energies producing only one peak between them. The largest peak on the IR spectrum corresponds to vibrational mode 1 due to the fact that this has the largest change in dipole moment.
Population analysis of NH3
A population analysis was then carried out on NH3 where the file uploaded to D-space can be found here: DOI:10042/22481 .
The table below summaries the population analysis data for the NH3 molecule.
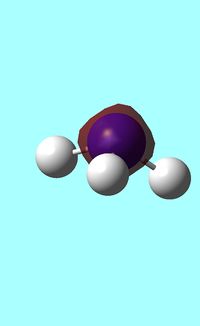
The computed occupied MO orbitals of NH3 are shown below from smallest to largest energy.
 1a1 1a1 |
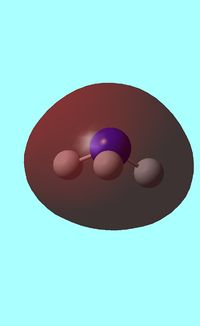 2a1 2a1 |
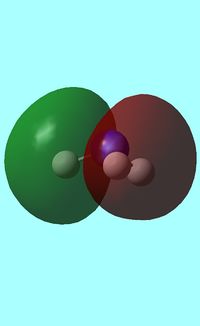 e e |
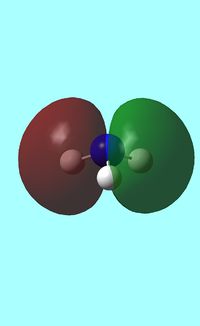 e e
|
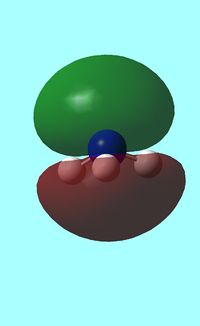 a1 a1 |
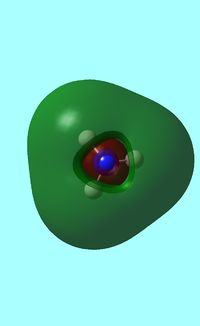 a1 a1 |
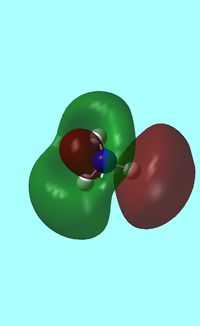 e e |
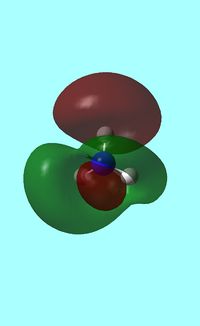 e e
|
Natural orbital analysis of NH3
Next the energy .log file was used in order to carry out a natural orbital analysis of NH3. The charge distrbution was calculated and the colour range was from -1.00 to 1.00 . An image of the molecules charge distribution is shown below with the green representing a region of positive charge and the red representing a region of negative charge.
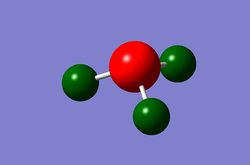
Then the specifc NBO charges were observed for the molecule with the natural charge numbers being 0.375 and -1.125 for H and N respectively as shown below.
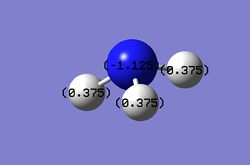
Another way that the natural charge numbers can be found can be found is in the NBO data as shown below.
Summary of Natural Population Analysis:

                                       Natural Population
                Natural  -----------------------------------------------
    Atom  No    Charge         Core      Valence    Rydberg      Total
 -----------------------------------------------------------------------
      N    1   -1.12515      1.99982     6.11104    0.01429     8.12515
      H    2    0.37505      0.00000     0.62250    0.00246     0.62495
      H    3    0.37505      0.00000     0.62250    0.00246     0.62495
      H    4    0.37505      0.00000     0.62249    0.00246     0.62495
 =======================================================================
   * Total *    0.00000      1.99982     7.97852    0.02166    10.00000
The table below summaries the bond coefficients and orbital hybridizations for the molecule. The coefficient section of the table explains the percentage orbital contribution of each atom towards the total bond. The hybridization section describes the percentage orbital type contribution to each bond.
| Bond | Coefficient | Hybridization |
|---|---|---|
| N-H | N(68.83%)H(31.17%) | N[s( 24.86%) p(75.05%) d(0.09%)] H[s( 99.91%) p(0.09%)] |
Hence, from the table it can be seen that 68.3% of the N-H bond comes from N orbital contribution and from those orbitals 24.86% are s orbitals, 75.05% are p orbitals and 0.09% are d orbitals. This means that the nitrogen is sp3 hybridized due to the fact that the ratio of p:s is essentially 3:1. The hybridization of the hydrogen contribution can be treated as 100% s orbital.
NH3 BH3
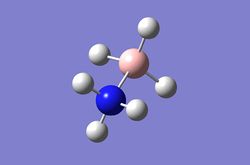
Optimisation of NH3BH3
NH3BH3 is an interesting molecule to investigate due to the fact that it's an acid-base complex. An optimisation of NH3BH3 was carried out using a 6-31G basis set. The .log file can be found here.
The table below summaries the key information gained from the optimisation of the molecule and the molecules key physical data.
The item data below shows that the molecule was optimised as all of the force and displacement constants have converged.
Item               Value     Threshold  Converged?
 Maximum Force            0.000132     0.000450     YES
 RMS     Force            0.000037     0.000300     YES
 Maximum Displacement     0.001189     0.001800     YES
 RMS     Displacement     0.000531     0.001200     YES
 Predicted change in Energy=-1.176328D-07
 Optimization completed.
    -- Stationary point found.
Frequency analysis of NH3 BH3
Next a frequency analysis was carried out on the molecule and the file uploaded to D-space can be found here: DOI:10042/22482 .
A table summarising the key data for the frequency analysis is shown below.
The item data below shows that the molecule was optimised as all of the force and displacement constants have converged.
Item               Value     Threshold  Converged?
 Maximum Force            0.000139     0.000450     YES
 RMS     Force            0.000038     0.000300     YES
 Maximum Displacement     0.000763     0.001800     YES
 RMS     Displacement     0.000277     0.001200     YES
 Predicted change in Energy=-1.179410D-07
 Optimization completed.
    -- Stationary point found.
The low frequency values shown below confirm that the minimum structure was found due to the fact there the low frequency values are in the correct range and the 'real' frequencies all have positive values.
Low frequencies ---  -12.5404   -0.0010   -0.0004    0.0011    8.8313   10.1521
 Low frequencies ---  262.8020  631.1625  637.9824
The frequencies for each vibrational mode in the NH3 BH3 is shown below and it can bee seen that from these vibrational modes only one isn't IR active.
| Frequency (cm-1) | Infared |
|---|---|
| 262.80 | 0 |
| 631.16 | 14 |
| 637.98 | 4 |
| 638.06 | 4 |
| 668.76 | 40 |
| 1068.76 | 40 |
| 1068.78 | 40 |
| 1195.91 | 109 |
| 1203.41 | 3 |
| 1203.47 | 3 |
| 1328.76 | 114 |
| 1676.07 | 28 |
| 2472.39 | 67 |
| 2532.09 | 231 |
| 2532.79 | 231 |
| 3464.20 | 3 |
| 3581.14 | 28 |
| 3581.27 | 28 |
Comparing NH3, BH3 and NH3BH3
| molecule | energy(a.u) |
|---|---|
| NH3 | -56.55776872 |
| BH3 | -26.61532364 |
| NH3 BH3 | -83.22469011 |
The energy difference for the molecules can then be computed using the equation: ΔE=E(NH3BH3)-[E(NH3)+E(BH3)]= -83.22469011-(-56.55776872+-26.61532364)= -0.05159775a.u
This can then be converted to KJ/mol giving an energy difference value of -135.47(5sf) KJ/mol. This value represents the association energy of combining a molecule of NH3 with a molecule of BH3 and hence the dissociation energy of NH3 BH3. Comparing this with the literature association energy value of -172.1 kJ/mol [5] shows that the experimental value is higher than the computed value. This could be due to the fact that each time a basis set is used an assumption is being made in the calculation on Gaussian which will modify the energies.
Mini project: Aromaticity
Benzene
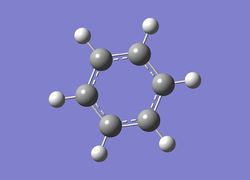
Optimisation of benzene
An optimisation was run on benzene using a 6-31G basis set and the file uploaded to D-space can be found here: DOI:10042/22530 .
The table below summaries the key information gained from the optimisation of the molecule and the molecules key physical data.
Comparing the C-C bond length with the literature value of 1.40Å [6] shows that optimsation was carried out accurately as the values are the same to 2dp.
The table below shows that the optimisation has been completed as all force and displacement values have converged.
Item               Value     Threshold  Converged?
 Maximum Force            0.000090     0.000450     YES
 RMS     Force            0.000024     0.000300     YES
 Maximum Displacement     0.000337     0.001800     YES
 RMS     Displacement     0.000103     0.001200     YES
 Predicted change in Energy=-4.743663D-08
 Optimization completed.
    -- Stationary point found.
Frequency analysis of benzene
Next a frequency analysis was run on the molecule to ensure that structure was a minimum. The file was uploaded to D-space and can be found here: DOI:10042/22554 .
A table summarising the key data for the frequency analysis is shown below.
The item data below shows that the molecule was optimised as all of the force and displacement constants have converged.
Item               Value     Threshold  Converged?
 Maximum Force            0.000080     0.000450     YES
 RMS     Force            0.000019     0.000300     YES
 Maximum Displacement     0.000119     0.001800     YES
 RMS     Displacement     0.000053     0.001200     YES
 Predicted change in Energy=-2.306327D-08
 Optimization completed.
    -- Stationary point found.
The low frequency values shown below confirm that the minimum structure was found due to the fact there the low frequency values are in the correct range and the 'real' frequencies all have positive values.
Low frequencies ---   -4.4276   -0.0013   -0.0009    0.0005    0.8147    6.6272
 Low frequencies ---  414.4812  414.5773  621.0841
| No. | Animation | Frequency(cm-1) | Infared | Type of Vibration | |||
| 1 |
|
695.06 | 74.23 | 6H bending in and out of plane | |||
| 2 |
|
1066.55 | 3.3862 | 4H scissoring 2H stationary | |||
| 3 |
|
1066.63 | 3.3855 | 6H rocking | |||
| 4 |
|
1524.56 | 6.6215 | 4H rocking in the plane 2H stationary | |||
| 5 |
|
1524.62 | 6.6215 | 6H rocking in the plane | |||
| 6 |
|
3171.49 | 0.0002 | 6H asymmetric stretching | |||
| 7 |
|
3196.70 | 46.6418 | 4H symmetric stretching 2H asymmetric stretching | |||
| 8 |
|
3196.77 | 46.6272 | two x 3H symmetric stretching |
Population analysis of benzene
Next a population analysis was run of benzene and deposited in D-space as seen here: DOI:10042/22572 .
The table below summaries the population analysis data for benzene.
Natural orbital analysis of benzene
Next the .log file was used in order to carry out a natural orbital analysis of benzene. The charge distrbution was calculated and the colour range was from -1.00 to 1.00. An image of the molecules charge distribution is shown below with the green representing a region of positive charge and the red representing a region of negative charge.
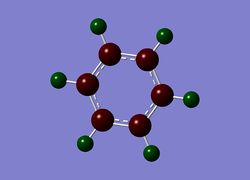
Then the specifc NBO charges were observed for the molecule with the natural charge numbers for H and C being shown in the image below.
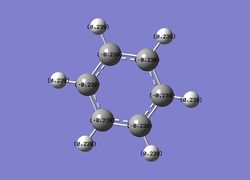
Another way that the natural charge numbers can be found can be found is in the NBO data as shown below.
Summary of Natural Population Analysis:

                                       Natural Population
                Natural  -----------------------------------------------
    Atom  No    Charge         Core      Valence    Rydberg      Total
 -----------------------------------------------------------------------
      C    1   -0.23859      1.99910     4.22617    0.01331     6.23859
      C    2   -0.23860      1.99910     4.22618    0.01331     6.23860
      C    3   -0.23856      1.99910     4.22615    0.01331     6.23856
      C    4   -0.23859      1.99910     4.22617    0.01331     6.23859
      C    5   -0.23860      1.99910     4.22618    0.01331     6.23860
      C    6   -0.23856      1.99910     4.22615    0.01331     6.23856
      H    7    0.23858      0.00000     0.75998    0.00144     0.76142
      H    8    0.23859      0.00000     0.75998    0.00143     0.76141
      H    9    0.23858      0.00000     0.75998    0.00144     0.76142
      H   10    0.23858      0.00000     0.75998    0.00144     0.76142
      H   11    0.23859      0.00000     0.75998    0.00143     0.76141
      H   12    0.23858      0.00000     0.75998    0.00144     0.76142
 =======================================================================
   * Total *    0.00000     11.99462    29.91689    0.08849    42.00000
The table below summaries the bond coefficients and orbital hybridizations for the molecule.
| Bond | Coefficient | Hybridization |
|---|---|---|
| C-C | C(50.00%)C(50.00%) | C[s( 35.20%) p( 64.76%)d(0.04%)] |
| C-H | C( 62.04%) H(37.96%) | C[s( 29.57%)p 2.38(70.39%)d(0.04%)] H[s( 99.95%)p(0.05%)] |
The table below shows that all the carbons have equal orbital contribution to the C-C bonds as would be expected and that they are all sp2 hybridized due to and p:s ratio of approximately 2:1. The sp2 hybridization is consistent with the fact that the molecule is aromatic. The C-H bonds consist of 62.07% carbons orbitals and 37.96% hydrogen orbitals. The hydrogen orbitals can be assumed to be 100% s orbitals.
MO diagram of benzene
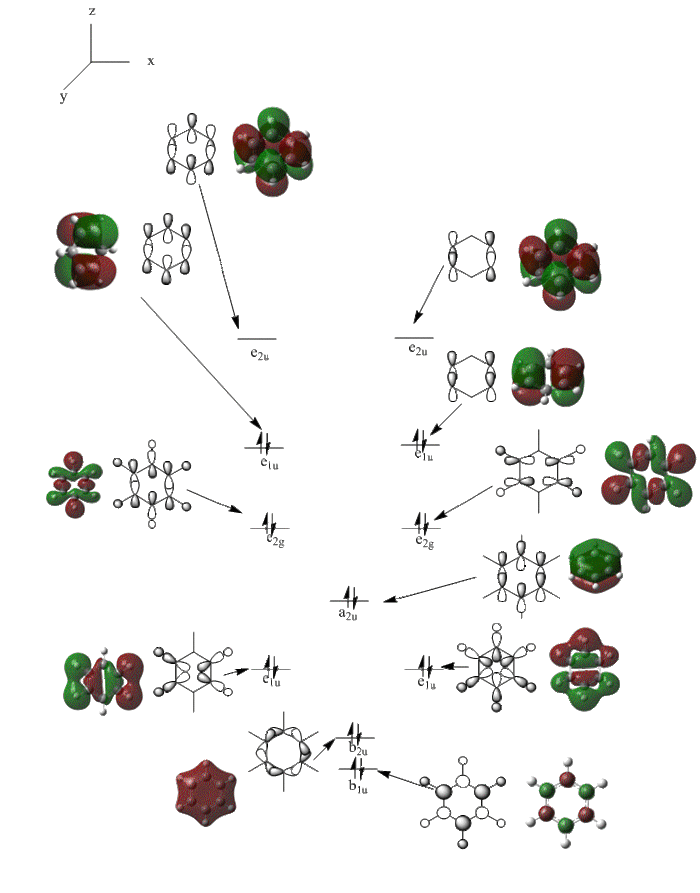
The molcular obitrals were computed in gaussian and then a molecular orbital diagram was drawn of the central sigma- and pi- orbitals using the original AO's. The two e2u orbitals are unoccupied and make up the LUMO with the lower energy orbitals below all being occupied orbitals. The HOMO orbitals are the degenerate e1u orbitals. The symmetries of the orbitals was obtained from the frequency analysis data as shown previously.
Boratabenzene
Optimisation of boratabenzene
An optimisation of boratabenzene was carried out and the file uploded to D-sapce can be found here: DOI:10042/22607 .
The table below summaries the key information gained from the optimisation of the molecule and the molecules key physical data.
Comparing the B-C bond with the literature value of 1.51Å [7] shows perfect comparison and hence, the molecule was optimised accurately by Gaussian.
The item data below shows that the molecule was optimised as all of the force and displacement constants have converged.
Item               Value     Threshold  Converged?
 Maximum Force            0.000061     0.000450     YES
 RMS     Force            0.000018     0.000300     YES
 Maximum Displacement     0.000279     0.001800     YES
 RMS     Displacement     0.000088     0.001200     YES
 Predicted change in Energy=-3.748094D-08
 Optimization completed.
    -- Stationary point found.
Frequency analysis boratabenzene
A frequenecy analysis was then run on boratabenzene and the file uploaded to D-space can be found here: DOI:10042/22619 .
A table summarising the key data for the frequency analysis is shown below.
The item data below shows that the molecule has been fully optimised as all forces and displacements have converged.
Item               Value     Threshold  Converged?
 Maximum Force            0.000062     0.000450     YES
 RMS     Force            0.000018     0.000300     YES
 Maximum Displacement     0.000207     0.001800     YES
 RMS     Displacement     0.000062     0.001200     YES
 Predicted change in Energy=-3.100009D-08
 Optimization completed.
    -- Stationary point found.
The low frequency values shown below confirm that the minimum structure was found due to the fact there the low frequency values are in the correct range and the 'real' frequencies all have positive values.
Low frequencies ---   -7.2829   -0.0008   -0.0005    0.0003    0.7790    5.4612
 Low frequencies ---  371.2971  404.4143  565.1056
Population analysis of boratabenzene
Next a population analysis was carried out on boratabenzene and uploaded to D-space as shown here: DOI:10042/22625
The table below summaries the population analysis data for boratabenzene.
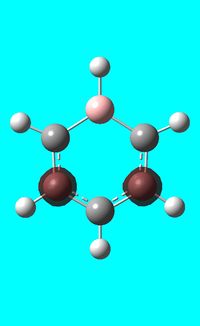
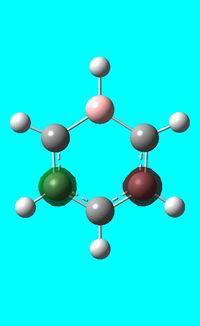
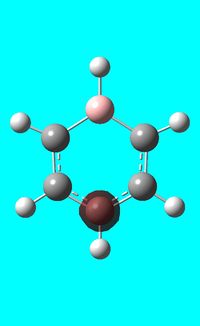
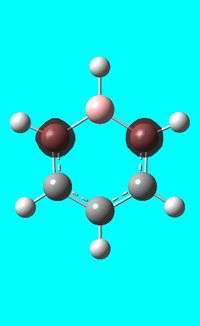
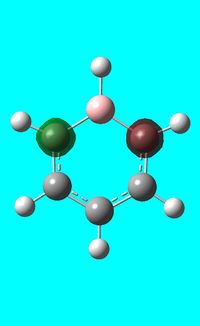
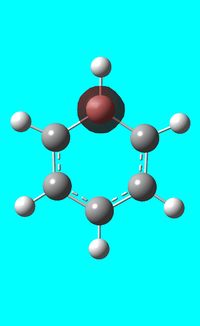
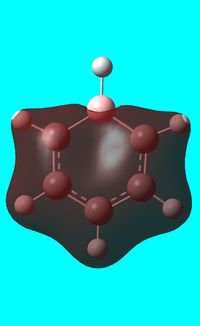
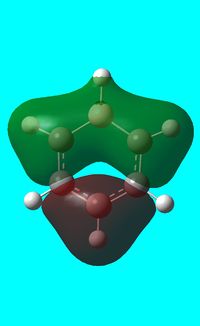
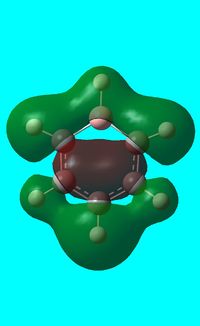
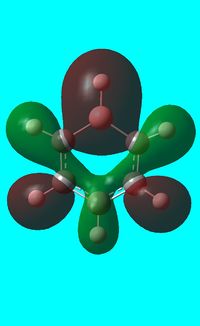
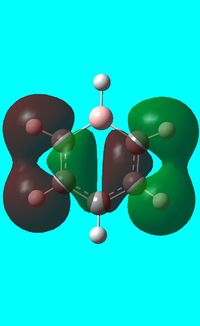
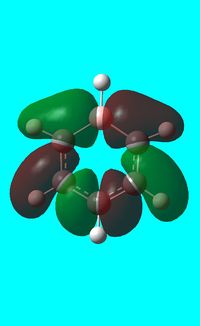
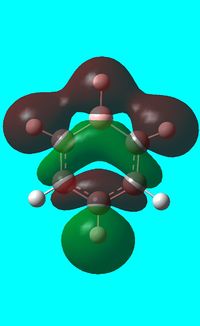
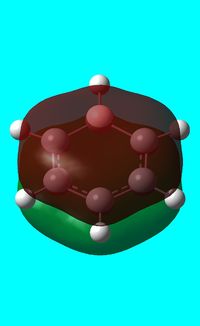
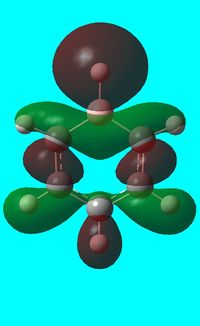
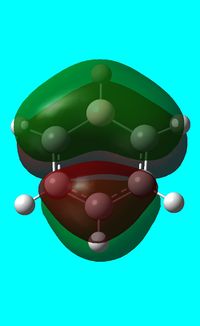
The computed occupied MO orbitals of boratabenzne are shown below from smallest to largest energy.
 |
 |
 |
 |
|
 |
 |
 |
 |
|
 |
 |
 |
 |
|
 |
 |
 |
 |
|
|
Natural bond orbital analysis of boratabenzene
Next the .log file was used in order to carry out a natural orbital analysis of boratabenzene. The charge distrbution was calculated and the colour range was from -1.00 to 1.00. An image of the molecules charge distribution is shown below with the green representing a region of positive charge and the red representing a region of negative charge.
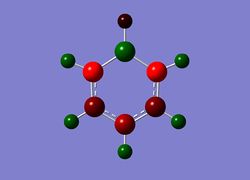
Then the specifc NBO charges were observed for the molecule with the natural charge numbers as shown below.
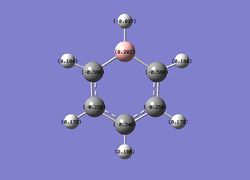
Another way that the natural charge numbers can be found can be found is in the NBO data as shown below.
Summary of Natural Population Analysis:

                                       Natural Population
                Natural  -----------------------------------------------
    Atom  No    Charge         Core      Valence    Rydberg      Total
 -----------------------------------------------------------------------
      C    1   -0.58807      1.99901     4.57728    0.01178     6.58807
      C    2   -0.25031      1.99910     4.23708    0.01413     6.25031
      C    3   -0.34002      1.99907     4.32711    0.01384     6.34002
      C    4   -0.25031      1.99910     4.23708    0.01413     6.25031
      C    5   -0.58807      1.99901     4.57728    0.01178     6.58807
      H    6   -0.09651      0.00000     1.09598    0.00054     1.09651
      H    7    0.18387      0.00000     0.81394    0.00218     0.81613
      H    8    0.17898      0.00000     0.81839    0.00263     0.82102
      H    9    0.18573      0.00000     0.81228    0.00199     0.81427
      H   10    0.17898      0.00000     0.81839    0.00263     0.82102
      H   11    0.18387      0.00000     0.81394    0.00218     0.81613
      B   12    0.20186      1.99906     2.78748    0.01160     4.79814
 =======================================================================
   * Total *   -1.00000     11.99436    29.91623    0.08941    42.00000
The table below summaries The coefficient section of the table explains the orbital contribution of each atom towards the total bond.
| Bond | Coefficient | Hybridization |
|---|---|---|
| C-C | C(49.23%)C(50.77%) | C[2 s( 37.60%) p( 62.37%)d(0.03%)] |
| C-H | C( 59.41%)H (40.59%) | C[1 s( 25.41%)p 2.93( 74.54%)d( 0.05%)] H[s( 99.95%) p(0.05%)] |
| C-B | C(66.70%) B(33.30%) | C[s( 42.00%)p( 57.99%)d(0.01%)] B[ s( 33.40%) p(66.52%) d(0.08%)] |
| B-H | B(55.09%) H(44.91%) | B[ 33.16%) p( 66.78%) d( 0.06%)] H[ s( 99.97%) p(0.03%)] |
Contrasted with benzene, the carbons in the molecule do not quite have equal orbital contribution towards a C-C bond due to the presence of the heteroatom. The carbons are shown to be sp2 hybridized due to the p:s ratio being approximately 2:1. The B-C bonds consist of 66.7% carbon orbital contribution and and 33.3% boron contribution. The boron hybridization also appears to be sp2 hybridized due to the p:s orbital ratio once again being approximately 2:1. As seen previously all of the hydrogen's can be assumed to contain 100% s orbital contribution towards the C-H and B-H bonds.
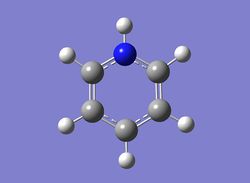
Pyridinium
Optimisation of pyridinium
A molecule of Pyridinium was optimised and the file uploaded to D-space can be found here: DOI:10042/22640 .
The table below summaries the key information gained from the optimisation of the molecule and the molecules key physical data.
Comparing the N-C bond distance with the literature value of 1.35Å [8] reinforces the accuracy of optimizing a molecule using Gaussian.
The item data below shows that the molecule was optimised as all of the force and displacement constants have converged.
Item               Value     Threshold  Converged?
 Maximum Force            0.000102     0.000450     YES
 RMS     Force            0.000032     0.000300     YES
 Maximum Displacement     0.000835     0.001800     YES
 RMS     Displacement     0.000253     0.001200     YES
 Predicted change in Energy=-1.440721D-07
 Optimization completed.
Frequency analysis of pyridinium
A frequenecy analysis was then run on pyridinium and the file uploaded to D-space can be found here: DOI:10042/22643 .
A table summarising the key data for the frequency analysis is shown below.
The item data below shows that the molecule was optimised as all of the force and displacement constants have converged.
Item               Value     Threshold  Converged?
 Maximum Force            0.000118     0.000450     YES
 RMS     Force            0.000035     0.000300     YES
 Maximum Displacement     0.000657     0.001800     YES
 RMS     Displacement     0.000203     0.001200     YES
 Predicted change in Energy=-1.355395D-07
 Optimization completed.
    -- Stationary point found.
The low frequency values shown below confirm that the minimum structure was found due to the fact there the low frequency values are in the correct range and the 'real' frequencies all have positive values.
Low frequencies ---   -9.6834   -4.4923    0.0006    0.0010    0.0011    0.9774
 Low frequencies ---  391.9357  404.3223  620.2404
Population analysis of pyridinium
Next a population analysis was carried out on pyridinium and the file uploaded to D-space can be found here: DOI:10042/22647 .
The table below summaries the population analysis data for pyridinium.
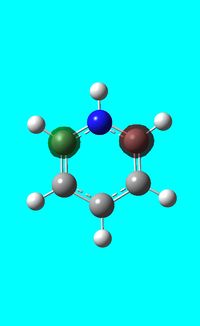
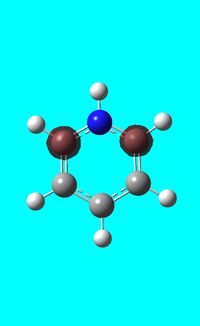
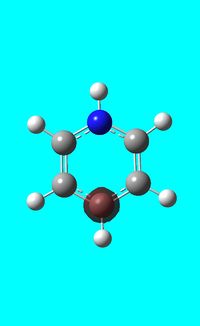
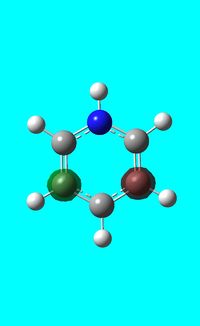
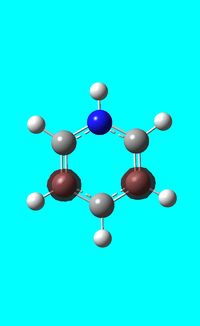
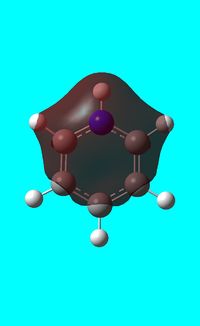
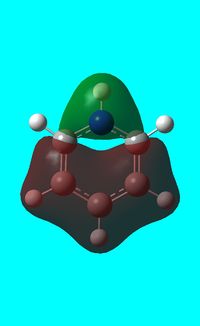
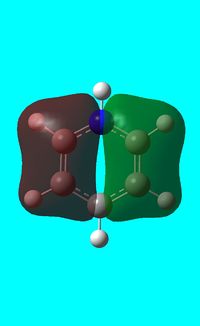
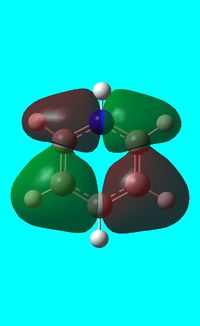
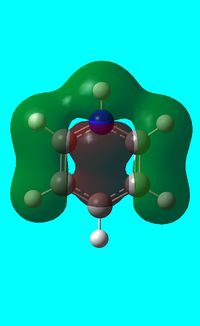
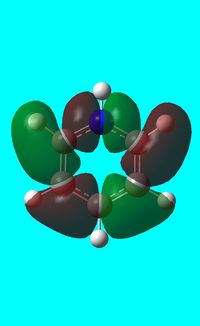
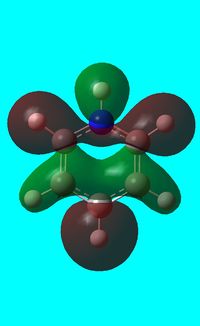
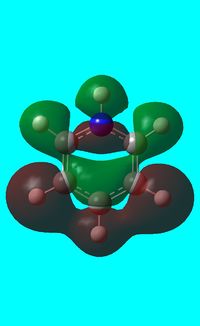
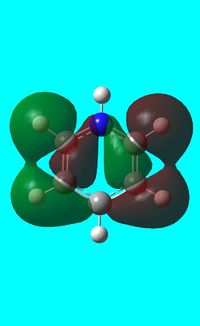
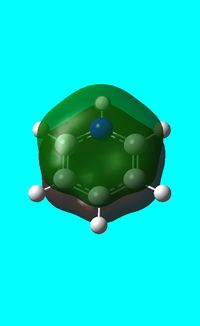
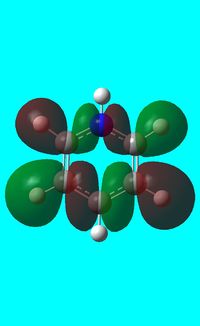
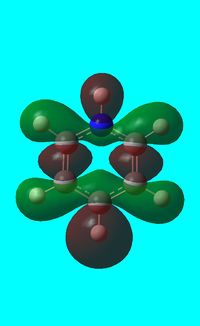
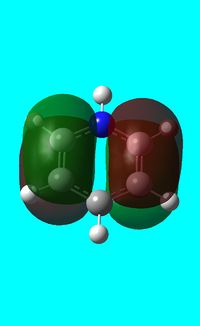
The computed occupied MO orbitals of pyridinium are shown below from smallest to largest energy.
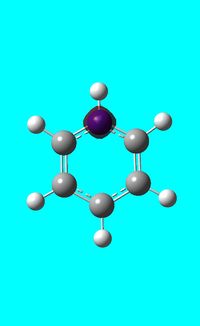 |
 |
 |
 |
|
 |
 |
 |
 |
|
 |
 |
 |
 |
|
 |
 |
 |
 |
|
|
Natural bond orbital analysis of pyridinium
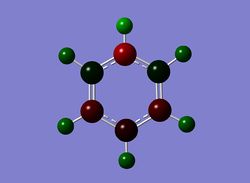
Next the .log file was used in order to carry out a natural orbital analysis of pyridinium. The charge distribution was calculated and the colour range was from -1.00 to 1.00. An image of the molecules charge distribution is shown below with the green representing a region of positive charge and the red representing a region of negative charge.
Then the specific NBO charges were observed for the molecule with the natural charge numbers as shown below.
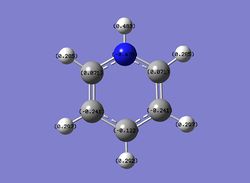
Another way that the natural charge numbers can be found can be found is in the NBO data as shown below.
Summary of Natural Population Analysis:

                                       Natural Population
                Natural  -----------------------------------------------
    Atom  No    Charge         Core      Valence    Rydberg      Total
 -----------------------------------------------------------------------
      C    1    0.07095      1.99918     3.91072    0.01916     5.92905
      C    2   -0.24110      1.99912     4.22866    0.01331     6.24110
      C    3   -0.12231      1.99913     4.10931    0.01386     6.12231
      C    4   -0.24110      1.99912     4.22867    0.01331     6.24110
      C    5    0.07097      1.99918     3.91070    0.01916     5.92903
      H    6    0.48278      0.00000     0.51476    0.00246     0.51722
      H    7    0.28494      0.00000     0.71396    0.00110     0.71506
      H    8    0.29719      0.00000     0.70178    0.00103     0.70281
      H    9    0.29172      0.00000     0.70715    0.00113     0.70828
      H   10    0.29719      0.00000     0.70178    0.00103     0.70281
      H   11    0.28494      0.00000     0.71396    0.00110     0.71506
      N   12   -0.47616      1.99937     5.46749    0.00929     7.47616
 =======================================================================
   * Total *    1.00000     11.99510    29.90894    0.09595    42.00000
The table below summaries the bond coefficients and orbital hybridization's for the molecule.
| Bond | Coefficient | Hybridization |
|---|---|---|
| C-C | C(50.42%)C(49.58%) | C[s( 38.50%) p( 61.46%)d(0.04%)] |
| C-H | C( 64.26%) H(35.74%) | C[s( 33.44%) p( 66.53%) d(0.04%)] H[s(99.94%) p(0.06%)] |
| C-N | C(36.68%) N(63.32%) | C[s( 28.13%) p( 71.74%) d(0.13%)] N[ s( 36.55%) p(63.42%) d(0.03%)] |
| B-H | N(74.59%) H(25.41%) | N[ s( 26.83%) p (73.15%) d (0.02%)] H[ s( 99.88%) p ( 0.12%)] |
It can be seen from the table that the C-N bond consists of a 36.7% carbon orbital contribution and a 63.3% nitrogen orbital contribution. The hybridization column shows that the nitrogen is sp2 hybridized due to the fact that it there is an p:s orbital ratio which is approximately 2:1. The carbons in the C-C bond also appear to be sp2 hybridized due to a 2:1 p:s ratio. All bonding hydrogen's can be assumed to have 100% s orbital hybridization.
Borazine
Optimisation of borazine
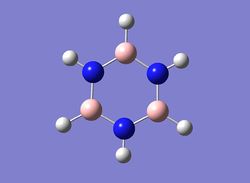
A molecule of borazine was optimised and the file uploaded to D-space can be found here: DOI:10042/22660 .
The table below summaries the key information gained from the optimisation of the molecule and the molecules key physical data.
Comparing the computed B-N bond length with the literature value of 1.35Å[9] shows that the computed value is slightly higher than the experimental value. This could be due to the fact that the method used for the Gaussian calculation uses assumptions which can slightly lower the accuracy of the optimisation.
The item data below shows that the molecule was optimised as all of the force and displacement constants have converged.
Item               Value     Threshold  Converged?
 Maximum Force            0.000141     0.000450     YES
 RMS     Force            0.000053     0.000300     YES
 Maximum Displacement     0.000673     0.001800     YES
 RMS     Displacement     0.000238     0.001200     YES
 Predicted change in Energy=-4.499634D-07
 Optimization completed.
    -- Stationary point found.
Frequency analysis of borazine
A frequency analysis was then run on borazine and the file uploaded to D-space can be found here: DOI:10042/22666 .
A table summarising the key data for the frequency analysis is shown below.
The item data below shows that the molecule was optimised as all of the force and displacement constants have converged.
Item               Value     Threshold  Converged?
 Maximum Force            0.000138     0.000450     YES
 RMS     Force            0.000052     0.000300     YES
 Maximum Displacement     0.000536     0.001800     YES
 RMS     Displacement     0.000176     0.001200     YES
 Predicted change in Energy=-3.159757D-07
 Optimization completed.
    -- Stationary point found.
The low frequency values shown below confirm that the minimum structure was found due to the fact there the low frequency values are in the correct range and the 'real' frequencies all have positive values.
Low frequencies ---   -4.7129   -2.6334   -0.0005    0.0004    0.0006    6.4565
 Low frequencies ---  289.7623  289.8419  404.8389
Population analysis of Borazine
Next a population analysis was carried out on borazine and uploaded to D-space as shown here: DOI:10042/22672 .
The table below summaries the population analysis data for borazine.
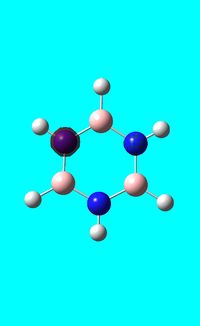
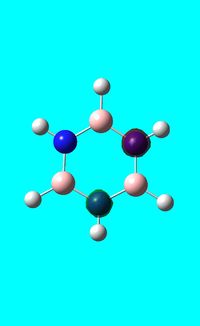
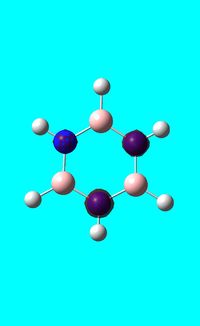
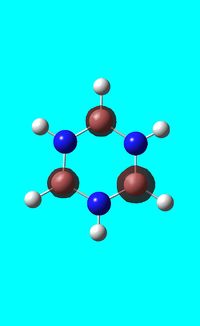
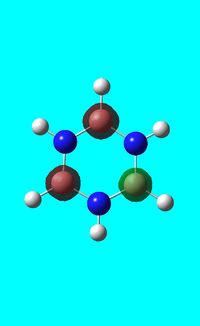
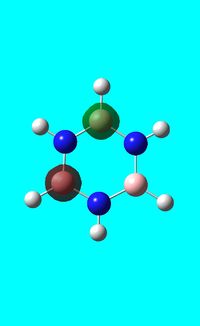
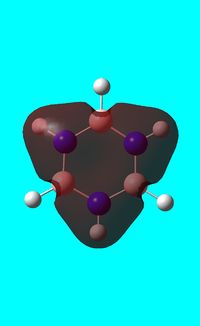
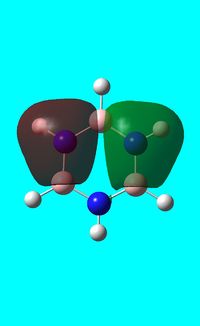
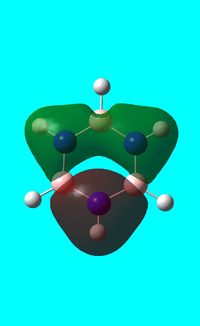
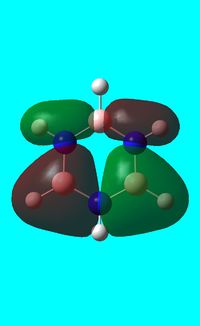
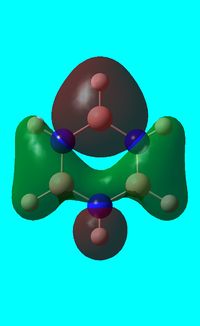
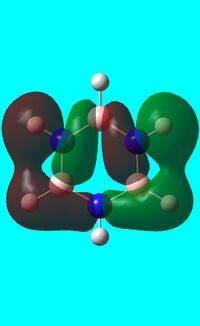
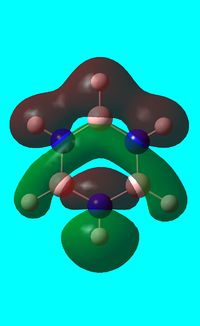
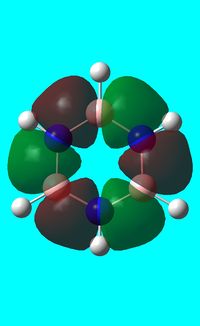
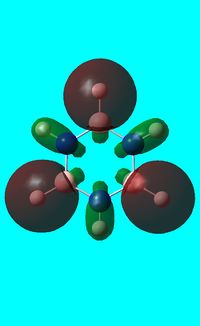
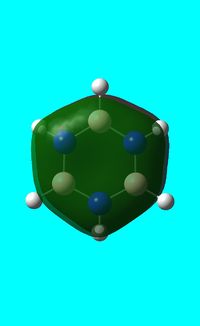
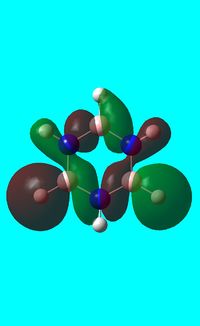
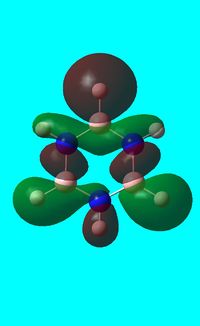
The computed occupied MO orbitals of borazine are shown below from smallest to largest energy.
 |
 |
 |
 |
|
 |
 |
 |
 |
|
 |
 |
 |
 |
|
 |
 |
 |
 |
|
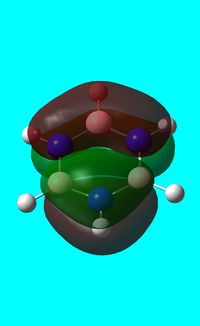
|
Natural bond orbital analysis of borazine
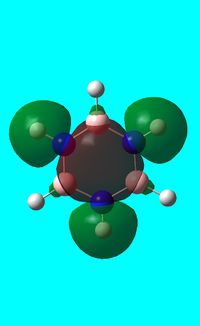
Next the .log file was used in order to carry out a natural orbital analysis of borazine. The charge distribution was calculated and the colour range was from -1.00 to 1.00. An image of the molecules charge distribution is shown below with the green representing a region of positive charge and the red representing a region of negative charge.
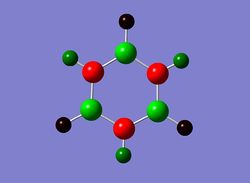
Then the specific NBO charges were observed for the molecule with the natural charge numbers as shown below.
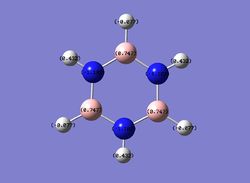
Another way that the natural charge numbers can be found can be found is in the NBO data as shown below.
Summary of Natural Population Analysis:

                                       Natural Population
                Natural  -----------------------------------------------
    Atom  No    Charge         Core      Valence    Rydberg      Total
 -----------------------------------------------------------------------
      H    1    0.43192      0.00000     0.56579    0.00229     0.56808
      H    2   -0.07651      0.00000     1.07582    0.00069     1.07651
      H    3    0.43194      0.00000     0.56578    0.00229     0.56806
      H    4   -0.07651      0.00000     1.07582    0.00069     1.07651
      H    5    0.43193      0.00000     0.56578    0.00229     0.56807
      H    6   -0.07651      0.00000     1.07581    0.00069     1.07651
      B    7    0.74692      1.99917     2.23871    0.01520     4.25308
      B    8    0.74695      1.99917     2.23867    0.01520     4.25305
      B    9    0.74696      1.99917     2.23867    0.01520     4.25304
      N   10   -1.10236      1.99943     6.09815    0.00478     8.10236
      N   11   -1.10237      1.99943     6.09816    0.00478     8.10237
      N   12   -1.10237      1.99943     6.09816    0.00478     8.10237
 =======================================================================
   * Total *    0.00000     11.99579    29.93533    0.06888    42.00000
The table below summaries the bond coefficients and orbital hybridization's for the molecule.
| Bond | Coefficient | Hybridization |
|---|---|---|
| N-B | N(76.47%)B(23.53%) | N[s( 38.56%) p( 61.43%) d(0.01%)] B[s( 31.25%) p(68.51%) d(0.25%)] |
| N-H | N( 71.92%) H(28.08%) | N[s( 22.80%) p(77.17%)d(0.03%)] H[s( 99.91%) p(0.09%)] |
| B-H | B(45.97%) H(54.03%) | B[37.49%) p( 62.45%)d(0.07%)] H[ s( 99.96%) p(0.04%)] |
The N-B bond consists of 76.5% N orbitals and 23.%% B orbitals which is consistent with the fact that the nitrogen is an electronegative atom and therefore electron donating towards the boron. The N atoms can be seen to be sp2 hybridized due to the fact that the p:s ratio is approximately 2:1. The boron atom is equally sp2 hybridized for this molecule. All hydrogen's can be considered to have a orbital hybridization of 100% s.
Comparing the charge distribution of benzene, boratabenzene, pyridinium and borazine
Benzene has 6 carbons which all carry the same negative charge distribution value of (-0.23859) with the hydrogen's all carrying approximately the same region of positive charge (0.2386(4sf)). This confirms that benzene is a symmetrical molecule as it has a uniform charge across all atoms.
Boratabenzene has a region of postive charge( 0.20186 ) on the boron atom(atom 1 in the table) and in comparison the hydrogen bound to the boron is negatively charged, which is the reverse of the charge of all of the C-H units. This affect highlights the electropositive nature of the boron atom and the explanation for the negatively charged hydrogen is due to the electron donating effect of boron, creating a hydride like hydrogen. Another consequence of the electropositivity of the boron is that the adjacent carbons are more negatively charged than the others,as seen by their charge distribution values( -0.58807, -0.58807). Boratabenzene is isoelectronic with benzene and therefore it is interesting to note the difference in charge distribution that can occur from substituting one atom. The differences in charge distribution stems from the electropositve nature of the boron, as the carbon para to the boron also seems to experience an electron donating effect with the meta carbons having a similar charge distribution to those in benzene.
Pyridinium has a nitrogen atom with a large region of negative charge(-0.47616 (atom1)) and this is due to the electronegative nature of nitrogen compared to carbon and hydrogen. In this molecule the carbons either side of the nitrogen have a positive charge value (0.07098 and 0.07095) which is contrasted with the negative charge values of the other carbons. This is caused by the fact that the nitrogen draws electron density away from the carbons in order to create a stable molecule. The Nitrogen also causes the hydrogen bound to it to be significantly positively charged in comparison to the other hydrogens. This can be explained by the electronegativity difference between the two atoms in the bond causing the electron density to be drawn towards the nitrogen, leaving a hydrogen with a significant positive charge. This molecule is once again isoelectronic with benzene and the difference in the charge distribution of the carbon atoms is only significant in those adjacent and para to the nitrogen. The carbon para to the nitrogen also seems to experience an electron withdrawing effect from the nitrogen albeit much smaller than those adjacent to it.
Borazine contains far more electropositive boron's ( 0.74692, 0.74695, 0.74696 (atoms 1,3 and 5))than boratabenzne and far more electronegative nitrogens ( -1.10236,-1.10237, -1.10237 (atoms 2,4 and 6) than pyridinium. The hydrogen's bound to the boron atoms carry an electronegative charge (-0.07651) due to the electron donating nature of the boron and the electronegativity difference between the atoms. In comparison, the hydrogen's bound to nitrogen atoms carry an electropositive charge due to the electron withdrawing effect of the nitrogen. The reason that the borazine boron atoms have a greater positive charge than that in pyridinium is due to the fact that boron is more electron positive than carbon which results in a greater donating effect towards nitrogen in borazine creating a region of higher positive charge. This explanation can also be used to explain why the borazine nitrogen has a larger negative charge than nitrogen in pyridinium, due to the fact that the nitrogen in the first is experiencing a greater push of electrons towards it creating a more negatively charged atom.
Comparing the MO obirtals of benzene, boratabenzene, pyridinium and borazine
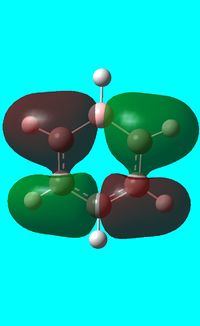
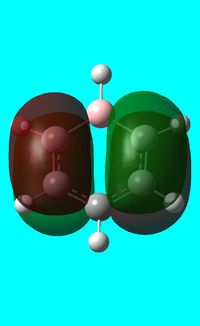
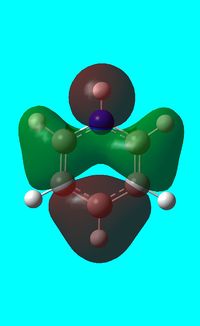
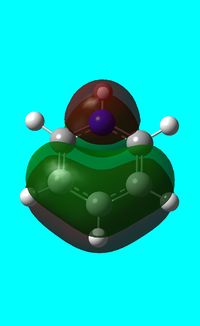
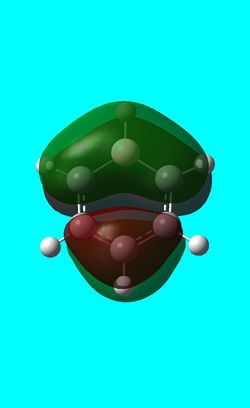
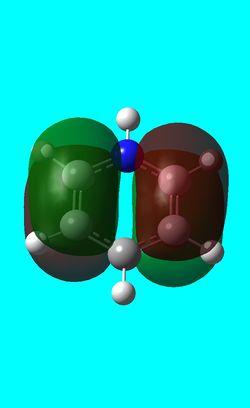
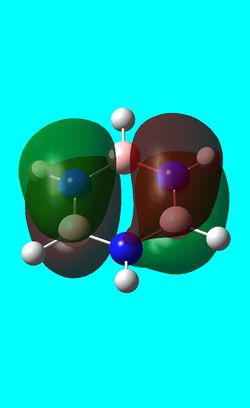
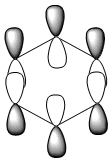
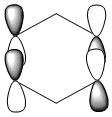
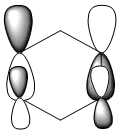
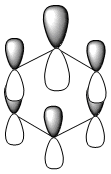
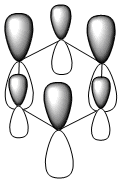
Three MO orbitals were then chosen to be compared across the four aromatic molecules, the HOMO, HOMO -1 and the isonodal or all pi bonding orbitals.
| Benzene | Boratabenzene | Pyridinium | Borazine | |
|---|---|---|---|---|
| HOMO | 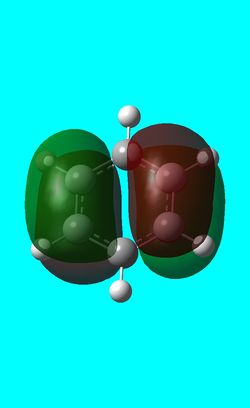 -0.24690a.u -0.24690a.u |
 0.01094a.u 0.01094a.u |
 -0.47885 a.u -0.47885 a.u |
 -0.27589a.u -0.27589a.u
|
| LCAO | 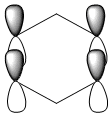 |
 |
 |
|
The first molecular orbital to be compared is the HOMO orbital of each molecule. Firstly, looking at the benzene HOMO it can be seen that there is one node cutting through the plane of benzene with equal electron density on both sides. Boratabenzene also has one nodal plane but this time it does not cut through any atoms and instead through bonds. It can be seen from the MO orbital that there is greater electron density on the boron compared to the carbons and this is due to the fact that it carries a negative charge. The carbons surrounding the boron also have comparatively more electron density than the non-boron bound carbons and this is due to the fact that the boron is electropositive and is therefore pushing electron density towards the carbons. The hydrogen bound to the boron also has electron density which is contrasted to the carbon bound hydrogen's and this is because the electropositive boron is also donating electron density to the hydrogen. Pyridinium has a nodal plane running through the nitrogen and carbon of the molecule, with an equal distribution of electron density over all other carbons. The nitrogen in this case contains no electron density and this could due to the fact that it contains a formal positive charge. In borazine, a nodal plane cuts through the nitrogen and a carbon atom with almost equal electron density spread over the remaining carbon atoms. There is however, a small amount of electron density over the nitrogen atom due to its electronegative nature.
To summarise, all HOMO orbitals have a nodal plane running perpendicular to the plane of the molecule.
| Benzene | Boratabenzene | Pyridinium | Borazine | |
|---|---|---|---|---|
| HOMO -1 | 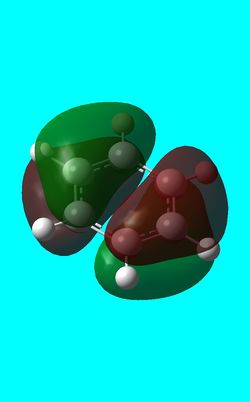 -0.24692a.u -0.24692a.u |
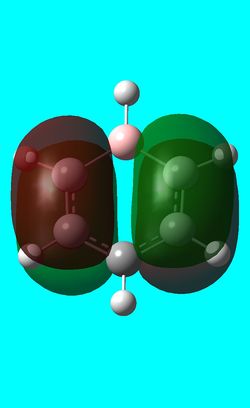 -0.03493a.u -0.03493a.u |
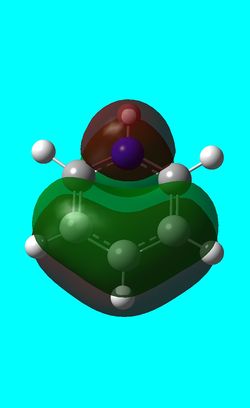 -0.50848a.u -0.50848a.u |
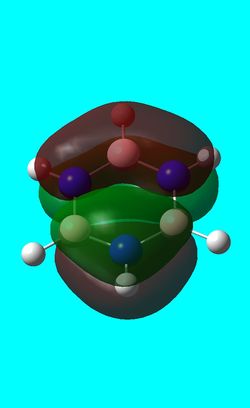 -0.27588a.u -0.27588a.u
|
| LCAO | 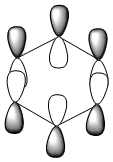 |
 |
 |

|
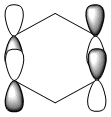
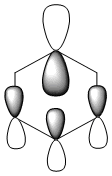
Benzene and borazine have degenerate HOMO orbitals due to the symmetry of the molecules. For the orbital of benzene shown above, a nodal plane runs through the center of the molecule, but this time not through the atoms and instead through the bonds. Once again, due to the symmetry of benzene the electron density is spread evenly over all carbon atoms. The degeneracy of the orbitals is shown by the fact that the energies between the two HOMO orbitals are the same to 4 decimal places. In borazine, the nodal plane runs through a nitrogen and boron. There is more electron density on the side of the molecule containing the most nitrogen's i.e two than the side containing one nitrogen and this is due to the fact that nitrogen is electronegative, whereas boron is electropositive. Boratabenzene and pyridinium,in contrast, do not have degenerate orbitals due to the presence of the heteroatom and the HOMO -1 orbital is lower in energy for both. Firstly, looking at boratabenzene it can be seen from the computed MO orbital that the nodal plane runs perpendicular to the molecule through the boron and a carbon atom. The electron density is then spread evenly over the remaining carbon atoms in the molecule. The reason that the HOMO -1 orbital is lower in energy than the HOMO can be explained by looking at the LCAO's. The Boron orbital is more electropositive than the carbons and hence is smaller in the LCAO and this means that when electron density is placed on it as seen for the HOMO orbital, it becomes destabilized, increasing the orbitals energy. Now looking at pyridinium there is also a node, but it does not cut through the plane of the molecule and instead isolates the nitrogen as a region of high electron density. The reason that there is no electron density on the adjacent carbon atoms can be explained by the electron withdrawing nature of nitrogen, which pulls electron density towards it making the carbons electron deficient in comparison. The energy difference between the HOMO and HOMO -1 for pyridinium can be explained by looking at the LCAO's and the nodal planes of the two molecules. The LCAO's for this molecule shows that the nitrogen is more electronegative then the carbons, due to the orbitals increased size and hence it is stabilized when electron density is localized onto it. Therefore, as a nodal plane runs through the nitrogen in the HOMO, it results in a lack of electron density surrounding it, which means that the orbital is destabilized increasing its energy above that of the HOMO -1.
| Benzene | Boratabenzene | Pyridinium | Borazine | |
|---|---|---|---|---|
| Isonodal | 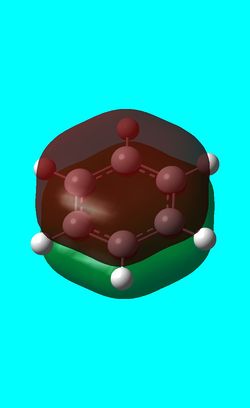 -0.35996a.u -0.35996a.u |
 -0.13211a.u -0.13211a.u |
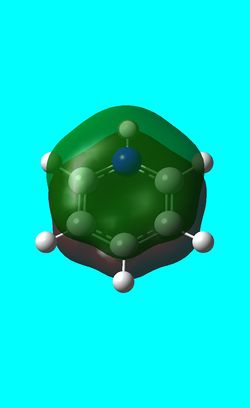 -0.64064a.u -0.64064a.u |
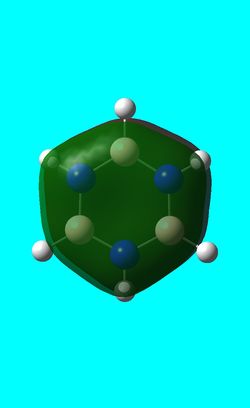 -0.36131a.u -0.36131a.u
|
| LCAO | 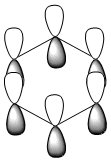 |
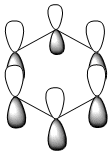 |
 |
|
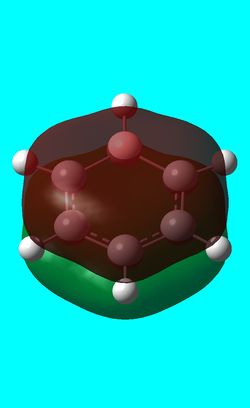
All of the 4 molecular orbitals shown above are fully pi bonding orbitals and are also isonodal as they show the same electron distribution. Benzene has an even distribution of electron density above and below the plane of the ring showing the aromaticity which is characteristic of this molecule. In boratabenzne, the electron density is shifted away from the boron towards the carbon atoms distorting rather than having a symmetrical distribution and this is due to the introduction of a heteroatom to the system. The Boron, being electropositive as described previously, has an electron donating effect which pushes the electron density towards the carbons. Although, a characteristically electropositive atom, boron in this case due to the negative charge, contributes towards the total aromaticity of the molecule. Pyridinium has the opposite effect, as the electron density is shifted towards the heteroatom, in this case nitrogen, although still above and below the plane of the ring. This can be explained due to the concepts previously discussed, the eletronegativty of the nitrogen compared to the carbons. The electronegativity of nitrogen can also explain why the pyridinium orbital is lowest in energy out of the four fully pi bonding orbitals. The nitrogen atom is more electronegative than carbon compared with boron and therefore the energy of this molecular orbital will be lower than that of borazine and non-nitrogen containing orbitals. It is important to note that the lone pair on the nitrogen in this molecule does not contribute to the total aromaticity of the molecule. Comparatively, boratabenzene which contains boron has the highest energy molecular orbital. This is both due to the fact that boron is more electtropositive than both carbon and nitrogen, but more specifically the reason is due to the fact that it is more electropositive compared to carbon than nitrogen giving a greater difference in electronegativity and a higher energy orbital. The last molecular orbital to discuss is borazine, which has slightly more electron density close to the nitrogens than the borons. The shift in electron density is not as clearly shown in this molecule compared to boratabenzene and pyridinium, due to the fact that the alternating electropositive and electronegative atoms averages out the total electron density of the molecule. This large difference in electronegativity between the atoms in borazine can also rationalize the AO energies associated with the atoms and therefore the aromaticity of the molecule. The electronegative nitrogen orbitals contribute more to the overall bonding orbitals and the boron orbitals contribute more to the antibonding orbitals and this difference results in an unsymmetrical pi electron distribution across the entire molecule and therefore a lower aromaticity than in benzene.
References
- ↑ W.M Haynes CRC handbook of Chemistry and Physics 2011 92nd Ed. 9-21
- ↑ J. Glaser and G. Johansson, Acta Chemica Scandinavica 1982 125-135
- ↑ W.M Haynes CRC handbook of Chemistry and Physics 2011 92nd Ed. 920
- ↑ W.M Haynes CRC handbook of Chemistry and Physics 2011 92nd Ed. 26
- ↑ Yu. Kh. Shaulov; G. O. Shmyreva; V. S. Tubyanskaya, Zhurnal Fizicheskoi Khimii 1966 122-124
- ↑ H. Burgi et al. Angewandte Chemie 1995 1454-1456
- ↑ R. Minyaev et al. Russ. Chem. Bull. Int. Ed. 2001 2332
- ↑ P. Eaton et al., J.Am.Chem.Soc. 1964 3157-3158
- ↑ W. Harshbarger et al., Inorg. Chem. 1969 1683-1689

