JMX Y2 01180512
BH3 Section
|
Method Used |
B3LYP |
|
Basis Set |
6-31G(d,p) |
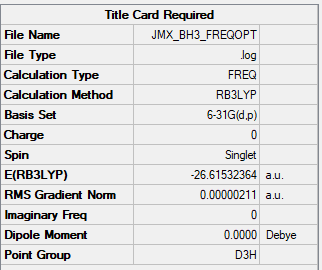
Frequency file: JMX_BH3_FREQOPT.LOG
Low frequencies ---  -11.6892  -11.6814   -6.5475    0.0008    0.0280    0.4290
Low frequencies --- 1162.9746 1213.1390 1213.1392
Optimised BH3 Molecule |
Vibration Analysis
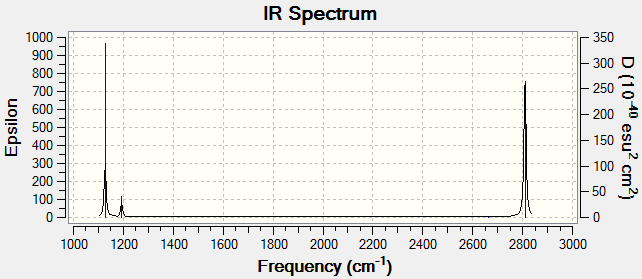
We expect 3N-6=6 normal modes for BH3, but only see 2 large peaks and 1 small peak. This is because:
2 pairs of normal vibration modes with E symmetry are degenerate and show up as a single frequency.
The symmetric stretch does not result in a net change of dipole moment and is IR inactive. This results in zero intesnity.
We do not see 2 frequencies due to degeneracy, and 1 frequency which is IR inactive.
|
Wavenumber/ cm-1 |
Intensity(A.U.) |
Symmetry |
IR Active? |
Type |
|
1127 |
96 |
A2 |
Yes |
Out of Plane Bend |
|
1193 |
12 |
E |
Slightly |
Bend |
|
1193 |
12 |
E |
Slightly |
Bend |
|
2663 |
0 |
A1 |
No |
Symmetric Stretch |
|
2810 |
133 |
E |
Yes |
Asymmetric Stretch |
|
2810 |
133 |
E |
Yes |
Asymmetric Stretch |
IR spectrum predicted by calculations. Matches that of literature data: 1129 cm -1 (Strong), 2775 cm -1 (Strong) and 1195 -1 (Weak) obtained by Pulsed-Laser evaporation of Boron atoms in hydrogen gas and measuring IR of the reaction mixture. The approximate relative intensities of BH3 spectrum obtained experimentally [1] match those predicted by DFT and the number of peaks and wavenumbers predicted by DFT correspond to experimental values as well. Deviations in wavenumbers could be due to limitations in theory used. After all, in this model, the molecule is treated as isolated in a vacuum which is not the case in experimental measurements. Intermolecular interactions can easily cause deviations between theory and experimental values. A more comprehensive theory involving coupled clusters and configurational interactions could make an exact replica of experimental values possible but require more computational power.
MO Diagram of BH3

LCAO uses a qualitative approach, using electronegativity, mixing and symmetry arguments to predict the relative sizes of the MOs, and their relative energy with respect to each other and their parent orbitals. This is useful for getting an intuitive feel for potential chemical phenomena such as reactivity and magnetism (paramagnetism or diamagnetism).
DFT uses a quantum mechanical and mathematical approach which can obtain accurate quantitive values for the orbital coefficients and energies. It also considers orbitals typically ignored by LCAO approach. For example, p orbitals of Hydrogen are involved in DFT calculations but are ignored in the LCAO approach.
The relative size, energy, phase, and shape of the orbitals predicted using qualitative MO theory match that of the molecular orbitals calculated using DFT, and the final shapes are similar as observed above. This is a testimony to the usefulness of qualitative LCAO approach of MO theory as a model. Even though there are some differences in the sizes of the orbitals, the relative phases, and sizes of the orbitals are predicted with great qualitative accuracy. MO theory provides excellent intuition to predict the MO diagrams. LCAO approach is also a guide for which approximations are reasonable. Even without considering p orbitals of Hydrogen, it could give results that show sufficient correspondence to DFT predictions. This is because the p orbital contributions towards bonding are ultimately low and have a low coefficient in most calculated molecular orbitals anyway. The match between LCAO and DFT shows that ignoring some orbitals like 2p orbitals for H is a reasonable assumption.
Ng611 (talk) 16:16, 5 June 2019 (BST) When you say " Even though there are some differences in the sizes of the orbitals", can you be more specific? Do you mean the relative contributions of the two orbitals?
These MO diagrams can be very useful for anticipating electronic properties, chemical reactivity, and spectroscopic behaviour.
NH3 Section
|
Method Used |
B3LYP |
|
Basis Set |
6-31G(d,p) |


Frequency file: JMX_NH3_FREQ_B3LYP_6-31G(D,P).LOG
Optimised NH3 Molecule |
Low frequencies ---   -8.5646   -8.5588   -0.0044    0.0454    0.1784   26.4183
Low frequencies --- 1089.7603 1694.1865 1694.1865
NH3 BH3 Section
|
Method Used |
B3LYP |
|
Basis Set |
6-31G(d,p) |


Frequency file: JMX_NH3BH3_FREQ_B3LYP_6-31G(D,P).LOG
Optimised NH3BH3 Molecule |
Low frequencies ---   -0.0616   -0.0457   -0.0067   21.6898   21.6957   40.5827
 Low frequencies ---  266.0232  632.3610  640.1384
Association Energies
E(NH3)= -56.55776 a.u.
E(BH3)= -26.61532 a.u.
E(NH3 BH3 )= -83.22469 a.u.
ΔE=E(NH3BH3)-[E(NH3)+E(BH3)]= -83.22469 + -83.17309 = -0.05160 a.u. = -135 kJ/mol
The energy calculation makes sense, given the weak nature of the dative bond. However, literature values of the B-N bond energy indicate a value of 378 kJ/mol [3], much higher than the calculated bond strength of 135 kJ/mol obtained during calculations. This discrepancy can be accounted for when considering that the B-N bond is likely to be weak due to dative bonding, where the higher electronegativity of N compared to B causes electron density to be unevenly distributed between the 2 atoms. The energy gap between N and B orbitals as a consequence of the difference in electronegativity also result in a weaker overlap and thus a weaker bond.
The B-N bond length predicted by DFT is 1.668 Å, which is longer than the C-C bond length of 1.54 Å of the ethane isoelectronic analogue of NH3BH3 as stated by Housecroft et. al. [4] This is a good indicator of the weak dative bond between B and N.
Ng611 (talk) 16:17, 5 June 2019 (BST) Excellent calculation, discussion and comparison. Well done!
NI3 Section
[Upload to D-Space unsuccesful, as verfied by demonstrators.]
|
Method Used |
B3LYP |
|
Basis Set |
6-31G(d,p) on N, LanL2DZ on I atoms |
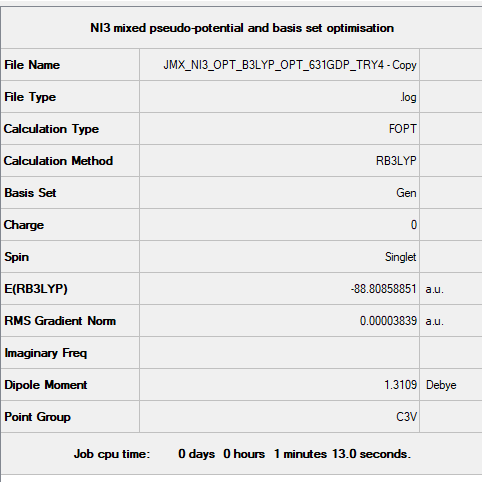
Frequency file: JMX_NI3_FREQ_B3LYP_631GDP_TRY4.LOG
Optimised NI3 Molecule |
 Low frequencies ---  -12.7477  -12.7416   -6.4258   -0.0140    0.0210    0.0991
 Low frequencies ---  101.0290  101.0295  147.4197
The optimised N-I distance is 2.184 Å. NI3 is an explosive crystal that decomposes explosively at standard conditions to give I2 and N2. [5]. The instability of NI3 could be due to the weakness of the N-I bond when compared to elemental iodine and nitrogen.
Lewis Acids and Bases of Main Group Halides Section Done WITH Pseudo Potential Basis Set
Possible Conformers and Symmetry
1) Conformer 1 symmetry: D2h (a)
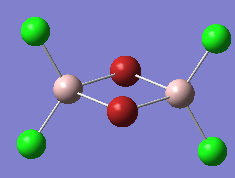
2) Conformer 2 symmetry: C2v

3) Conformer 3 symmetry: C2v
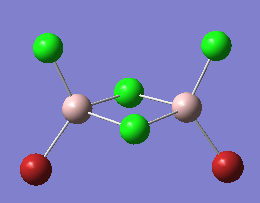
4) Conformer 4 symmetry: C2h (b)
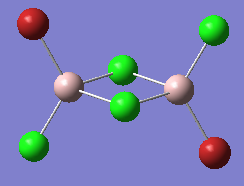
5) Conformer 5 symmetry: C1
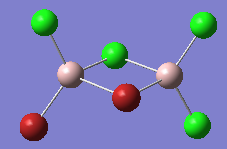
Conformer 1 (a) with 2 Bridging Br Atoms
|
Method Used |
B3LYP |
|
Basis Set |
6-31G(d,p) on Cl atoms, LanL2DZ on Br atoms |
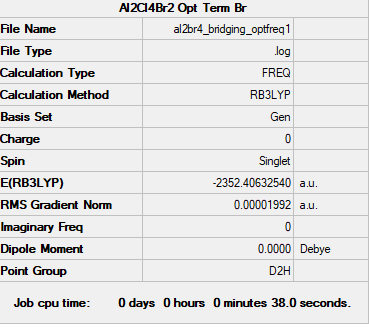
Ng611 (talk) 16:19, 5 June 2019 (BST) Your frequency file's job type should be freq only not opt+freq, to match with your summary table.
Frequency file: AL2BR4 BRIDGING OPTFREQ1.LOG
Optimised Al2Br2Cl4 Molecule |
 Low frequencies ---   -0.8287   -0.5940   -0.0040   -0.0034   -0.0032    1.2941
 Low frequencies ---   16.0540   63.5710   86.0611
Conformer 4 (b) the conformer with trans terminal Br and bridging Cl ions
|
Method Used |
B3LYP |
|
Basis Set |
6-31G(d,p) on Cl atoms, LanL2DZ on Br atoms |
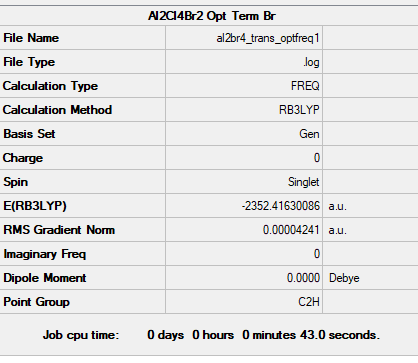

Frequency file: AL2BR4 TRANS OPTFREQ1.LOG
Optimised Al2Br2Cl4 Isomer 4 |
 Low frequencies ---   -1.9401   -1.6403   -0.0038   -0.0023   -0.0013    1.5160
 Low frequencies ---   18.1188   49.1657   72.8937
Comparing the Energies of Conformers 1 and 4
Isomer 4 has lower energy than Isomer 1 since it has reduced steric strain from placing 2 bulky Br atoms as the bridge. This weakens the stability of the bridge since the bond length is now longer and weaker. In addition, the difference in electronegativity between Br and Cl would weaken the bond strength of the bridge. In comparison, isomer 4 places its Cl ligands at the terminal ends trans to each other. This avoids the steric strain from placing the Br atoms in the middle and is the more stable conformation of the two.
energy of isomer 1 = -2352.40633 Hartrees
energy of isomer 2 = -2352.41630 Hartrees
Δ E = 0.00997 Hartree = 26 kJ/mol
Ng611 (talk) 16:21, 5 June 2019 (BST) Good calculation and good discussion!
AlBrCl2 Fragment
|
Method Used |
B3LYP |
|
Basis Set |
6-31G(d,p) on Al, Cl and LAN2DZ on Br atom |


Frequency file: ALCL2BR OPTFREQ1.LOG
Optimised AlCl2Br Fragment |
 Low frequencies ---   -2.2588   -1.7677    0.0014    0.0017    0.0028    3.1957
 Low frequencies ---  120.7411  133.8022  185.6850
Dissociation Energy
energy of AlCl2Br fragment = -1176.19014 Hartree
energy of conformer 4 = -2352.41630 Hartree
energy of dissociation = 2 * -1176.19014 - 2352.41630 = 0.03602 Hartree = 95 kJ/mol
The positive value for the energy of dissociation of Al2Cl4Br2 shows that the dissociation is endothermic and that AlCl2Br fragment prefers to dimerise instead. This is due to the fact that Al is electron deficient with only 6 electrons from the Cl and Br as an AlCl2Br fragment and prefers to form a dimer to alleviate the electron deficiency. The 2 electron 3 center bond in the dimer is more stable and is preferred thermodynamically.
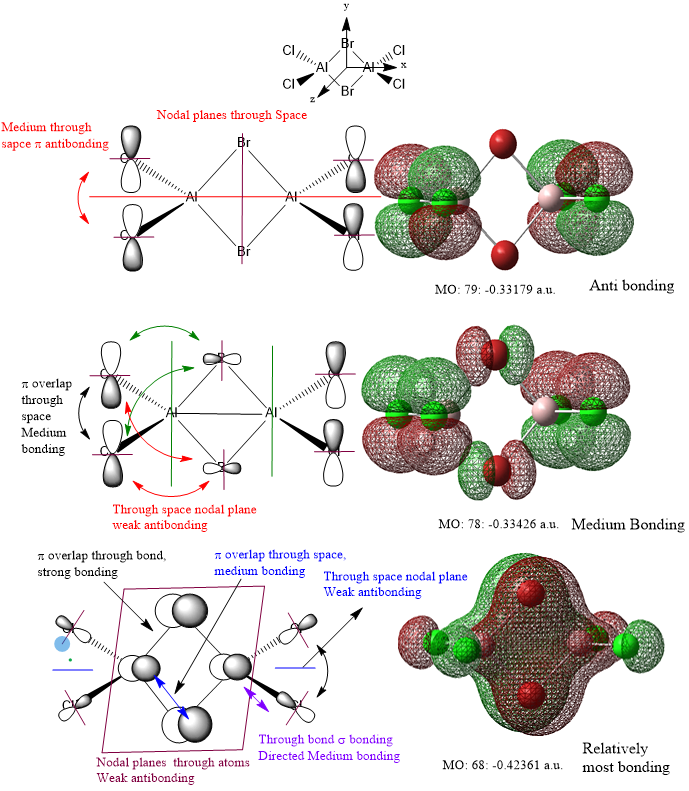
MO diagram of Isomer 4, Lowest energy isomer among the two
Ng611 (talk) 16:23, 5 June 2019 (BST) Excellent analysis!
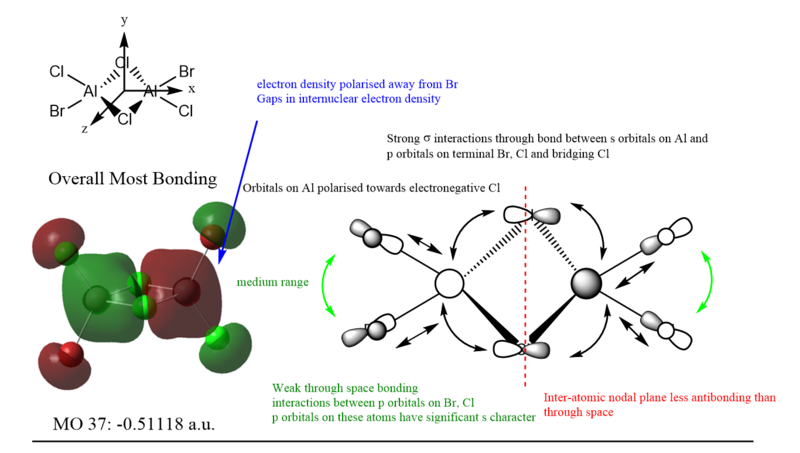
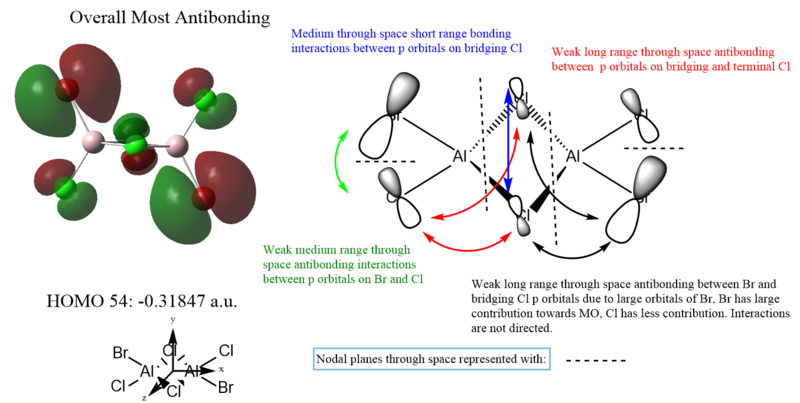
MO 37 was more bonding than MO 40 due to possessing more through bond head on σ bonding interactions than MO 40, which possessed weaker side on π interactions. This can be seen from the lower energy of MO 37 compared to MO 40.
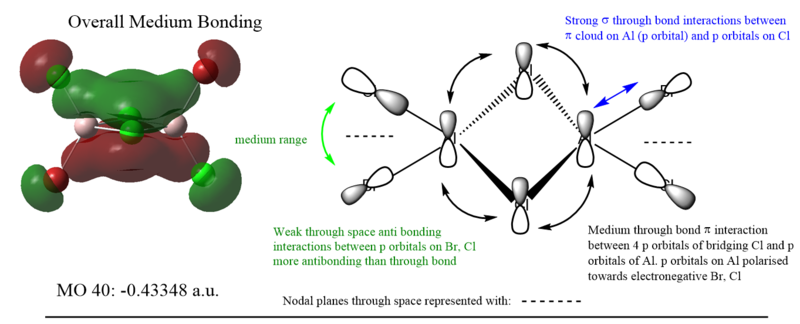
MO 54 is the HOMO, and displayed the most anti-bonding character. Unfortunately, much of the antibonding interactions are through space and are not directed, making it only weakly antibonding overall. More antibonding orbitals are present at higher but unoccupied orbitals and thus are not used for MO analysis.
Most stable Conformer when comparing to all 5 Conformers
(not part of the tasks!) The most stable conformer among the 5 conformers identified earlier is shown below. calculations of 2 other conformers are not posted here due to time constraints.
|
Method Used |
B3LYP |
|
Basis Set |
6-31G(d,p) on Cl atoms, LanL2DZ on Br atoms |
  Low frequencies ---   -0.0032   -0.0025    0.0025    0.5767    0.9748    2.2129
 Low frequencies ---   18.7070   51.2219   72.1983
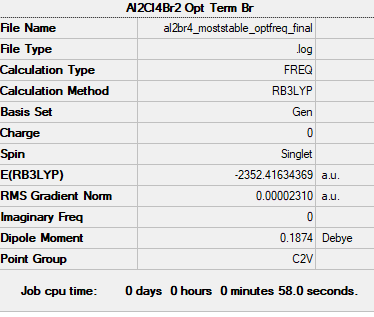
Frequency file: AL2BR4_MOSTSTABLE_OPTFREQ_FINAL.LOG
Optimised most stable Al2Br4 isomer |
Lewis Acids and Bases of Main Group Halides Section Done WITHOUT Pseudo Potential Basis Set
This section was done without using the pseudopotential basis set, and results deviated very significantly from those done using the pseudopotential basis. The most stable conformers would be drastically different without using a different basis for heavier atoms like Br.
1) conformer 1 symmetry: D2h (a)

2) conformer 2 symmetry: C2v

3) conformer 3 symmetry: C2v

4) conformer 4 symmetry: C2h (b)

5) conformer 5 symmetry: C1

conformer 1 (a) 2 bridging Br ions
|
Method Used |
B3LYP |
|
Basis Set |
6-31G(d,p) |

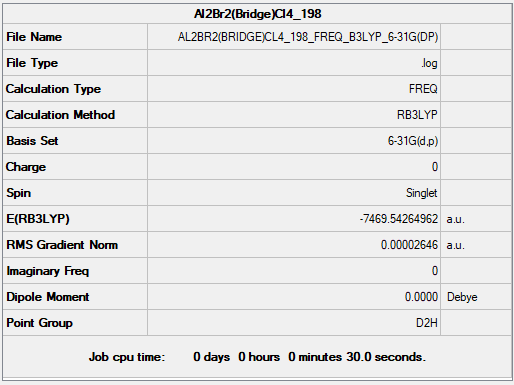
Frequency file: AL2BR2(BRIDGE)CL4 198 FREQ B3LYP 6-31G(DP).LOG
Optimised Al2Br2Cl4 Molecule |
Low frequencies ---   -4.2038   -3.3560   -2.3113   -0.0061   -0.0054    0.0093
 Low frequencies ---   10.7263   65.1624   88.5257
conformer 4 (b) the conformer with trans terminal Br and bridging Cl ions
|
Method Used |
B3LYP |
|
Basis Set |
6-31G(d,p) |

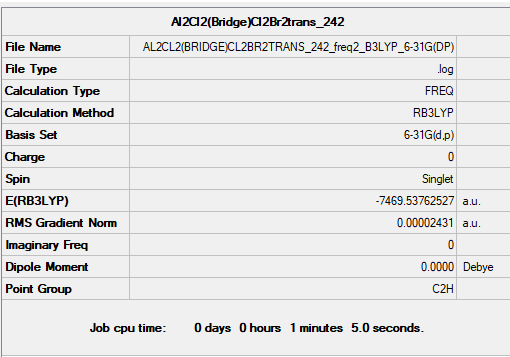
Frequency file: AL2CL2(BRIDGE)CL2BR2TRANS 242 FREQ2 B3LYP 6-31G(DP).LOG
Optimised Al2Br2Cl4 conformer 4 |
Low frequencies ---   -0.0054   -0.0022    0.0118    3.0470    3.0636    8.4517
 Low frequencies ---   15.3121   53.0837   73.8219
Comparing Between 2 conformers
Comparing between (a) 2 bridging Br ions and (b) the conformer with trans terminal Br and bridging Cl ions, the conformer (a) with 2 bridging Br ions has energy: -7469.54265 a.u. and is more stable than conformer (b), with trans terminal Br and bridging Cl ions, which has energy: -7469.53759 a.u.. The difference in energy is 13 kJ/mol. The more stable conformer was wrongly predicted without using pseudo potentials.
AlBrCl2 Fragment
|
Method Used |
B3LYP |
|
Basis Set |
6-31G(d,p) |

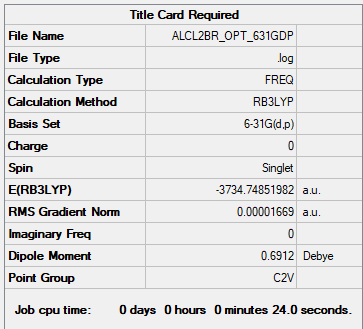
Frequency file: ALCL2BR FREQ 631GDP.LOG
Optimised AlCl2Br Fragment |
 Low frequencies ---   -2.8062   -2.1898   -0.0098    0.0072    0.0080    5.8239
 Low frequencies ---  125.0193  137.5089  194.8968
Dissociation Energy
Energy of 2 x AlCl2Br: 2 x -3734.74852 a.u. = −7469.49704 a.u.
Dissociation energy = −7469.49704 - (-7469.54265) = 0.04561 a.u. = 120 KJ/mol
The product is more stable than the isolated monomers.
MO Diagram of Most Stable Conformer
The relative strength of the bonding or anti-bonding interactions is evaluated by considering the through space/ through bond interactions, σ or π interactions and the distance between interactions. In addition, factors like the orbital size are considered as well. The following guidelines are used to evaluate the strength of the bonding or antibonding character of the interactions.
π interactions are weaker than σ interactions, provided all other factors are kept constant.
Through space interactions are weaker than through bond interactions.
The further the distance between interactions, the weaker the interactions.
Indirect interactions are weaker than direct interactions.
Larger orbital coefficients imply greater contribution to bonding or antibonding in the MO.
Bibliography
- ↑ T. Tague and L. Andrews, Journal of the American Chemical Society, 1994, 116, 4970-4976.
- ↑ Patricia Hunt (2019) Problem Class 1 Model Answer
- ↑ Y. R. Luo, Comprehensive Handbook of Chemical Bond Energies, CRC Press, Boca Raton, FL, 2007.
- ↑ C. Housecroft and A. G. Sharpe, Inorganic Chemistry, Pearson Education Limited, Essex, 2nd edn., 2005
- ↑ I. Tornieporth-Oetting, T. Klapötke, Angew. Chem. Int. Ed. Engl., 1990, 29, 677

