JJR115
The Haber Bosch Process
The Haber-Bosch Process is a nitrogen fixing reaction producing ammonia from nitrogen and hydrogen. The energetics of this reaction can be assessed through the analysis of optimized molecules of N2, H2 and NH3.
NH3 Molecule
Summary Table for NH3 molecule
| Calculation Method | RB3LYP |
| Basis Set | 6.31G(d,p) |
| Final energy E(RB3LYP) | -56.55776873 au |
| RMS Gradient | 0.00000485 au |
| Point group | C3V |
| N-H Bond Distance | 1.01798 Å |
| HNH Bond Angle | 105.741° |
Item Table
        Item               Value     Threshold  Converged?
Maximum Force            0.000004     0.000450     YES
RMS     Force            0.000004     0.000300     YES
Maximum Displacement     0.000072     0.001800     YES
RMS     Displacement     0.000035     0.001200     YES
Predicted change in Energy=-5.986295D-10
Optimization completed.
   -- Stationary point found.
File:JJR115 NH3 OPTIMISATION POP.LOG
Optimized Molecule of NH3
NH3 Molecule |
This is a dynamic image of a molecule of ammonia. Notice the trigonal pyramidal shape due to the presence of a lone pair on the central nitrogen atom. The molecule has a pseudo tetrahedral structure, however the lone pair repel the bonding electron pairs to push them closer together to a 105.741° H-N-H angle.
IR Vibrations Table
Using the 3N-6 rule, you would expect the NH3 to have 6 modes, which is observed in the IR vibrations table above. Modes 2 and 3 are degenerate, and so are modes 5 and 6. The first three modes and bending vibrations and the last three represent higher energy stretching vibrations. Modes 1 and 4 are highly symmetric. Mode number 1 can be called the 'umbrella' mode because it resembles an umbrella being inverted. Four different bands would be expected in an experimental spectrum of gaseous ammonia.
The charge on the nitrogen atom of the ammonia molecule is found to be -1.125. Alternatively, the charge on the hydrogen atoms is 0.375 for each hydrogen. Nitrogen is more electronegative than hydrogen, and therefore carries the negative charge on the molecule.
N2 Molecule
Summary table for N2 molecule
| Calculation Method | RB3LYP |
| Basis Set | 6.31G(d,p) |
| Final energy E(RB3LYP) | -109.52412868 au |
| RMS Gradient | 0.00000060 au |
| Point group | D∞h |
| Bond Distance | 1.10550 Å |
| Shape | Linear |
Item Table
        Item               Value     Threshold  Converged?
Maximum Force            0.000001     0.000450     YES
RMS     Force            0.000001     0.000300     YES
Maximum Displacement     0.000000     0.001800     YES
RMS     Displacement     0.000000     0.001200     YES
Predicted change in Energy=-3.401095D-13
Optimization completed.
   -- Stationary point found.
File:N2 OPTIMISATION JJR115.LOG
Optimized Molecule of N2
N2 Molecule, Bond Order = 3 |
IR vibrations table
As seen in the table the frequency of the IR vibration of N2 is positive and therefore molecule is fully optimized. The molecule has one mode of vibration, following the predicted 3N-5 rule applicable to linear molecules. This molecule is inactive in IR due to an absence of a dipole across the molecule.
H2 Molecule
Summary table for H2 molecule
| Calculation Method | RB3LYP |
| Basis Set | 6.31G(d,p) |
| Final energy E(RB3LYP) | -1.17853936 au |
| RMS Gradient | 0.0000017 au |
| Point group | D∞h |
| Bond Distance | 0.74279 Å |
| Shape | Linear |
Item Table
        Item               Value     Threshold  Converged?
Maximum Force            0.000000     0.000450     YES
RMS     Force            0.000000     0.000300     YES
Maximum Displacement     0.000000     0.001800     YES
RMS     Displacement     0.000001     0.001200     YES
Predicted change in Energy=-1.164080D-13
Optimization completed.
   -- Stationary point found.
Optimized Molecule of H2
H2 Molecule, Bond Order = 1 |
IR vibrations table
One mode of vibration observed at a frequency of 4465.68. The infrared for this is zero because there is no change in dipole across the molecule, so inactive in IR.
Energetics of N2 + 3H2 → 2NH3 Reaction
Energy of the Reaction
| Molecule | Energy |
| NH3 | -56.55776873 au |
| N2 | -109.52412868 au |
| H2 | -1.17853936 au |
Using the above values and the following Hess's law cycle: ΔE = 2*E(NH3)-[E(N2)+3*E(H2)]
| 2 x E(NH3) | -113.1155375 au |
| 3 x E(H2) | -3.53561808 au |
We find ΔE for the production of ammonia in the reaction N2 + 3H2 → 2NH3 to equal -0.05579074 au, or -146.48 kJ/mol.
The product is more stable than the gaseous reactants as the reaction is exothermic, so the reactants release energy to a lower energy state as ammonia.
Chlorine Monofluoride
I have now run an optimization of the Cl-F molecule to analyze the bonding, the molecular orbitals, and the charge distribution across the molecule.
Summary table for ClF molecule
| Calculation Method | RB3LYP |
| Basis Set | 6.31G(d,p) |
| Final energy E(RB3LYP) | -559.94269578 au |
| RMS Gradient | 0.00014211 au |
| Point group | C∞V |
| Bond Distance | 1.66434 Å |
| Shape | Linear |
Item Table
        Item               Value     Threshold  Converged?
Maximum Force            0.000246     0.000450     YES
RMS     Force            0.000246     0.000300     YES
Maximum Displacement     0.000433     0.001800     YES
RMS     Displacement     0.000613     0.001200     YES
Predicted change in Energy=-1.066054D-07
Optimization completed.
   -- Stationary point found.
Optimised Cl-F Molecule
Chlorine Monofluoride, Bond Order = 1 |
Charge Distribution
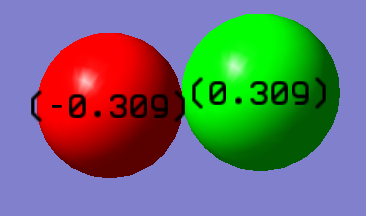
This charge diagram shows the charge distribution across the bond. The -0.309 charge is on the fluorine because it is more electronegative.
IR vibrations table
There is one mode of vibration, following the 3N-5 rule for linear molecules. This stretching vibration occurs at a frequency of 781.00.
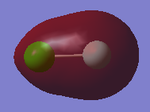
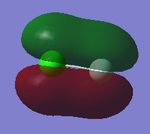
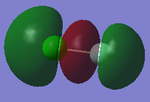
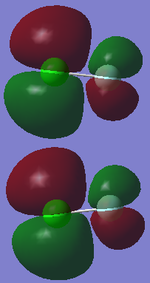
Molecular Orbitals of Chlorine Monofluoride
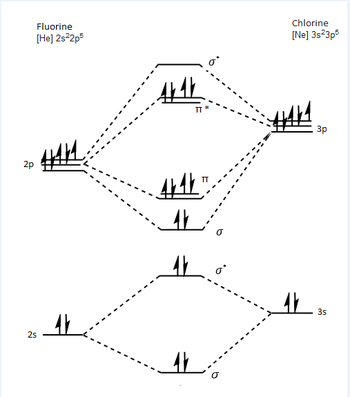
From the above molecular orbital diagram I have drawn it is clear that the bond order is one for ClF. This is because the filled anti bonding molecular orbitals weaken the overlap between the two atoms.


