JJ1516MOY2PRESUBMIT
*** Three asterisks mean check before submission
BH3
Calculation Overview
Data for computational calculations for borane
The following data were obtained using an RB3LYP calculation method with the 6-31G(d.p.) basis set; this followed an initial optimisation calculation using the same method with the 3-21G basis set.
Figure 1 presents the summary table for the data obtained from Gaussview for the frequency analysis performed on BH3. Figure 2 is an excerpt from the .LOG file confirming the convergence of the stated values (confirming a minimum energy structure of BH3/ successful optimisation). ***Figure 3 presents the calculated vibrations for BH3. Figure 4 displays the 3D interactive Jmol rendering for BH3.
Fig. 1 Summary of frequency calculation data
 Item               Value     Threshold  Converged?
 Maximum Force            0.000070     0.000450     YES
 RMS     Force            0.000035     0.000300     YES
 Maximum Displacement     0.000274     0.001800     YES
 RMS     Displacement     0.000137     0.001200     YES
Fig. 2 Confirmation of minimum energy structure
Low frequencies ---  -26.6717  -24.6088  -24.6046   -0.0055    0.1852    0.4508
Low frequencies --- 1162.7586 1213.0226 1213.0253
Fig. 3 Excerpt of "low frequencies" from frequency.LOG file (cm-1)
***HERE BE SPACE FOR YE JMOL FILE
Fig. 4 3D interactive Jmol rendering for BH3
Link to BH3 frequency analysis log file
Molecular Vibrations
The table below presents a summary of the computed vibrational modes for the BH3 molecule. 3N - 6 = 6 (where N = 4) vibrational modes were found, as is expected for a non linear, tetratomic molecule.
| Vibration Number | Vibration Frequency / cm-1 | Absorption Intensity | IR Active | Vibration Type | Symmetry |
|---|---|---|---|---|---|
| 1 | 1162 | 93 | ACTIVE | Angle Deformation | Symmetric |
| 2 | 1213 | 14 | ACTIVE | Angle Deformation | Asymmetric |
| 3 | 1213 | 14 | ACTIVE | Angle Deformation | Asymmetric????? |
| 4 | 2583 | 0 | INACTIVE | Bond Stretch | Symmetric |
| 5 | 2716 | 126 | ACTIVE | Bond Stretch | Asymmetric |
| 6 | 2716 | 126 | ACTIVE | Bond Stretch | Asymmetric |
It has been found that the vibrations numbered 2 & 3 (1213 cm-1) form a degenerate pair of vibrations as do vibrations 5 & 6 (2716 cm-1). These correspond to the absorption of photons of 0.15 eV and 0.34 eV respectively. The calculated intensity of vibration 4 is zero; thus, the vibrational mode is deemed IR inactive. Upon inspection of the molecule animation for this vibration, it was indeed found to be a symmetric bond stretch which resulted in no change in the molecule's dipole moment. Furthermore, the computed IR spectrum (Figure 5, below) shows no absorption peak at 2583 cm-1. Three absorption peaks are visible on the spectrum, corresponding to the three sets of vibration frequencies (since there are two degenerate pairs within the five IR active vibrations).
Fig. 5 Computed IR spectrum
Molecular Orbitals

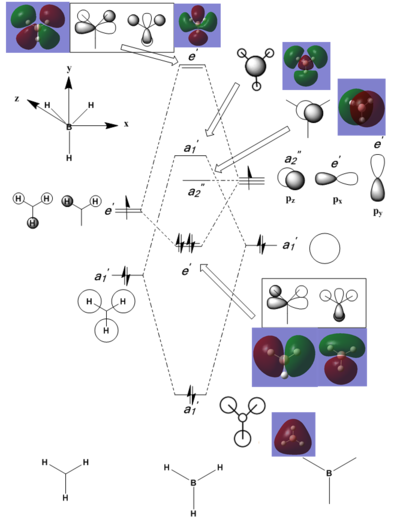
A qualitative molecular orbital (MO) diagram for BH3 is presented (Figure 6, right). The MOs of BH3 have been composed from the valence orbitals of boron and a fictitious H3 symmetry fragment (composed of 3 H atoms). MO theory predicts that some MOs will contribute more significantly to the overall bonding in a molecule; this serves to explain the omission of the occupied yet non-valence orbital of B (the a1', 1s orbital) as its very low energy relative to the fragment MOs shown prevents its involvement in any significant bonding interaction.
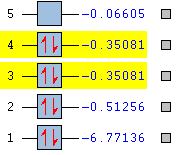
The frequency calculation performed with Gaussian under the specified method and basis set has also provided theoretical MOs for BH3. The comparison of the computed MOs and the qualitative MO diagram enables the determination of the accuracy (and utility) of drawing MO diagrams. Figure 7 presents the computed MOs and their energy in ***eV***.
Fig. 7 Theoretical energy and occupancy of the first 5 MOs of BH3
Figure 7 also shows that the electron occupancy of the energy levels in the computational model agrees with that of the qualitative treatment (filled core MO, all bonding orbitals fully filled, no occupation of non-/anti-bonding MOs).
The first MO (bottom) is significantly lower in energy than the rest (-6.77 eV). This MO is spherically symmetric, has no nodes, overlaps with no other orbitals and is centered on the B atom. Therefore, it is sensible to suggest that this is the B 1s atomic orbital which, as mentioned, is not involved with bonding. The third and fourth computed MOs (highlighted) form a degenerate pair; this agrees with the qualitative treatment of the bonding in BH3 as the third and fourth MOs (e1') on the diagram are found to be degenerate. Figures 8 and 9 juxtapose the theoretical degenerate MOs against the qualitative e1' orbitals as predicted by MO theory.
The above graphics show that the expected regions of increased electron density due to in-phase overlap are indeed predicted by the theoretical calculation. The shape of the theoretical orbitals is well reproduced by the qualitative treatment.
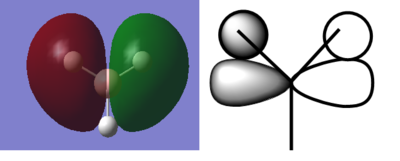
Typically, the HOMO and LUMO govern the reactivity of a molecule; often, particular interest is afforded to these MOs. Below (Figure 10) the theoretical LUMO of BH3 is presented alongside the qualitative prediction.
From the above comparisons, it is clear to see that the MOs produced from the overlap of fragment/atomic orbitals as predicted qualitatively by MO theory are wholly supported by the results of the computational MO calculation. Thus the usefulness of the MO diagram is validated (for small, highly symmetric molecules such as BH3).
H3NBH3
Bonding
Ammonia-borane results from the association of ammonia with borane, an acid base pair (BH3 and NH3 respectively). The bonding in ammonia-borane (H3NBH3) may be rationalised as the donation of a lone electron pair from the N atom in ammonia to the electron-deficient B centre in borane. In other words, a dative covalent bond is formed between N and B. However, it must be said that the idea of dative bonding is merely an aid to equating the total electron count on both sides of the following equation (formation of ammonia-borane): .
The electron distribution about a dative covalent bond is no different and is totally indistinguishable from a conventionally termed covalent bond.
With this model, the computation of the reaction energy is a facile process: the reaction energy will be given by the difference in energy between the products and reactants or the energy of the N-B bond formed. Below, the conditions and results of the frequency analyses of (optimised) NH3 and H3NBH3 are presented. Together with the data acquired for BH3, a reaction energy has been found.
NH3
The following data were obtained using an RB3LYP calculation method with the 6-31G(d.p.) basis set. Figure 11 presents the summary for the frequency calculation for optimised NH3. Figure 12 is an excerpt from the .LOG file confirming the convergence of the frequency calculation. ***Figure 13 presents the calculated vibrations of NH3.
Fig. 11 Summary of frequency calculation data
         Item               Value     Threshold  Converged?
 Maximum Force            0.000006     0.000450     YES
 RMS     Force            0.000003     0.000300     YES
 Maximum Displacement     0.000013     0.001800     YES
 RMS     Displacement     0.000007     0.001200     YES
Fig. 12 Confirmation of minimum energy structure
Low frequencies ---   -0.0138   -0.0032    0.0018    7.0783    8.0932    8.0937
Low frequencies --- 1089.3840 1693.9368 1693.9368
Fig. 13 NH3 vibrations obtained
***HERE BE SPACE FOR JMOL
Fig. 14 3D interactive Jmol rendering for BH3.
Link to NH3 frequency analysis log file
H3NBH3
The following data were also obtained using an RB3LYP calculation method with the 6-31G(d.p.) basis set. Figure 15 presents the summary for the frequency calculation performed on the optimised adduct. Figure 16 is an excerpt from the .LOG file confirming the convergence of the frequency calculation. ***Figure 17 presents the calculated vibrations of H3NBH3.
***Fig. 15 Summary of frequency calculation data
         Item               Value     Threshold  Converged?
 Maximum Force            0.000115     0.000450     YES
 RMS     Force            0.000060     0.000300     YES
 Maximum Displacement     0.000569     0.001800     YES
 RMS     Displacement     0.000345     0.001200     YES
Fig. 16 Confirmation of minimum energy structure
 Low frequencies ---   -0.0250   -0.0031    0.0007   17.1475   17.1498   37.2156
 Low frequencies ---  265.8048  632.2133  639.3570
Fig. 17 *** H3NBH3 vibrations obtained
Fig. 18 *** HERE BEITH YE JMOL 3D interactive Jmol rendering for H3NBH3
Link to H3NBH3 frequency analysis log file
Reaction Energy
As previously stated, the reaction energy (ΔE) is taken to be the energy of the N-B bond present in the adduct product of the ammonia borane association. Thus ΔE is calculable by E(NH3BH3)-[E(NH3)+E(BH3)]. The values of the terms in this equation are presented below: ***uncertainty in Eh = +/- 3.8 * 10-3 -------> 3.808252447
- E(BH3)
- -26.61532360 Eh = -69878.57938447982 kj/mol
- E(NH3)
- -56.55776872 Eh = -148492.52222917063 kj/mol
- E(NH3BH3)
- -83.22468891 Eh = -218506.5685523385 kj/mol
- ΔE = -135.4669386880414 kj/mol
BBr3
Psuedo-potentials and Mixed Basis Sets
Given the presence of the heavy Br atoms in boron tribromide, a revision to the prior calculation method is needed. In Br, a large number of electrons occupy several atomic orbitals from n =1 to n = 4 (where n is the principal quantum number). *** *** ***At low n, the electrons penetrate into the "core" region of the atom and a strong electrostatic interaction due to the nuclear charge. Owing to their low energy, these electrons are mostly uninvolved in chemical bonding. However, these electrons do screen the electrons residing in atomic orbitals of high n, causing them to experience a decreased, effective nuclear charge. In the calculation of a chemical system, it is sufficient to apply to these core Br electrons a pseudo-potential or effective core potential while the 6-31G basis set is applied to the higher energy, bonding electrons. The pseudo-potential is also able to account for the relativistic effects present within the atom which arise as the core electrons approach relativistic speeds (in atoms of high atomic number/nuclear charge). In the lighter B atom, the aforementioned effects are insignificant. As a result, applying the more computationally complex method and basis set to the Br atom while retaining the 6-31G basis set for B enables an increase in accuracy with less of an increase in computational expense. This application of a mixed basis set promotes manageable and practical calculation times.
Calculation Overview
The following data were obtained using an RB3LYP calculation method with the 6-31G(d.p.) basis set for the B atom and a LANL2DZ basis set for the Br atom.
Figure 19 presents the summary for the frequency calculation performed on the optimised BBr3 molecule. Figure 20 is an excerpt from the .LOG file confirming the convergence of the frequency calculation. ***Figure 21 presents the calculated vibrations of BBr3 while Figure 22 presents a 3D interactive rendering of the molecule.
Link to BBr3 frequency analysis log file


