JIR1501069122
H + H2 system
Dynamics from the transition state region
The value for the total gradient of the potential energy surface is 0 in both cases, the former being a minimum, the latter a saddle point.
Locating the transition state
The location of the transition state can be found at a bond distance of r1 = r2 = 0.9077 Å. The following graph (Internuclear distance vs time) supports this assertion by showing a perfectly straight line with no oscillations, indicating that the transition state is a minimum.

Trajectories when r1=rts+δ, r2=rts
As the mep only follows the lowest energy path, it does not show molecules oscillating, instead showing a straight line. This is due to the lack of energy change between translational and vibrational bonds.
The final values reported for the positions are r1=0.749 Å and r2=372.6 Å, while the momenta are p1=1.248 and p2=2.482.
Reactive and Unreactive trajectories
The main assumption in the transition state theory is the uniqueness of the reaction pathway, that the reaction is near equilibrium and that Boltzmann distribution is what guides the reaction.[1] At high temperatures, that theory fails to explain phenomena like recrossing. In addition to that, the effect of tunneling increases the experimental values[1], which may occur due the low masses involved in the reaction.
F - H - H system
One of the reactions (F+H2) is exothermic, while the other (H + HF) is endothermic. The graph displays this by showing the potential energy surface in the first case decrease (i. e. reagents having more energy than products), while in the second case the surface increases. H-H has a lesser bond strength than F-H, so when the F-H bond is formed, the energy released will be significantly higher than the energy needed in the breaking of the H-H bond
Dynamics from the transition state region
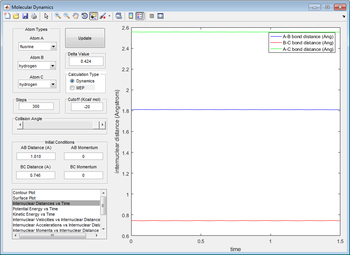
The transition state is located at positions r1 = 1.810 Å, r2 = 0.746 Å. Again, it can be proved by plotting internuclear distance vs time, which shows that there are no oscillations:
Reaction dynamics
For the H+HF reaction, the activation energy is 0.2 kcal/mol. The F+H2 reaction has an activation energy of 30.2 kcal/mol. In both cases, it is the difference between the transition state energy and the lowest energy at the start of the reactions (-103.7+103.9 in the first case, -103.7+133.9 in the second).
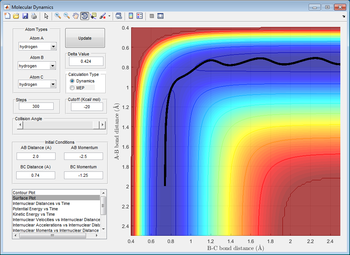
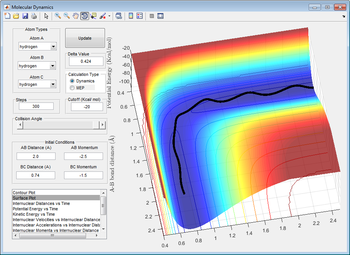
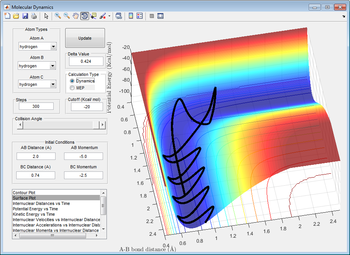
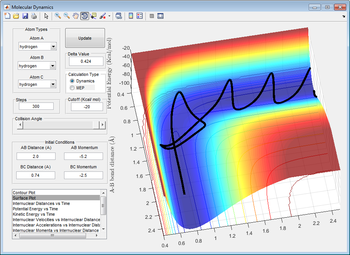
If a set of pre existing conditions is set (r1=0.74 Å and r2=2.5 Å, p2=-2), the reactive reaction can occur when the other momentum value is in the range -0.6 - 1.66. Translational energy becomes vibrational energy. There is a decaying process that affects the excited vibrational states, and that released energy is what breaks the bonds. Thus, the emission spectra of reagents and product should show a difference in the intensity, number and location of peaks.[2]
Polanyi's rules
According to Polanyi's rules, early transitions states are better reached with translational energy, while vibrational energies are better suited for late transition states.[2] Thus, if the reaction has an early transition state, it will run faster if the translational modes are correctly distributed, while for the case of a late transition state, it is the vibrational modes the ones that should be favoured in the distribution.

