JGH116
Molecular Reaction Dynamics
Introduction
Jas213 (talk) 14:02, 28 May 2018 (BST) Amazing that you incorporated the first question into an introduction to your report. Good referencing style, good that you gave the equations. By modelling the relative motion of atoms, it is possible to simulate the chemical reactions they undergo. The motion of the atoms depend on their interactions, which can be modelled as potential energy curves (e.g. Lennard-Jones potential, Morse potential) in one dimension. By superimposing two orthogonal potential energy curves, a potential energy surface (PES) is formed.
For a triatomic system,
e.g.
the PES can be described mathematically as V(rAB, rBC), where rAB and rBC are the different internal coordinates of the atoms relative to the central atom. An example of a triatomic system used in this report, H + H2 is shown below:

From the PES, a 'reaction trajectory' can be found. This is the 'path' along the surface the reaction follows. There are two 'channels' through which the reaction trajectory passes through - the reactant (entrance) channel and the product (exit) channel. Joining the two channels is the transition structure. The transition structure describes the transition state for a reaction, and is defined as the maximum on the minimum energy path linking the reactant and product channels. It is seen on the PES as a saddle point. For a surface described by the function V(rAB, rBC), the saddle point can be found using the partial derivatives of the function and the determinant of the Hessian matrix.[1] For a given set of coordinates, when the partial derivatives of the PES with respect to rAB or rBC is equal to zero, or the determinant of the Hessian Matrix is less than zero,[2] the given coordinates describe a saddle point:
Minima on the PES can also be found through a similar procedure:
- or
H + H2
Locating the transition state
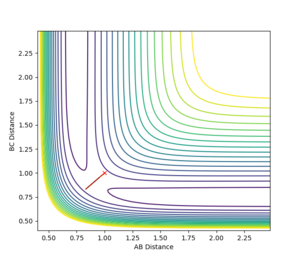
The H+H2 system is symmetrical, so the transition state of the reaction would look similar to a linear triatomic molecule. The bonds themselves are half-formed/half-broken, resulting in equal internuclear distances, i.e. rAB = rBC = rTS where rTS is the intermolecular distance at the transition state.
H1 + H2-H3 → H1--H2--H3 → H1-H2 + H3
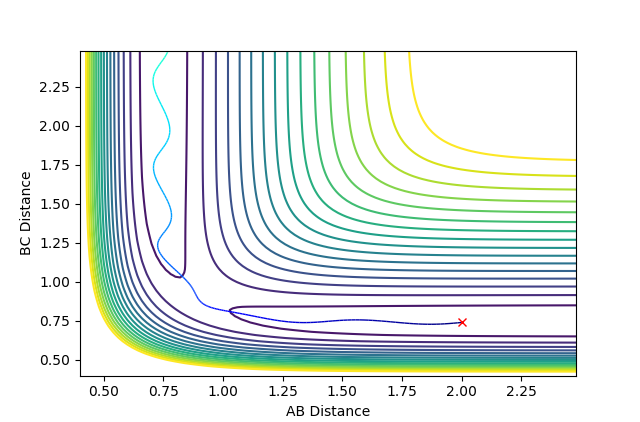
Therefore, by forcing the internuclear distances to be as above, the system should rest perfectly on the ridge of the transition structure. If the initial internuclear distances are set to be greater or smaller than the transition state internuclear distance, i.e. (rAB = rBC) < rTS or (rAB = rBC) > rTS, and there is no momentum in either direction of the reaction, i.e. pAB=pBC=0, then the system will oscillate perfectly about r_TS on the transition structure, as seen in figure 2.
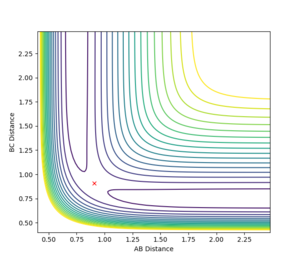
It is therefore possible to approximate a value of rTS by finding the internuclear distance where there is no oscillation along the transition structure. This was found to be at approximately r_TS = 0.9077 Å. Plotting an internuclear distance vs. time graph confirmed this, as there was no oscillation in the internuclear distances with time. Figure 3 shows the location of the transition state on a contour plot and figure 4 shows how the internuclear distances vary with time.

Having located the transition state, the initial positions were changed such that rAB≠rBC. Instead, the following initial conditions were imposed:
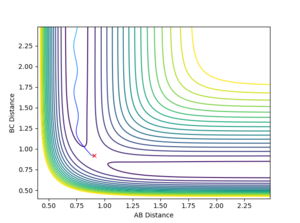
where δ = 0.01 Å . The resulting trajectory is one that leads down the product channel, i.e. towards H1 + H2-H3, as in figure 5.
If the initial conditions were changed to the following:
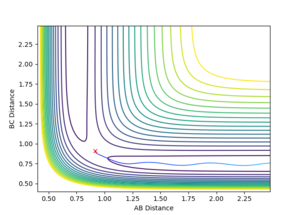
where δ = 0.01 Å , then the resulting trajectory would lead down the reactant channel, i.e. towards H1-H2 + H3, as in figure 6.
Comparing the internuclear distances vs time and the internuclear momenta vs time plots of the two different sets of conditions in figure (X), it can be seen that the graphs are the same, except the atoms involved are switched. In the first set of conditions the resulting hydrogen molecule is made from H2 and H3, however in the second set of conditions, the resulting hydrogen molecule is made from H1 and H2.
Very detailed descriptions, many plots illustrating your reasoning. I like that you explicitly state your conditions used.
Reaction Paths: MEP vs Dynamics
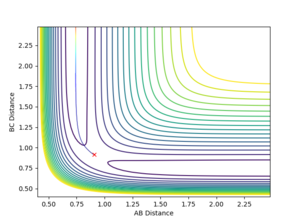
The minimum energy pathway (MEP) is the lowest energy path which the reaction trajectory takes. It has the property that any point along it is an energy minimum in all directions perpendicular to the path. Hence, it falls off to a minimum along the steepest path, i.e. where there is the fastest decrease in energy. This is calculated by running a trajectory that corresponds to infinitely slow motion. This condition is created by resetting the velocity to zero for every time step of the simulation. For the system described here, and the initial conditions:
where Å, the MEP was calculated, and can be seen in figure 7.
Contrary to the MEP calculation type, the Dynamics calculation does not reset the velocity to zero at each time step, allowing the calculation to be influenced by inertia, making the path travelled oscillate, and hence give a more realistic account of the motion of the atoms in the reaction.
Reactive and Unreactive Trajectories
A trajectory can be considered as reactive if it starts in the 'reactants' channel, passes through the transition state, and ends in the 'products' channel. It has been previously calculated that reactive trajectories have the following conditions:
- Å
- Å
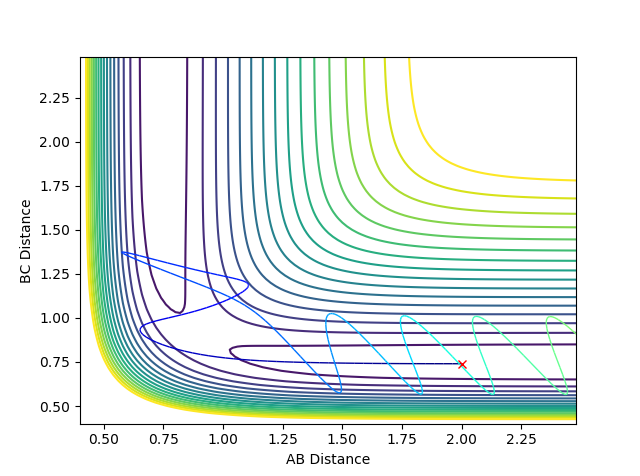
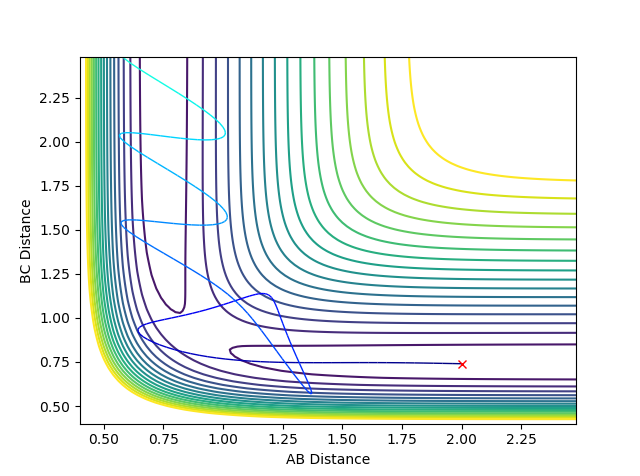
Unreactive trajectories are ones which begin in the reactive channel and end in the reactive channel. These can sometimes cross the transition state and enter the product channel, only to 'bounce' back out into the reactant channel. A number of combinations of internuclear momenta were tested, while maintaining the initial internuclear distances stated above. The red cross on the plots indicate the starting position of the trajectory.
Jas213 (talk) 14:06, 28 May 2018 (BST) Excellent that you stated the initial conditions and what you actually mean by unreactive and reactive. Very good intro to the "computational experiment" performed in the following table.
Jas213 (talk) 14:11, 28 May 2018 (BST) The penultimate case is an example of recrossing. You describe the distance vs. time plot, but you don't provide it. You mention proportions of kinetic energy, but without stating the kinetic energy (only total) nor referring to one of the two momenta. An overall concluding comment on what you learned from this table would have been expected.
Transition State Theory
By using transition state theory, Chemists gain a valuable insight into the dynamics of chemical reactions. The theory states that for a reaction to occur, the reaction trajectory must pass through the transition state between the reactants and the products. Rates of reaction can also be predicted using transition state theory. The activation energy of a reaction is calculated by the difference in energy between the transition state and the reactants. By using the activation energy in conjunction with the Arrhenius equation:
where is the rate of reaction, is the pre-exponential coefficient, is the activation energy, is the gas constant and is the temperature of the system, a rate of reaction can be calculated.
However, transition state theory does have its limitations. The theory makes a number of assumptions:
- Intermediates in reactions are long-lived enough to reach a Boltzmann distribution of energies before progressing to the next step in the reaction. However, if the intermediates are short-lived, the theory breaks down.
- Nuclei behave according to classical mechanics. Classically, the system requires enough energy to reach the transition state, before falling towards the products. However, quantum effects, such as tunnelling, may play a part. If the system is able to tunnel through the energy barrier created by the transition state, then the theory breaks down.
- High temperature reactions can often cause the theory to fail. The theory assumes that the trajectory will pass through the lowest energy transition state on the PES. By the introduction of more energy, higher vibrational modes can be occupied, causing a more complex trajectory, possibly crossing into the products through transition states higher in energy. Therefore, the theory can break down.
Jas213 (talk) 14:13, 28 May 2018 (BST) Where are your references?!?! What about the fact that TST assumes that once the TS has been reached, the system proceeds to form products. This is in contradiction with the penultimate case in your table and should have been pointed out.
F - H - H
This system is asymmetric, and so can describe two different reactions, denoted here by a reversible arrow:
Inspection of the PES
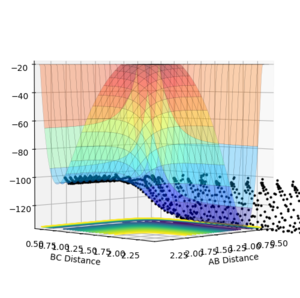
Previously, the PES was symmetrical, and so a contour plot was sufficient to analyse the system. However, this reaction is asymmetric, and so a surface plot of this system is more appropriate.
By comparing the energy of the reactants and products, it is possible to classify the above reaction as exothermic or endothermic. Figure 8 shows a reactive trajectory along the PES for the forward reaction (F + H2) with initial conditions:
- rFH = 2.3 Å
- rHH = 0.74 Å
- pFH = -1
- pHH = 1.5
This clearly shows the products are lower in energy than the reactants. Therefore, the reaction between F and H2 is exothermic.
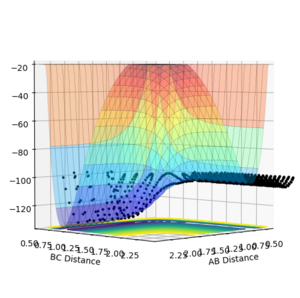
It would therefore be safe to assume the backward reaction is endothermic. However, to ensure this, the PES for the backward was calculated. Figure 9 shows a reactive trajectory along the PES for the backward reaction (H + HF) with initial conditions:
- rHH = 2.3 Å
- rHF = 0.74 Å
- pHH = -1
- pHF = 1.5
This clearly shows the products are higher in energy than the reactants. Therefore, the reaction between H and HF is endothermic.
This energetic information for these reactions give some insight into the bond strengths involved. As the reactions involve the breaking/forming of an H-H bond and the forming/breaking of an H-F bond, the two bond strengths can be compared. As the forward reaction is exothermic, it can be concluded that the H-F bond is stronger than the H-H bond. This agrees with the idea that the Fluorine atom is very electronegative, creating a strong dipole and giving the bond more ionic character.
Locating the transition state

The transition state is the point on the PES where the system remains without falling into either of the product or the reactant channels. As this system is asymmetric, finding the transition state is not as easy as setting rHH=rHF=rTS. The transition state here can be considered the point just before the surface dips into the lower energy channel, as denoted by the dot in figure 15:
By reading off the axes, an initial 'guess' for the positions was made. By adjusting the position values until the trajectory remained constant instead of falling into the product or reactant channels, coordinates for the transition state were found.
For the transition state, rHH ≈ 0.745 Å, rHF ≈ 1.8107 Å. Knowing the position of the transition state allows the calculation of the energy of the transition state, which in turn is able to provide information about the activation energy, if provided with the energy of the reactants. At the specified coordinates, the energy is -103.752 kcal/mol.
The energy of the reactants is the lowest energy minimum in the reactant channel. For the backward reaction (H + HF), the energy of the reactants is -134.025 kcal/mol. The difference between this is the activation energy. This is calculated to be 30.273 kcal/mol, which, when converted to kJ/mol gives an activation energy of 126.662 kJ/mol.
For the forward reaction (F + H2) the energy of the reactants is -104.010 kcal/mol. The difference between this is the activation energy. This is calculated to be 0.258 kcal/mol, which, when converted to kJ/mol gives an activation energy of 1.079 kJ/mol.
Jas213 (talk) 14:16, 28 May 2018 (BST) You obtained the correct Ea values, however you didn't follow the approach asked for in the questions. Where are your MEP plots, in which you ensure you measure the energies along the minimum energy path?
Reaction Dynamics

For the reaction F + H2, the following initial conditions produced a reactive trajectory, shown in figure 11:
- rFH = 2 Å
- rHH = 0.745 Å
- pFH = -1
- pHH = 0.5
The energy of the products of this reaction is significantly lower than the reactants - as shown previously, this reaction is exothermic. The amount of energy released can be calculated from the difference in energy between the products and reactants. This is calculated to be 30.015 kcal/mol, which when converted to SI units gives 125.58 kJ/mol of energy released in this reaction. This energy is most likely to be converted into kinetic energy of the particles. The increase in kinetic energy leads to an increase in the temperature of the system. Therefore, experimentally, the change in temperature of the system can be used to measure the energy released. Therefore, the experimental technique of calorimetry can be used.
For the forward reaction, F + H2, the following initial conditions were set:
- rFH = 2 Å
- rHH = 0.74 Å
- pFH = -0.5 kgm/s
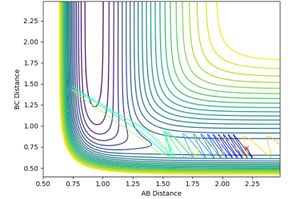
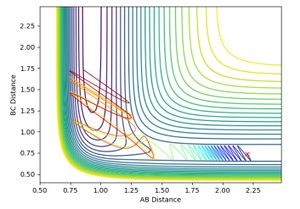
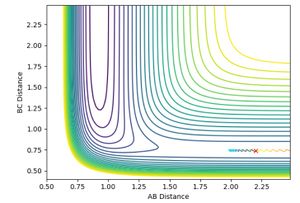
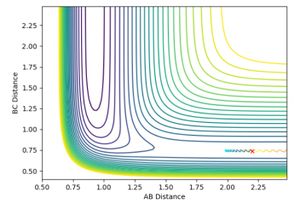
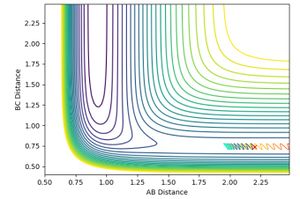
and pHH was allowed to vary between -3 and +3. Contour plots for the trajectories are summarised below in figures 12-20. For trajectories within the range -1 <pHH < 1, it was found that there was not enough momentum, and hence not enough energy for the system to reach the transition state. Therefore, the products were not formed. For pHH outside of this range, it was found that there was enough energy to cross the transition state. However, due to excess energy, and the asymmetric PES, re-crossing of the transition state was observed.
Jas213 (talk) 14:19, 28 May 2018 (BST) Lots of plots, but little description, which plot are you referring to in your last sentence here? If you look closely, then you notice that both the -3, the +2 and +3 recross and go back to reactants. Your observation is incorrect.
 |
 |
 |
 |
 |
 |
 |
 |
 |
Distribution of energy and efficiency of reaction
The position of the transition state relative to the reactants and products greatly affects the distribution of energy between different modes (translational and vibrational, for example).
For an early transition state, its energy is much closer to that of the reactants than the products. For a reactive trajectory, this often results in high vibrational excitation of the product. However, for a late transition state, its energy is much closer to that of the products, and so high vibrational excitation of the product is not favoured. Due to the conservation of energy, vibrational energy in the product is converted from translational kinetic energy in the reactants, and vice versa. This implies that for different locations of the barrier, energy is distributed between vibrational and translational differently to ensure a reactive trajectory.[3]
How this energy is distributed, along with the efficiency of the reaction can be characterised by Polanyi's empirical rules.
Polanyi's rules

For a given type of reaction (exothermic/endothermic) the position of the transition state, and therefore the energy barrier, affects how the energy is distributed between vibrational energy and translational energy.

An early barrier is most easily crossed if the energy is in the form of translational energy. The higher the vibrational energy, the less effective the trajectory is at crossing the barrier, and therefore the reaction is less efficient.
A late barrier is most easily crossed if the energy is in the form of vibrational energy. The higher the translational energy, the less effective the trajectory is at crossing the barrier, and therefore the reaction is less efficient. [4]
Polanyi's rules can be shown for the F-H-H system.
The forward reaction, F + H2 has an early barrier, and so a low vibrational energy and a high translational energy is preferred. By setting the momentum of the H-H bond (pHH) to be low, and the momentum of the F atom towards the H2 molecule to be high, it can be seen that the trajectory is reactive. Here, the initial conditions are:
- rFH = 2 Å
- rHH = 0.74 Å
- pFH = -9
- pHH = 0.1
The backward reaction, H + HF has a late barrier, and so a high vibrational energy and a low translational energy is preferred. By setting the momentum of the H-H bond (pHF) to be high, and the momentum of the H atom towards the HF molecule to be low, it can be seen that the trajectory is reactive. Here, the initial conditions are:
- rHH = 2 Å
- rHF = 0.9 Å
- pHH = -3
- pHF = -12
Jas213 (talk) 14:22, 28 May 2018 (BST) Good that you explain and illustrate Polanyi's rules.
References
- ↑ International Union. col (saddle point). IUPAC Gold Book - capillary condensation Available at: https://goldbook.iupac.org/html/C/C01145.html. (Accessed: 4th May 2018)
- ↑ Binmore, Ken; Davies, Joan (2007). Calculus Concepts and Methods. Cambridge University Press. p. 190. ISBN 978-0-521-77541-0. OCLC 717598615.
- ↑ Steinfeld, J. I., Hase, W. L. & Francisco, J. S. Chemical kinetics and dynamics. (Prentice Hall, 1999). p. 297-299
- ↑ Steinfeld, J. I., Hase, W. L. & Francisco, J. S. Chemical kinetics and dynamics. (Prentice Hall, 1999). p. 297-299


