JEL3117 MolecularReactionDynamics
Introduction to Molecular Reaction Dynamics
Potential Energy Curve
The relative motions of the atoms in a molecule can be described by using an anharmonic oscillator which is derived from a simple harmonic oscillaton. The potential energy curve shows how the potential of the molecule (ex. diatomic molecule) changes as the nuclei are displaced from the equilibrium position which is located at the minimum point of the potential curve. In the diatomic case, the potential energy of the molecule increases exponentially as the separation between the nuclei decreases. As the distance between the nuclei increases, the potential energy of the molecule increases until it reaches the plateau. The difference between the energy of the plateau and the energy of the equilibrium position is the dissociation energy. When the separation is really small, the oscillator follows the simple harmonic oscillator but as the nuclei are further apart, they deviate from the ideality more and follows the anharmonic oscillator.

Exercise 1 : H + H2 System
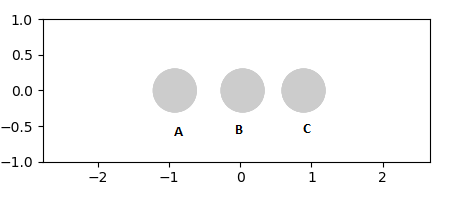
In order for H2 to react with H, the H atom should approach to the H2 with a sufficient amount of energy to overcome the activation energy. At the initial condition where time = 0. the bond distance between B and C is represented as r2 and the distance between A and B is represented as r1 as shown in the diagrams below

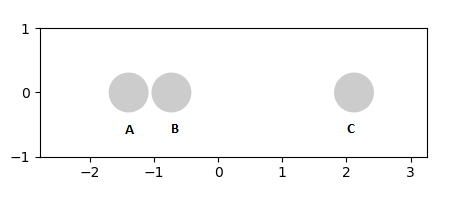
For the transition state of a symmetric molecule, r1 and r2 should be equal. If there is a sufficient energy to overcome the activation energy, A and B will form a new bond and C will move away as shown above in figure 3.
Defining transition state in a potential energy surface diagram
On a potential energy surface diagram, the transition state is mathematically defined by:
All three equations above should be satisfied to identify the transition state. The first condition states that the product of the first derivative of the potential energy with respect to r1 and the first derivative of the potential energy with respect to r2 should be zero. The second condition states that the second derivative of the potential energy with respect to r1 should be less than zero (meaning maximum point). The third condition states that the second derivative of the potential energy with respect to r2 should me more than zero (meaning minimum point). Thus, the transition state is defined as the maximum point on the minimum energy path linking reactants and the products.
This is a really good description. You did not need to include the extra introduction but it is clear that you understand the theory behind the exercise, which is good. Rk2918 (talk) 11:06, 28 May 2019 (BST)
The transition states are graphically represented below.
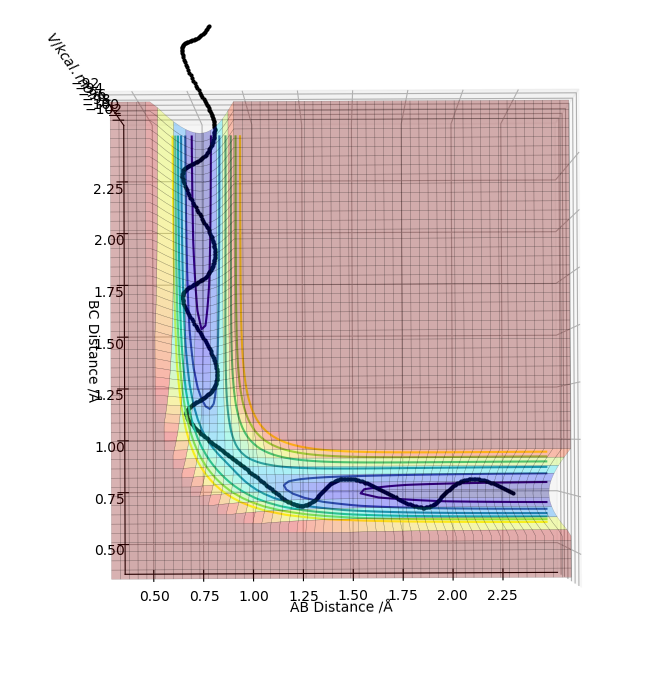
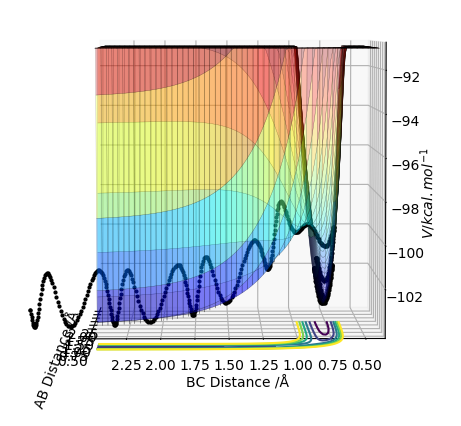
The transition states can be distinguished from a local minimum of the potential energy surface because at the local minimum the second derivative of the potential energy with respect to one of the distances would not give positive value (not a maximum point).
Trajectories from r1 = r2: locating the transition state
The estimated distance transition state position rts is 0.908 Å and this can be shown by "internuclear Distance vs Time" plot as shown below
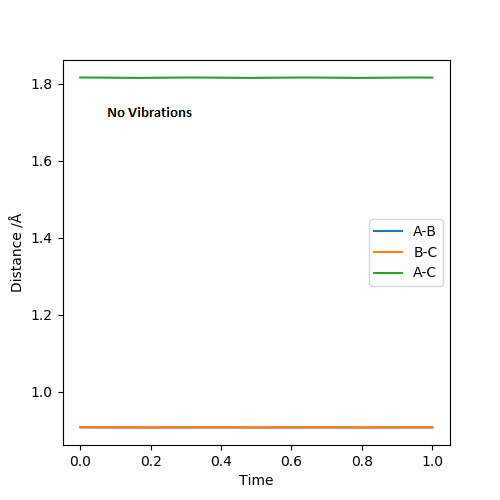
At the transition state, I expect the the atoms to vibrate minimum near to zero because the transition state is the stationary maximum point on the minimum energy path. As the they vibrate more and more, they will slide down the potential surface curve and separate to form either product or reactant.
Trajectories from r1 = rts + δ, r2 = rts
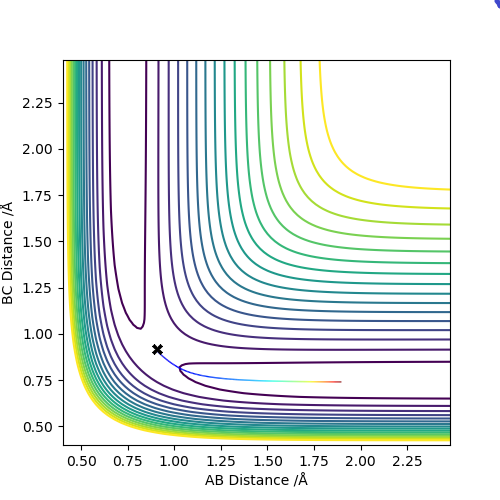
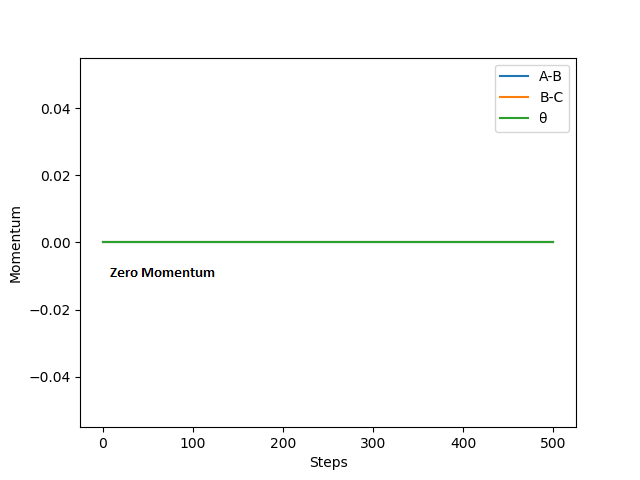

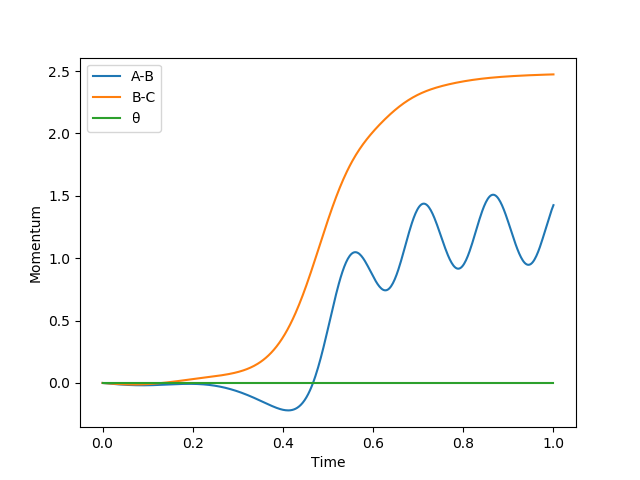
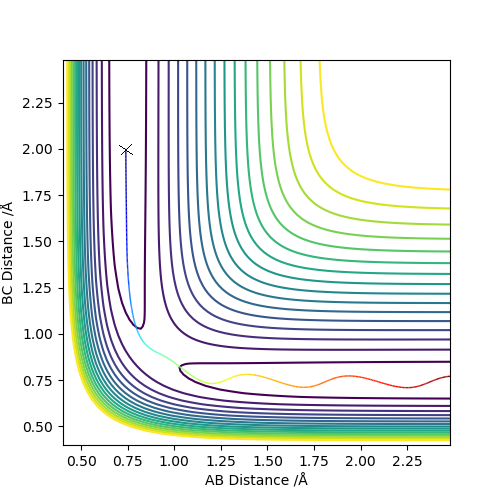
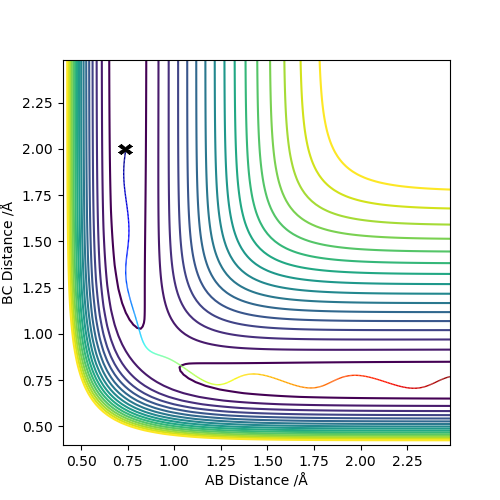
The above graphs were plotted by setting r1 = 0.909 Å and r2 = 0.908 Å and p1 = p2 = 0 kg m/s.
the first two graphs show the reaction path of the reaction with the MEP mode. MEP sets the momenta and velocities of the molecule to zero (shown in figure 9) in each time every step and process the reaction in a infinitely slow motion. The last two graphs show the reaction path of the reaction with the dynamics mode. Dynamics shows the vibrational motion of the molecule which is derived from the internal energy of the molecule. Thus, oscillation of the energy of the reaction path is shown in the potential energy surface. By setting the momentum to zero at every point, the reaction path will stop when the exchange of the atoms is completed. However, when the momentum is not zero, the products will move away from each other continuously due to conservation of momentum. This is shown in figure 8 and 10 where the reaction path ends earlier for MEP than Dynamics.
If r1 = 0.908 Å and r2 = 0.909 Å, A and B would form the H2 molecule and C would move away from the molecule. Thus, the reaction path would head towards the other end of the contour plot.
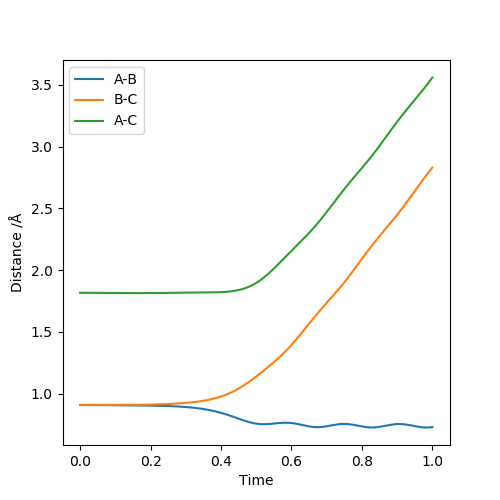

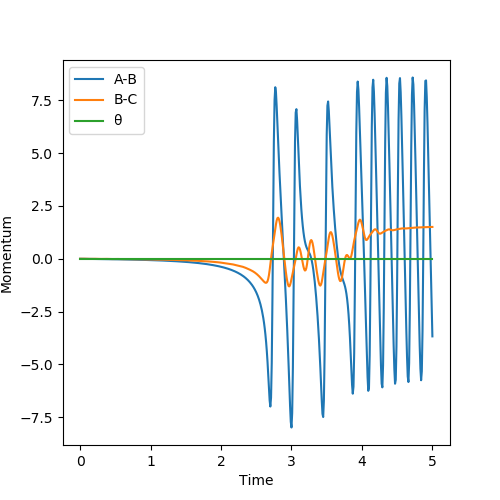
Figure 12 shows that the distance between B and C increases but the distance between A and B decreases with a little oscillation. Moreover, Figure 13 shows that the momentum of BC increases then reaches the plateau which means that the B and C are separated and the momentum of AB increases then start to oscillate as it plateaus. It means that AB bonds are formed and they are oscillating. Thus, the above data supports that AB bond is formed instead of BC bond when r1 and r2 are reversed
Reactive and unreactive trajectories
From the table, it can be concluded that activation energy is not the only factor that affects the success of the reaction but other factors such as collision in a correct geometry also contributes to the success of the reaction.
OK, this is the right idea - total energy isn't enough to dictate whether or not a system will be reactive. However, where have you got this idea of geometry from? It's true that geometry can affect reaction success but your table doesn't show this. You either need to explain what you mean if this is from your own scientific instinct or you need to cite a literature reference. Rk2918 (talk) 11:13, 28 May 2019 (BST)
Transition state Theory
The main assumptions of transition state theory are as follows[2] :
1, For each elementary step in a multi-step reaction, the intermediates are long lived enough to reach a Boltzmann distribution of energies before proceeding to the next step.
2, The atomic nuclei behave according to the classic mechanics.
3, The reaction is successful if the reaction path passes over the lowest energy saddle point on the potential energy surface (transition state).
However, in reality, the assumptions start to break down. The transition states are very short lived and the Boltzmann distribution of energies at each step near activated complexes is hard to be obtained. Moreover, in reality, atoms behave in a quantum mechanical manner and the reaction might be successful to form the product even though the energy of the reactants is not enough to overcome the activation energy via quantum tunnelling. Moreover, in reality, the transition state is not necessarily at the lowest saddle point at high temperatures. Thus, there are alternative pathway to the reaction.
As a result, the predicted reaction rate values by using Transition State Theory would be lower than the experimental values due to limitations of the assumptions.
You are very close to the right idea in point 3 but you haven't quite followed the thought through to completion. This assumption (point 3) means that TST does not account for the idea of barrier recrossing. I.e. in TST once a molecule has hit the TS, that's it, the reaction is successful. In reality, the molecule can go back to the reactants side, and then over the TS to the product side, and dance around over the TS for a bit. This means that TST predicts that the rate from TST would be higher than in real life (reaction occurs quicker) as it doesn't account for this extra time spent at the TS. So TST overpredicts the rate constant.
Also note that tunelling is not accounted for in this experiment, and also tunneling would accelerate the reaction relative to theoretical prediction (no tunneling) and therefore would have the opposite effect to the barrier recrossing scenario. Rk2918 (talk) 11:22, 28 May 2019 (BST)
Exercise 2 : F - H - H system
PES inspection
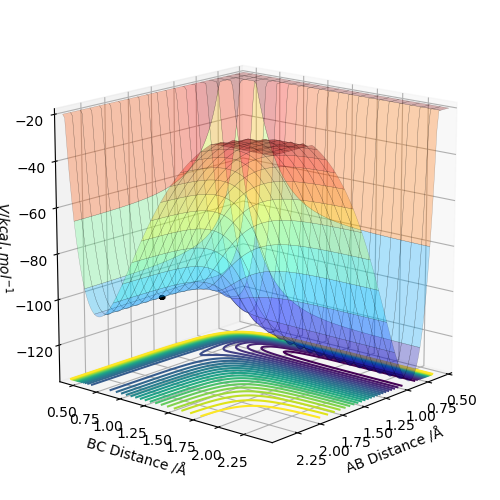
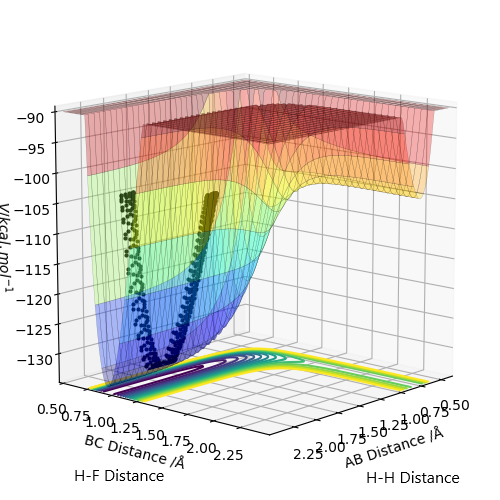
Based on the potential energy surfaces, the F + H2 reaction is exothermic because the energy of the reactant is higher than the energy of the product and the H + HF reaction is endothermic because the energy of the product is higher than the energy of the reactant.
This means that the bond strength of H2 is weaker than the bond strength of HF because the energy released from breaking H-H bond is lower than the energy required to form the H-F bond for the endothermic F + HF reaction and the energy released from breaking H-F bond is higher than the energy required to form the H-H bond for the exothermic F + H2 reaction .
Approximate Position of the transition state
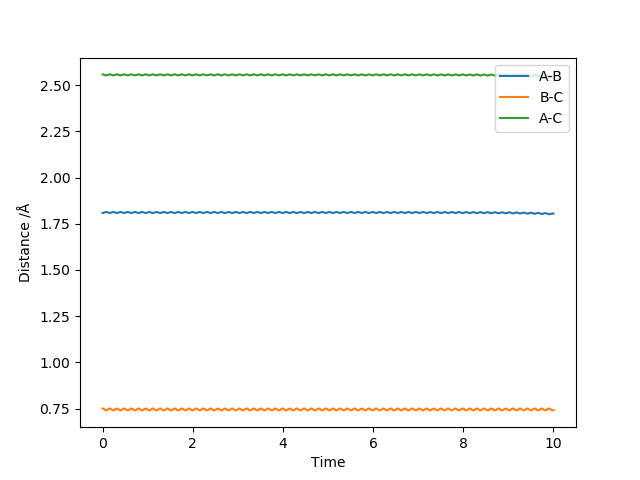
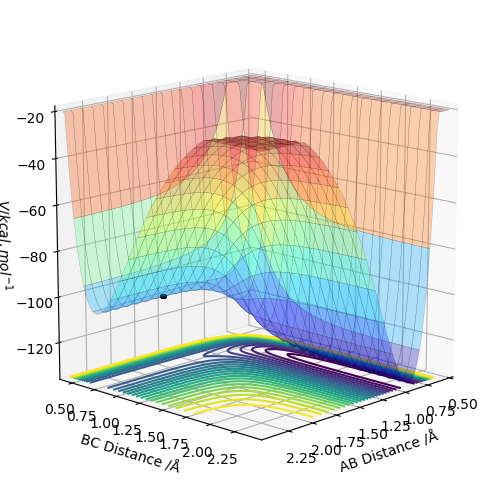
Based on the Hammond's postulate, the transition state of the exothermic reaction F + H2 lies near the reactant. Looking at F + H2 graph, the transition state therefore lies near the reactant and it is supported by the intermolecular vs time graph as shown above (No change in the intermolecular distances for a subsequent period of time). Likewise, the transition state of the endothermic H + HF reaction lies near the product.
With trial and errors, the position of the transition state for the exothermic F + H2 reaction was found at r1(AB Distance) = 1.8106929 Å and r2(BC Distance) = 0.745 Å.
The position of the transition state for the endothermic H + HF reaction was found at r1(AB Distance) = 0.745 Å and r2(BC Distance) = 1.8106929 Å.
The activation energies of both of the reactions were found by displacing the activated complex slightly from the transition state.
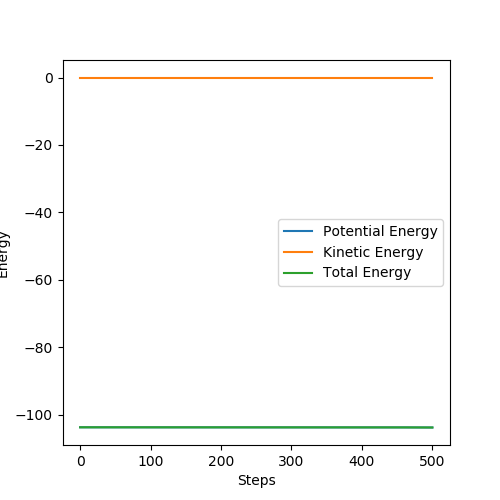
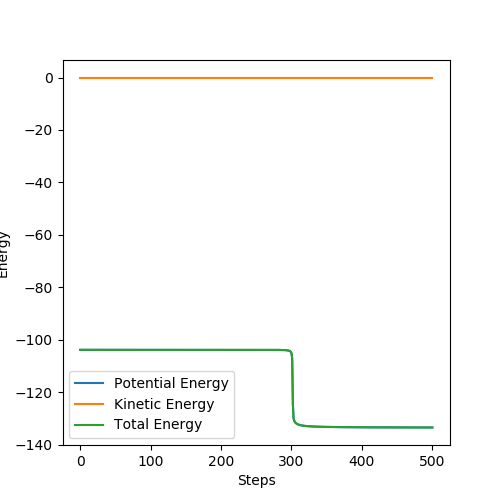
The activation energy of the exothermic reaction F + H2 was calculated by displacing r1 to 1.8107 Å. However, the activation energy of the exothermic reaction was negligible such that was hard to be observed from the energy vs time graph.
The activation energy of the endothermic reaction was calculated by displacing r2 to 1.8106 Å. The activation energy was found as 29.5 KJ/mol.
Reaction Dynamics
By the conservation of energy, the total energy is always conserved. At the start, H2 and and F atom are stationary thus they only have potential energies. As they are brought together, the potential energies between them decrease and the kinetic energies of H2 and F atom subsequently increase. As they collide, they start to oscillate and H-H bond is broken and new H-F bond is formed. Since the reaction is exothermic, the excess energy is released from the reaction as heat and the remaining energy is converted to the vibrational energy of HF molecule and kinetic energy of H atom.
How can the potential energy of the system be decreasing as it goes up the hill of the TS? Rk2918 (talk) 11:25, 28 May 2019 (BST)
Experimentally, the above mechanism can be confirmed by measuring the heat released during the reaction with a calorimeter and the vibrational energy of HF molecule can be measured by using IR.
This answer is not quite complete. What is calorimetry? What does it measure, and why can it be applied here? Rk2918 (talk) 11:25, 28 May 2019 (BST)
Polanyi's empirical rule
The position of the transition state is important in determining the distribution of energy between different modes. For the early transition (exothermic reaction), having translational energy in majority is sufficient to form the product because having vibrational energy would cause the molecule to slide the potential energy surface side to side such that it does not have enough energy to overcome the activation energy. However, for the late transition (endothermic reaction, having vibrational energy helps to climb the potential energy surface up to the transition state. Having too much vibrational energy bounces back the product to the reactant.[3]
All good, but how does this manifest in your observations during these exercises? Rk2918 (talk) 11:27, 28 May 2019 (BST)
Overall these answers are very detailed and thorough - any question where I have not made a comment you can assume your answer is very good! Rk2918 (talk) 11:27, 28 May 2019 (BST)
References
- ↑ Chemistry LibreTexts. The Morse Potential graph. Available from : https://chem.libretexts.org/Bookshelves/Physical_and_Theoretical_Chemistry_Textbook_Maps/Map%3A_Physical_Chemistry_(McQuarrie_and_Simon)/05._The_Harmonic_Oscillator_and_the_Rigid_Rotator%3A_Two_Spectroscopic_Models/5.3%3A_The_Harmonic_Oscillator_Approximates_Vibrations
- ↑ Atkins, P.W., and Paula J. De. Atkin's Physical Chemistry. Oxford: Oxford University Press. 2006
- ↑ Jeffrey I.Steinfeld, Joseph S. Francisco, William L.Hase. Chemical Kinetics and Dynamics. United States: A Paramount Communications Company, 1989


