Intro to Molecular Modelling 2 ASG17
NH3
IMAGE
Test Molecule - NH3 |
OPTIMSATION
| Aspect of Molecule | Value/Answer |
|---|---|
| Calculation Method | RB3LYP |
| Basis Set | 6-31G(d.p) |
| Final Energy | -56.55776873 |
| RMS Gradient | 0.00000485 |
| Point Group | C3V |
| N-H Bond Distance | 1.01798 |
| Bond Angle | 105.741 |
Optimised Parameters
The following image shows the final set of parameters for an optimised molecule of ammonia, NH3.

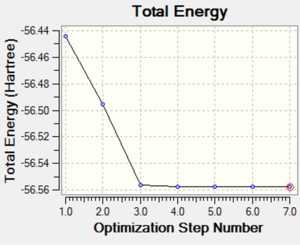
The following image is a graph showing the total energy of each structure throughout the optimsiation process of ammonia, NH3. The seventh and final structure has the lowest energy meaning that it is the the optimised structure of NH3 as the structure with the lowest energy is the most stable and so is therefore the optimised structure.
The following image shows the RMS gradient again at each stage of the optimisation process of ammonia, NH3.

VIBRATIONS

Vibrational Analysis
How many modes do you expect from the 3N-6 rule?
The 3N-6 rule determines the number of normal vibrational modes for a non-linear molecule with an N number of atoms. In the case of ammonia which has 4 atoms, you would expect 6 normal vibrational modes which are shown in the image above.
Which modes are degenerate?
Degerante modes are those that have the same energy, which in the image above is shown by the 'Infrared' column. Vibrational modes 2 and 3 have both the same frequency and infrared energy meaning that they are degenerate. At glance it may appear that they are the same vibrational mode however when viewing the animation, it is clear that they are two separate vibrational modes. Vibrational modes 5 and 6 are also degenerate.
Which modes are "bending" vibrations and which are "bond stretch" vibrations?
Looking at the animations shows that the bending frequencies are vibrational modes 1, 2 and 3 whereas the stretching frequencies are vibrational modes 4, 5 and 6. Without looking at the animations we can also depict which modes are stretching and which are bending by considering the frequencies. Stretching frequencies are much higher than bending frequencies. For the ammonia molecule, the bending frequencies are betewen 1000-1700 whereas the stretching frequencies are between 3400-3600.
Which mode is highly symmetric?
Vibrational modes 1,3,4 and 6 can all be considered as symmetrical modes when the animation is observed however the most symmetrical vibrational mode is no. 4.
One mode is known as the "umbrella" mode, which one is this?
The 'umbrella' mode is vibrational mode no. 1 as when the animation is observed, there is an appearance of an umbrella being opened and closed continuously.
How many bands would you expect to see in an experimental spectrum of gaseous ammonia?
There are 6 vibrational modes overall however as there are 2 sets of degenerate modes, you would expect to see 4 bands in the experimental spectrum.
CHARGE ANALYSIS
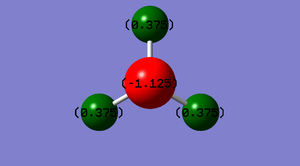
The image on the left shows the charges on each atom for a molecule of ammonia, NH3. It is expected that the nitrogen has a negative charge as it is more electronegative than hydrogen meaning that it will withdraw the bonding pairs of electrons towards itself thus making the charge more negative as electrons are negatively charged and are distributed closer to the nitrogen. The hydrogens are expected to have a positive charge as they are less electronegative meaning that charge is distributed further away from the hydrogens. The same charge is apparent for the three hydrogens as the are the same type of atom with the same electronegativity.
REACTION ENERGIES
H2
| Aspect of Molecule | Value/Answer |
|---|---|
| Calculation Method | RB3LYP |
| Basis Set | 6-31G(d.p) |
| Final Energy | -1.15928020 |
| RMS Gradient | 0.09719500 |
| Point Group | D*H |
| Bond Distance | 0.7429 |

N2
| Aspect of Molecule | Value/Answer |
|---|---|
| Calculation Method | RB3LYP |
| Basis Set | 6-31G(d.p) |
| Final Energy | -109.52412868 |
| RMS Gradient | 0.00000060 |
| Point Group | D*H |
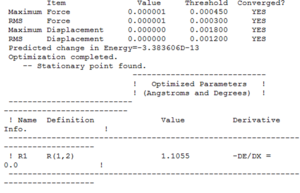
| Bond Distance | 1.10550 |
Calculations
E(NH3)= -56.55776873
2*E(NH3)= -113.11553746
E(N2)= -109.52412868
E(H2)= -1.15928020
3*E(H2)= -3.4778406
ΔE=2*E(NH3)-[E(N2)+3*E(H2)]= -0.11356818*2625.5 = -298.17325659
MOLECULAR ORBITALS
H2

N2
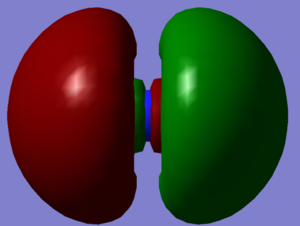
NH3
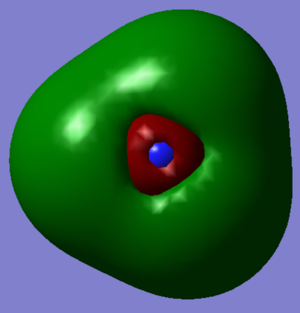
Molecule of Own Choice - O2
IMAGE
Test Molecule - O2 |
OPTIMISATION
| Aspect of Molecule | Value/Answer |
|---|---|
| Calculation Method | RB3LYP |
| Basis Set | 6-31G(d.p) |
| Final Energy | -150.25250603 |
| RMS Gradient | 0.05905207 |
| Point Group | D*H |
| Bond Distance | 1.16160 |
Optimised Parameters
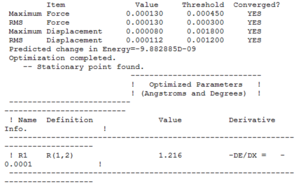
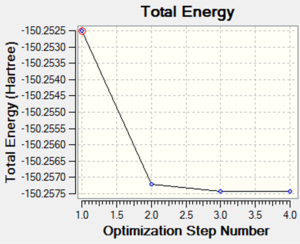
The following image is a graph showing the total energy of each structure throughout the optimsiation process of oxygen, O2.
The following image is a graph showing the RMS gradient at each stage of optimisation.

VIBRATIONS

As oxygen is a linear molecule you would expect it to have 3N-5 normal vibrational modes where N = 2, as there are two atoms. This indicates that oxygen has 1 vibrational mode, as shown by the image.
CHARGE ANALYSIS
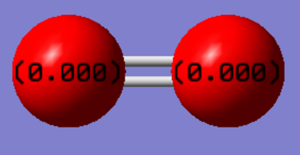
The image shows the charges on each oxygen atom in a molecule of oxygen. As they are two of the same atom, there is no difference in electronegativity meaning that overall the molecule has no charge.
MOLECULAR ORBITALS
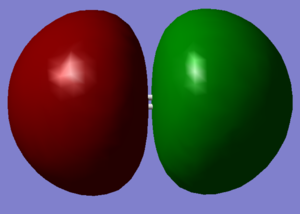
The image on the left shows the molecular orbitals for a molecule of oxygen. Due to both atoms having the same electronegativty and the way in which the atoms are bonded to each other, this is how the molecular orbitals appear.
