Inorganic PS3712
INORGANIC COMPUTATIONAL EXPERIMENT
EX3 Section
Introduction
The first part of the computational module involves using Gaussian to optimise molecules using different set basis theories. The optimised structures are then used to predict bond lengths, bond angles, bond frequencies and orders as well as molecular orbitals of the particular molecule.
Optimisation with B3LYP/3-21G
BH3
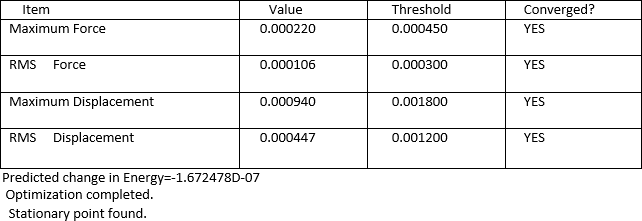
A BH3 molecule was built with each B-H bond having a length of 1.53Â,1.54Â and 1.55Â. This was done in order to break the symmetry of the molecule. This molecule was optimised using the basis set theory of B3LYP/3-21G.The resulting molecule had a bond angle of 120° and the bond length for all 3 B-H bond was 1.19Â. Using the log file, a further summary of the optimisation was obtained and presented in the table below.
Optimisation Log File: File:BH3 OPTIMISATION 2015.LOG
| Molecule | Summary Table | Convergence | Jmol | |||
|---|---|---|---|---|---|---|
| BH3 | 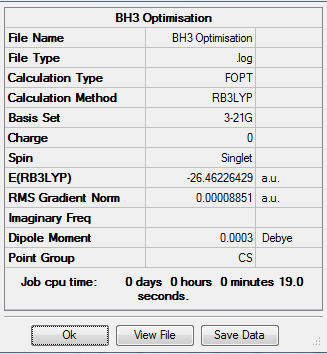 |
 |
|
Table 1: Results from Optimisation of BH3 using B3LYP/3-21G
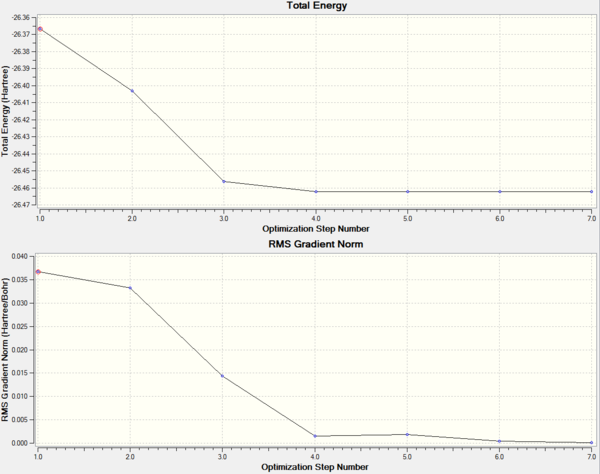
As from the table, it can be seen that the molecule had reached a stationary point hence showing that a minimum energy had been found. To further confirm this, the information from the log file was used to obtain the energy of the molecule at each optimisation stage and the RMS Norm gradient. The first graph indicates a decrease in the energy which corresponds to the stabilisation of the molecule where else the second graph shows the RMS Norm gradient. At the seventh step of the optimisation, the value is almost at zero. This could be used as an indication that optimisation is possibly complete.
Optimisation with B3LYP/6-31G(d,p)
BH3
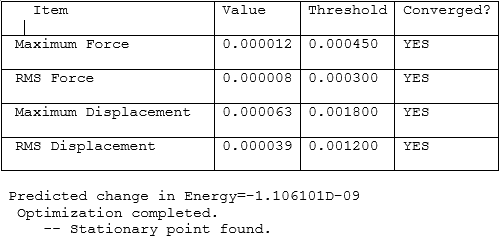
In order to further improve the optimisation of the molecule, a higher basis set theory B3LYP/6-31G(d,p), was used in this part of the experiment. Using the molecule obtained from the earlier part, the optimisation is carried out and the resulting molecule has a bond angle of 120° and all 3 B-H bonds had a bond length of 1.19Â. The table below shows the results obtained from the log file of the resulting molecule.
Optimisation Log File: File:BH3 OPTIMISATION 6-31G 2015.LOG
| Molecule | Summary Table | Convergence | Jmol | |||
|---|---|---|---|---|---|---|
| BH3 | 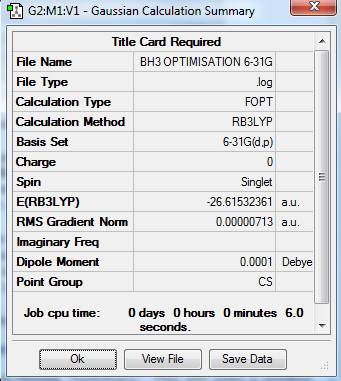 |
 |
|
Table 2: Results from Optimisation of BH3 using B3LYP/6-31G(d,p)
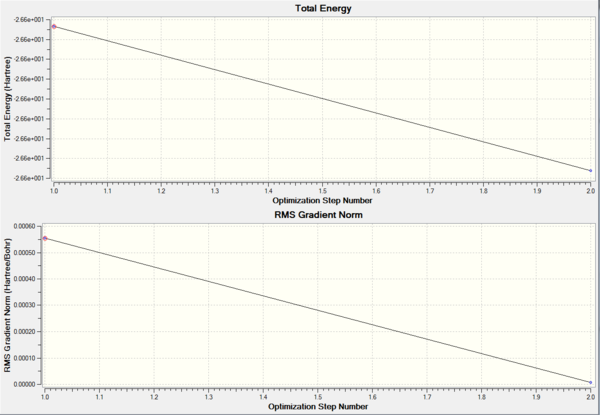
The total energy obtained from both methods are shown in table 3. The difference between the energies are that of 0.153a.u (401.70kj/mol). Despite the energy obtained from using B3LYP/6-31G(d,p) is much more negative indicating it is much more stable, a direct comparison cannot be made with both the structures as different set of basis theories were used in both cases.
| Basis Set Theory | Energy(a.u) | Energy(kj/mol) |
|---|---|---|
| B3LYP/3-21G | -26.462 | 69475.99 |
| B3LYP/6-31G(d,p) | -26.615 | 69877.69 |
Table 3: Energy obtained from the two different basis set theory used
Optimisation with B3LYP/LanL2DZ (DFT Method)
GaBr3
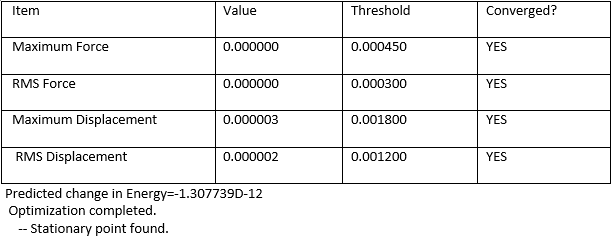
The molecule was drawn using GaH3 as a template. The three hydrogen atoms were replaced with Bromine atoms. The bond length was left at its default length which was 2.39Â. For this molecule, the symmetry of the molecule was constrained by setting the point group to D3H. The tolerance of the calculation was also set to very tight in order to improve accuracy and avoid problems with vibrations and molecular orbitals of the molecule. The optimisation of the molecule was carried out using HPC service. The method and basis set theory used in this calculation is B3LYP/LanL2DZ (DFT Method).
Optimisation Log File:File:The calculatin 2015.log
D-space link of HPC Calculation: DOI:10042/195179
| Molecule | Summary Table | Convergence | Jmol | |||
|---|---|---|---|---|---|---|
| GaBr3 | 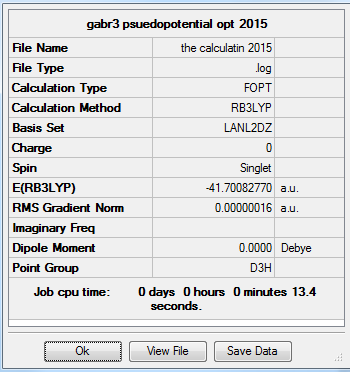 |
 |
|
Table 3: Results from Optimisation of GaBr3 using B3LYP/LanL2DZ (DFT Method)
The length of the optimised GaBr3 was at 2.350Å with a bond angle of 120.00°.
Optimisation with B3LYP/6-31G(d,p)LanL2DZ (DFT Method)
BBr3
The molecule was drawn using the optimised structure of 6-31G(d,p) BH3. The hydrogen atoms were then substituted for Bromine atoms. The B-Br bond length was set at 2.02Å. This file was then saved and the particular gjf file was edited to specify the basis set that will be used in the calculation. For the Boron atom, the basis set theory that will be used in 6-31G(d,p) and for all the bromine atoms, pseudo potentials will be used. The edited part of the file is shown below.
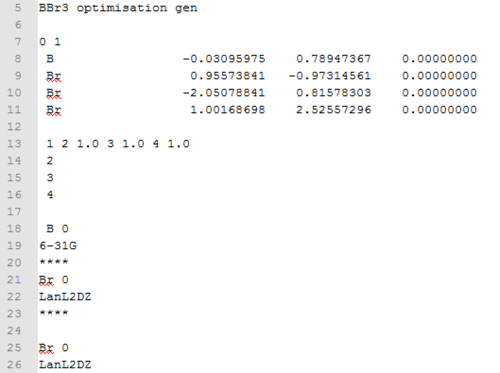
Once this has been completed, the file was sent to HPC for calculations to be carried out. The results of the molecules are shown in the table below.
Optimisation Log File:BBr3 trial 3(Log File).log
D-space link of HPC Calculation: DOI:10042/195197
| Molecule | Summary Table | Convergence | Jmol | |||
|---|---|---|---|---|---|---|
| GaBr3 | [[File:Summary table BBr3.PNG] |  |
|
Table 4: Results from Optimisation of BBr3 using B3LYP/6-31GLanL2DZ
The resulting bond length is 1.951Å and the bond angle is that of 120°.
Geometry Comparison
A chemical bond is a type of attraction that exist between two or more atoms. There are several different types of bond in which each are formed differently. The two most extreme cases are an ionic bond and a covalent bond. An ionic bond is formed due to an electrostatic attraction between a positively charged ion, cation and a negatively charged ion, anion. A covalent bond on the other hand is formed by sharing of electrons between the atoms involved. Formation of covalent bonds give rise to the dipole moments. Dipole moments arise due to the imbalance of the distribution of the electron cloud. In metals, the type of bonding that exist is that of a metallic bond which is the electrostatic attraction between the cations and the sea of electron surrounding the metal cation. Hydrogen bonding which is also a vital type of bond is a type of bond that is exclusively between the hydrogen atom and electronegative atoms such as oxygen,fluorine and nitrogen.
The strength of a particular bond between atoms are measured by the bond energy. The bond energy is a measure of the amount of energy required in order to dissociate a particular bond. The higher the bond energy, the higher the amount of energy required to dissociate the bond. Hence, the strength of the bond is larger. A weaker bond would have a lower bond energy. An example of a strong bond is that of N2. The triple bond between the nitrogen atoms have a dissociation energy of 945 kj/mol. The C-C bond is an example of a medium bond with an energy value of 347kj/mol. An example of a weak bond is one that breaks easily is that of I2. It has an energy of 151kj/mol.
The gaussian programme is unable to sometimes draw out a bond as the molecules may be to far apart for it to be read as a bond. This is judged by the computer by comparing the distances to its known database. Given that the atoms are in the suited distance range a bond is drawn. The absence of a bond due to this limitation does not mean that in reality, a bond does not exist there.
In this experiment the three structures that were drawn are BH3, GaBr3, and BBr3. The table below shows a summary of the varying bond length and bond angle of each of the molecules.
| BH3 | GaBr3 | BBr3 | ||
|---|---|---|---|---|
| r(E-X) Å | 1.1923 | 2.3502 | 1.9511 | |
| θ(X-E-X) degrees(º) | 119. 99 | 120.00 | 119.99 |
Table 5: Angles and Bond Length of Molecules
The first comparison that can be made is between GaBr3, and BBr3. The ions that surround the central atom remains the same but the central atom has changed. When comparing both Gallium and Boron, it is important to note that these two elements are of the same group, group 13. Both of the elements have the same valence electron. Gallium however is located below boron hence it is more likely to have a larger atomic radius. As bond length is defined as the average distance between two nuclei of the bonded atom. When a simple calculation is done by adding the two covalent radius of both the Gallium (1.26Å) and Bromine(1.14Å), the bond length is 2.4Å. For Boron(0.82Å) and Bromine(1.14Å), the bond length would be 1.96Å. The difference between these two calculated bond lengths are 0.44Å. Based on the experimental data obtained the bond length of the GaBr3 (2.35Å) is longer than that of BBr3(1.95Å). This is because, Gallium has a larger atomic radius hence it is much more diffused than boron. This results in the charge being spread out much more hence forming a weaker bond, hence a longer bond length. The difference between the bond length of the two molecules are 0.399Å. This value is almost the same as the value that had been calculated using simple addition.
The second comparison that can be made is between BH3 and BBr3. In this case, the central atom, Boron is kept as a constant and the outer atoms are varied. Hydrogen atom is relatively smaller than a bromine atom. They both also have a different valence electron. For hydrogen, the valence electron is located in the 1s shell whereas for bromine it is located in the 4p shell. Bromine atoms have a radius of 1.14Å and hydrogen has a radius of 0.37Å. The large difference in the radius can account for the difference of the bond length which is 0.76Å. Bromine atom also has a much more diffused orbital. Hence it results in a weaker bond being formed with the Boron. When a simple mathematical calculation is carried out the length of the BH3 and BBr3 are 1.19Å and1.96Å respectively. The difference in the bond length is 0.77Å. This value corresponds to the value that was obtained from Gaussian.
Frequency Analysis
BH3 B3LYP/6-31G(d,p)
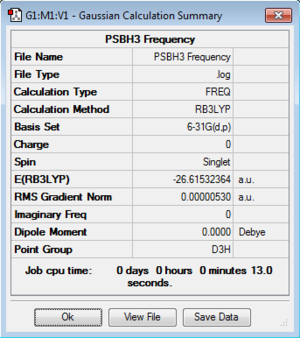
The previously optimised BH3 log file was used in order to obtain the starting molecule for the vibrational analysis. The point group of the molecule required was D3h. The point group of the molecule was Cs hence modifications were made to constrain the point group at D3h. Once completed, a frequency analysis was carried out.
Frequency File:PSBH3 FREQUENCY.LOG
| Summary Table | Low Modes |
|---|---|
 |
Vibrational Data Of BH3
| wavenumber | Intensity | IR active? | type | Symmetry Labels |
| 1162.95 | 92.57 | yes | bent | A2 |
| 1213.12 | 14.05 | Slight | bent | E' |
| 1213.12 | 14.05 | Slight | bent | E' |
| 2582.66 | 0 | no | stretch | A1' |
| 2715.81 | 126.33 | Yes | stretch | E' |
| 2715.81 | 126.32 | Yes | stretch | E' |
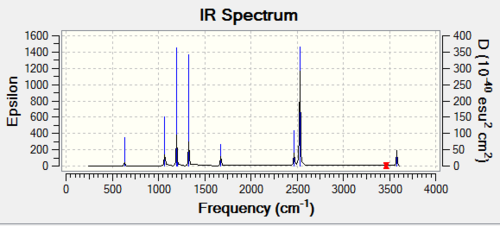
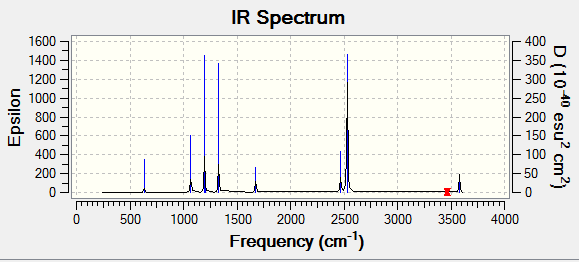
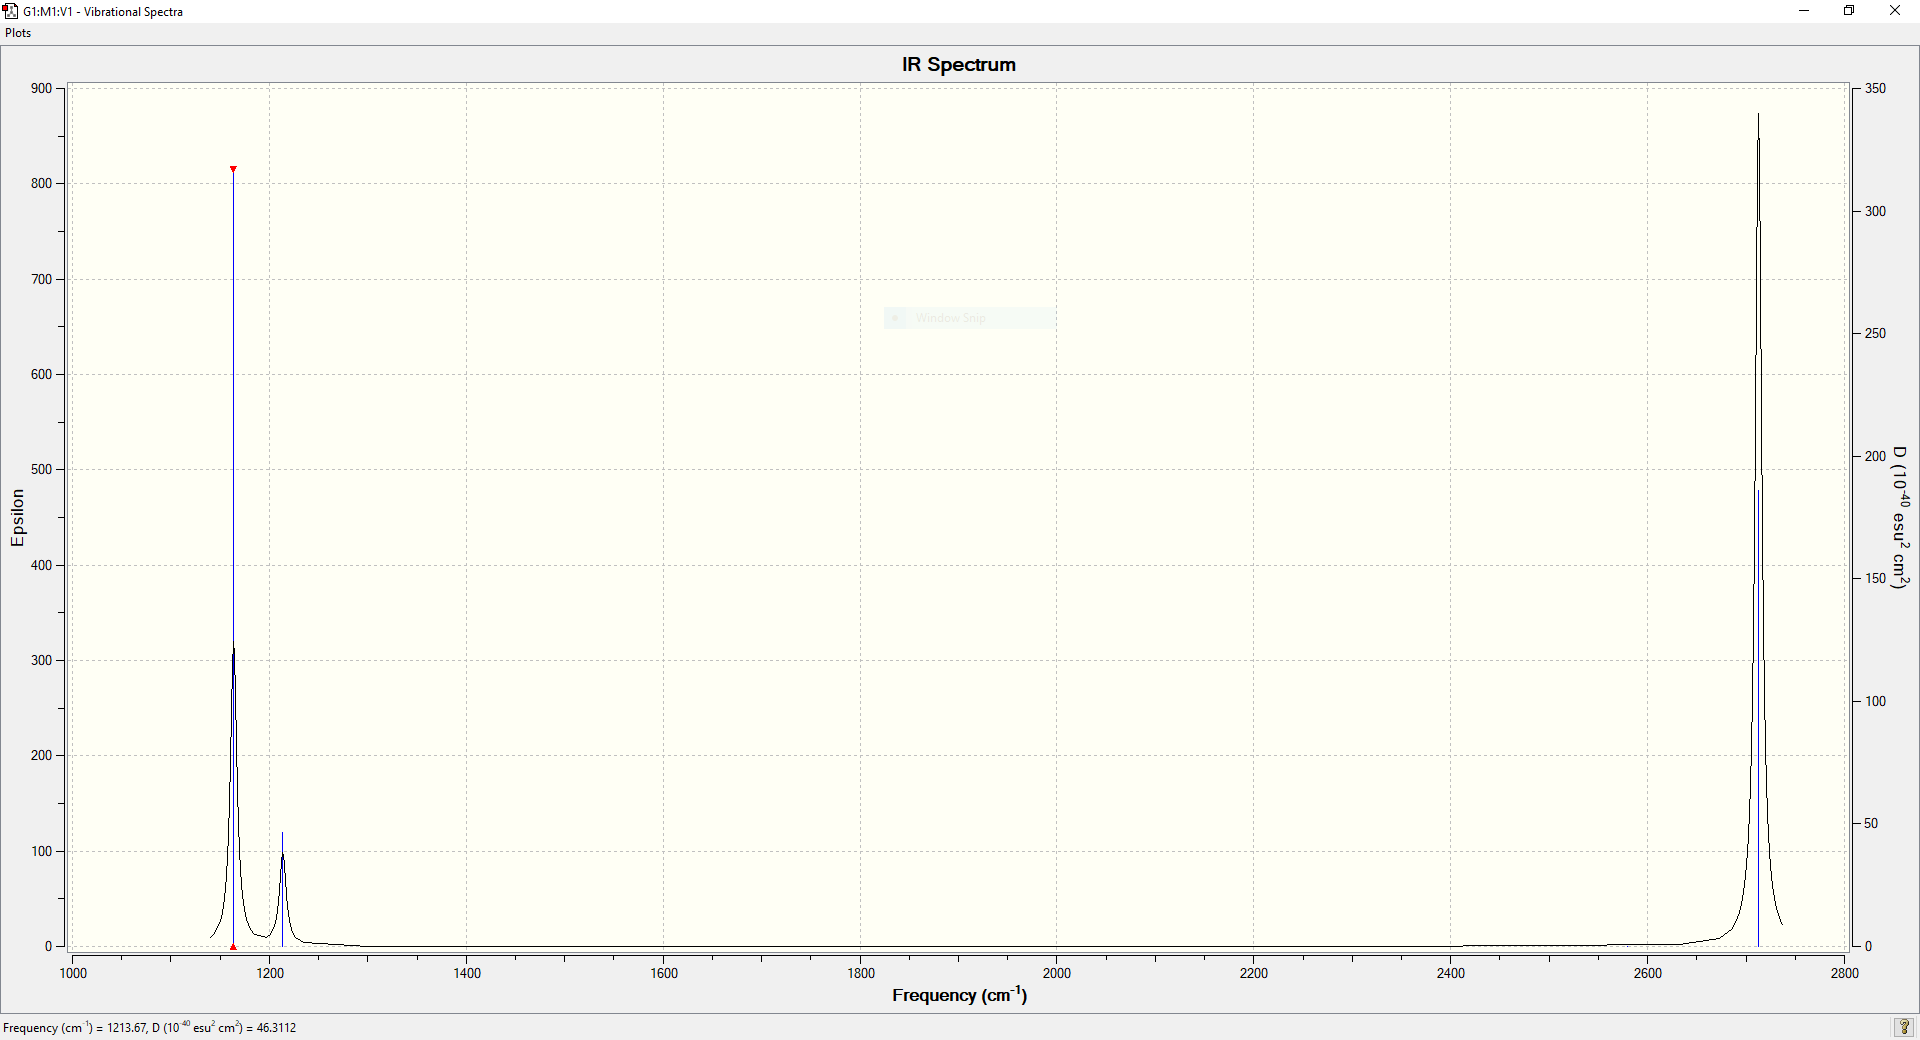
Vibrational Spectrum of BH3
Using the equation 3N-6 in which N is the number of atoms, there should be 6 possible vibrations. Thus the result obtained is in good agreement with the calculated vibrational degree of freedom. By taking into account the intensity of the vibrations it is noted that there are 5 IR active vibrations and 1 IR inactive vibration. A particular vibration is inactive if it does not cause a change in the dipole moment and will not appear in the IR spectrum. The absence of a peak at 2582.66 cm-1 confirms this. Of the 5 IR active vibrations, there are two sets of degenerate vibrations. These are the vibrations at 1213.12-1 and 2715.81cm-1. Hence they will only appear once on the spectrum, thus reducing the number of peaks from six to three.
B3LYP/LANL2DZ GaBr3
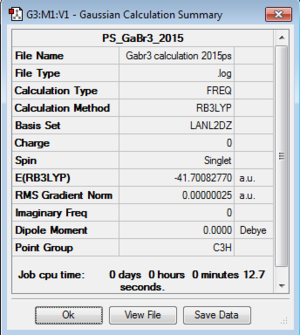
The input file that was used for this part of the calculation was the log file from the previously generated optimised structure of GaBr3. The point group of the molecule was already D3H thus no further modifications had to be carried out. The basis set theory was set at B3LYP/LANL2DZ and the calculation was carried out on HPC. Once complete, the energy of the resulting structure was compared with that of the input file to ensure the correct file was optimised.
D-space File from HPC calculation:DOI:10042/195206
| Summary Table | Low Modes |
|---|---|
 |

|
Vibrational Data Of GaBr3
The table below indicates the various vibrational stretches obtained from the frequency analysis.
| wavenumber | Intensity | IR active? | type | Symmetry Label |
| 76.39 | 3.35 | very slight | bent | E' |
| 76.39 | 3.35 | very slight | bent | E' |
| 99.68 | 9.22 | very Slight | bent | A2 |
| 197.33 | 0 | no | stretch | A1' |
| 316.18 | 57.07 | Yes | stretch | E' |
| 316.18 | 57.07 | Yes | stretch | E' |
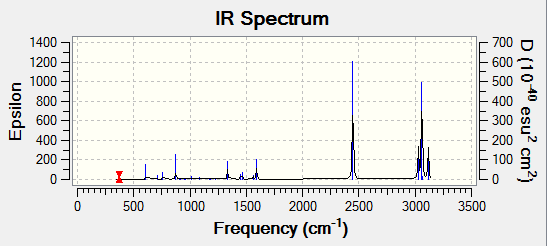
IR spectrum of GaBr3
For GaBr3, using the formula 3N-6, there should be 6 possible vibrations. As seen from the vibrations, it can be said that all 6 vibrations are present. Similar to that of BH3, only three peaks appear on the spectrum despite there being 5 IR active vibrations. This is due to degeneracy. Vibrations with a frequency of 76.39cm-1 and 316.18cm-1 respectively are degenerate hence only appearing once on the spectrum. The absence of a peak at 197.33 cm-1 is once again because it does not have a change its dipole moment.
Comparison of Vibrational Analysis of BH3 and GaBr3
When comparing the vibrational data of both the molecules it is observed that the frequency of the BH3 is higher than that of GaBr3. This once again can be related to the bond strength of the respective molecules. For a weaker bond, the vibration frequency will be lower. GaBr3 has a weaker bond as both the atoms have much more diffused orbitals than BH3. This means that as the charges are much more diffused, the bond that results from a more diffused orbital would form a weaker bond hence a longer bond. With a longer bond, the vibrational frequency would be lower. Besides that, both Gallium and Bromine are relatively much heavier than Boron and Hydrogen. This also influences the frequency of the vibration motions.
The point group of both the molecules are D3H. The symmetry labels obtained from the calculation for both the molecules are E', A1' and A2. All three labels are present for the two molecules but are there in a different order. For the A2 umbrella motion as shown in the figure below, the frequency for the BH3 molecule is 1162.95cm-1 and for GaBr3 it is at 99.68cm-1. The intensity of these vibrations also vary for both the molecules with 9.22(GaBr3) and 92.57(BH3).
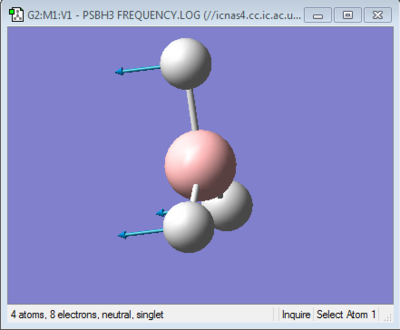
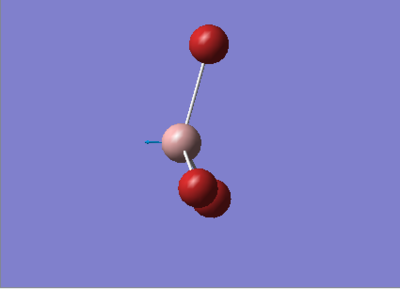
There are two factors that affect the frequency of a particular vibration. The first factor the length of a particular bond and the second factor being the mass of the atom attached to the end of a particular bond. These two factors can be further explained via the equation that is vital in IR spectroscopy as shown below.
v=1/2π(k/μ)^(1/2)
where, v= Frequency(cm-1) k= force constant (Nm-1 ) μ= reduced mass.
The force constant factor in this equation can be used to denote the strength of the bond. As reported earlier, B-H(1.19Å) has a shorter bond than Ga-Br(2.35Å). Shorter bonds indicate a stronger bond while weaker bonds are typically longer. Therefore the stronger bonds would more likely have a larger force constant value thus resulting in a larger frequency.
The reduced mass of a particular molecule can be calculated using the mass of the atoms present in the molecule. The formula for calculating reduced mass is shown below.
μ=(m1m2)/(m1+m2 )
As atoms in BH3 are generally lighter than that of GaBr3, BH3 would have a smaller reduced mass. This once again results in a higher frequency. The combined effect of the two factor thus explains the reason as to why the frequency of the molecules are large in difference.
When comparing two different molecules, the basis set theories and methods carried out on to the molecules must be similar. If one molecule were to be optimised via a particular basis set theory and a frequency calculation is carried out on the other molecular the data obtained cannot be compared as the resulting values would be insignificant to one another,
A frequency analysis is carried out in order to ensure if the structure that was optimised had converged to a minimum or maximum. This can be done by taking a look at the frequencies. If the frequencies are that of a negative, then a maximum had been achieved and if negative frequencies are obtained, then a minimum is achieved.
In order to obtain the number of vibrational modes for the molecules, it can be calculated using 3N-6 where N is the number of molecules. The low frequencies obtained in the experiment represent the values from the “-6” part of the equation. These values are almost always smaller than the values of the first vibrational frequency.
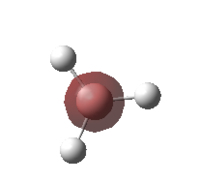
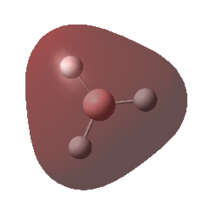
Molecular Orbitals Of BH3
The previously optimised BH3 molecule was used in order to carry out an energy calculation as well as a MO analysis. This calculation was done via a HPC.
D-space Log File: DOI:10042/195278
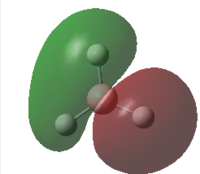
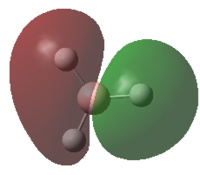
The table below shows the molecular orbitals that had been calculated along with its respective energies and occupancy.
| MO Image | Energy | Occupancy | MO Image | Energy | Occupancy |
|---|---|---|---|---|---|
 |
-6.7714 | 2 | 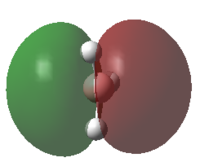 |
-0.0661 | 0 |
 |
-0.5125 | 2 | 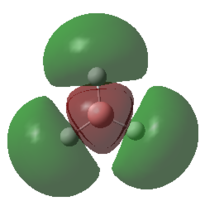 |
0.1684 | 0 |
 |
0.3508 | 2 | 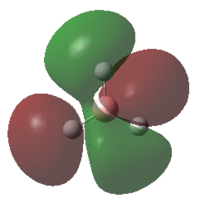 |
0.1793 | 0 |
 |
-0.3508 | 2 | 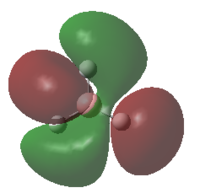 |
0.1793 | 0 |
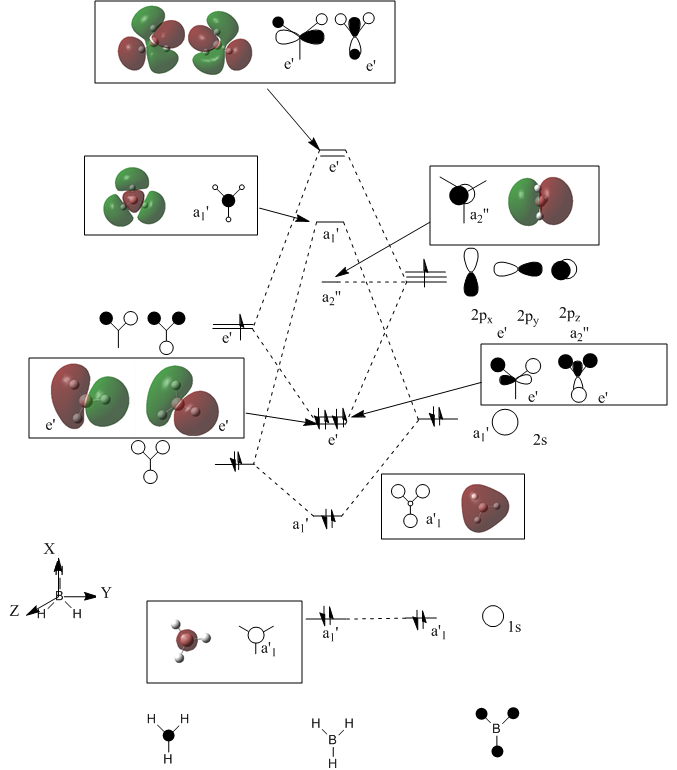
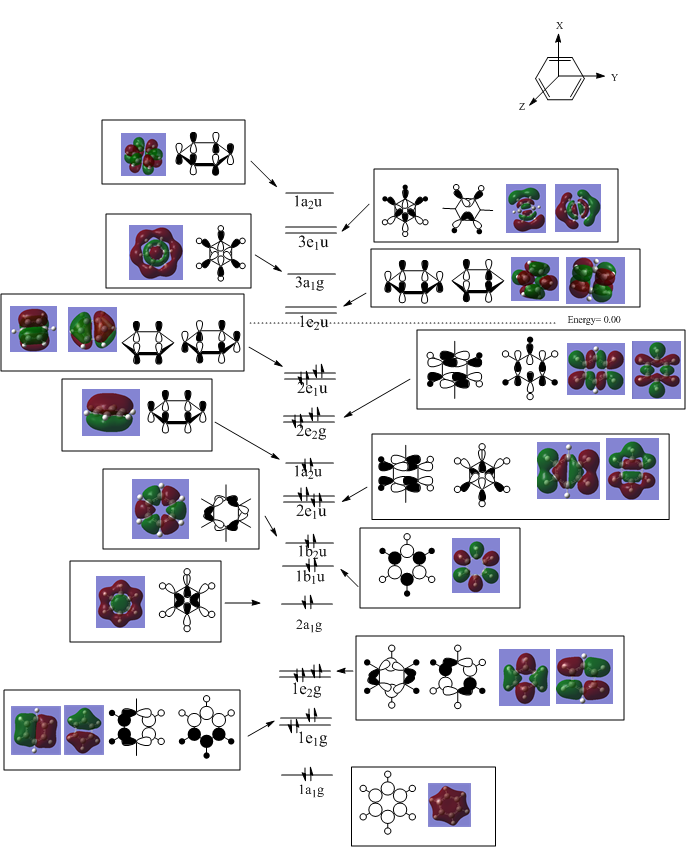
A MO diagram of BH3 along with the calculated orbitals is drawn in the diagram below.
From the MO diagram that had been constructed by using Linear Combination of Atomic Orbitals(LCAO), the orbitals obtained were compared with that the orbitals obtained via calculation from Gaussview. The shapes of the orbitals were not exactly the same. The degree at which the orbitals have spread out is hard to obtain from LCAO unlike that obtained experimentally. However LCAO does give a good approximation of the combination of the orbitals hence allowing to predict the general shape of the mixed orbitals. This therefore makes LCAO a useful tool to use in order to approximate the possible MO diagram before carrying out long and complex calculations for a molecule as only basic assumptions and theories are used in the approach.
NBO Analysis of NH3
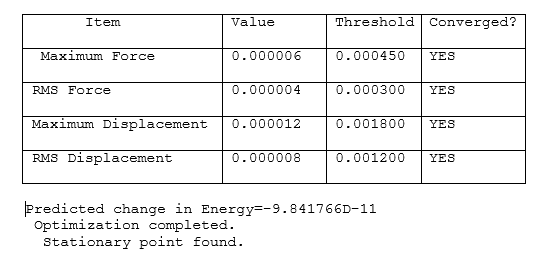
A NH3 molecule is drawn and optimised using B3LYP/6-31G(d-p)
D space Link of HPC Calculation:DOI:10042/195290
| Molecule | Summary Data | Convergence | JMol | |||
|---|---|---|---|---|---|---|
| NH3 | 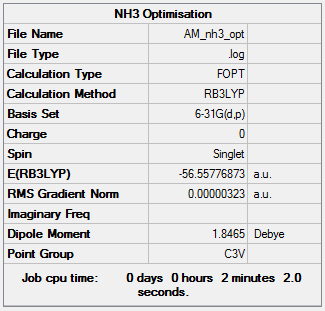 |
 |
|
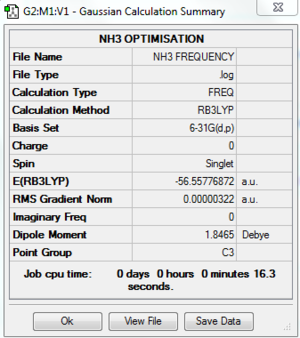
A frequency analysis was carried out and the following was obtained
| Summary Table | Low Modes |
|---|---|
 |

|
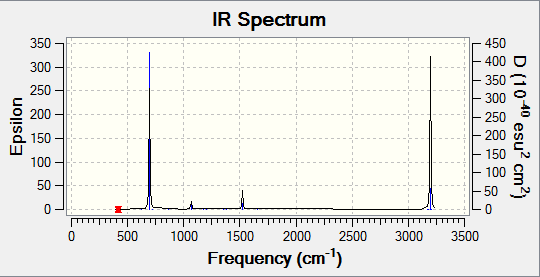
The IR spectrum of the molecule is as below:
The table below shows the vibrational stretches and symmetry labels that had been obtained from the calculation.
A MO analysis was also carried out in order to visualize the respective MO's.
LOG File:DOI:10042/195305
NBO of NH3
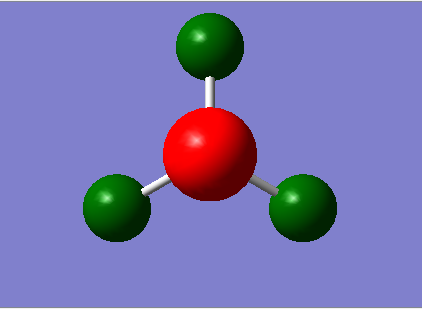
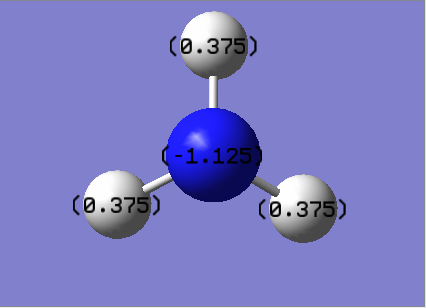
The log file from the previous population calculation was used to obtain the NBO of the molecule. The figure below shows the results obtained. The range used in this calculation is between -1 to +1
| Charge Distribution | NBO Charges |
|---|---|
 |
|
Association Energy For Ammonia-Borane
Optimisation
The molecule was optimised using B3-LYP 6-31G
| Molecule | Summary Table | Convergence | Jmol | |||
|---|---|---|---|---|---|---|
| Ammonia Borane | 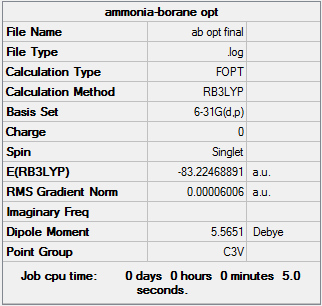 |
 |
|
Frequency Analysis
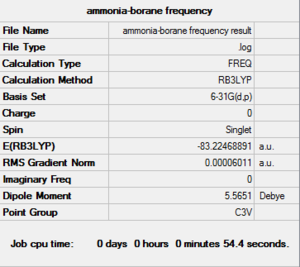
Log D File: DOI:10042/195368
| Summary Table | Low Modes |
|---|---|
 |
IR Spectrum:File:Ir spectrum.PNG
Determination Of Energy Of Molecule
| Molecule | Energy (A.U) | Energy (kj/mol) |
|---|---|---|
| NH3 | -56.5577697 | -69878.54 |
| BH3 | -26.6153236 | -148492.44 |
| NH3BH3 | -83.2246889 | -218506.44 |
Using the formula, ΔE=E(NH3BH3)-[E(NH3)+E(BH3)], the bond dissociation energy of Ammonia-Borane is calculated in kj/mol.
ΔE= (-218506.44)-[-148492.4+-69878.54]
ΔE= -135.50 kj/mol
Therefore the value of the bond formation would be a positive value of the value obtained. This value indicates that the bond formed between the ammonia molecule and borane molecule is one of a medium bond.
Aromaticity
Optimisation
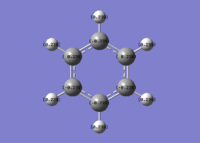
Benzene
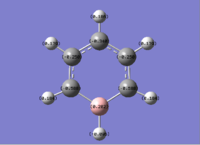
All calculations were run using BGLYP/631-G(d,p) The molecule was optimised and the following was obtained.
Log File:BENZENE OPTIMISATION 2.LOG
| Molecule | Summary Table | Convergence | Jmol | |||
|---|---|---|---|---|---|---|
| Benzene | 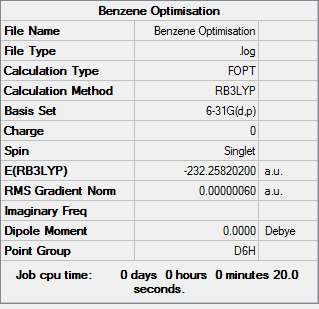 |
 |
|
Table 13: Results of Benzene Optimisation
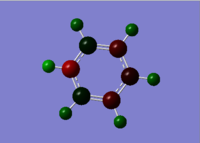
Boratabenzene
All calculations were run using BGLYP/631-G(d,p) The molecule was optimised and the following was obtained.
Log File:File:OPTIMISATION 2.LOG
| Molecule | Summary Table | Convergence | Jmol | |||
|---|---|---|---|---|---|---|
| Boratabenzene | 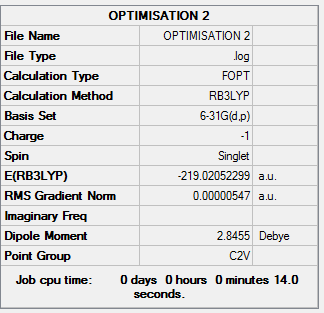 |
 |
|
Table 14: Results of Boratabenzene Optimisation
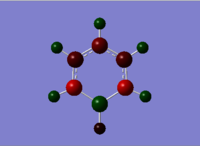
Pyridinium
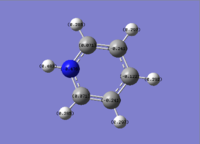
All calculations were run using BGLYP/631-G(d,p) The molecule was optimised and the following was obtained.
Log File:File:OPTIMISATION PY.LOG
| Molecule | Summary Table | Convergence | Jmol | |||
|---|---|---|---|---|---|---|
| Pyridinium | 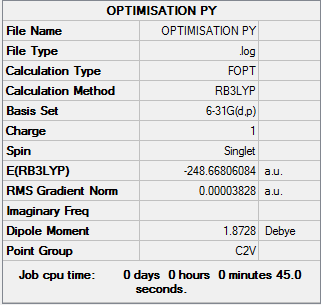 |
 |
|
Table 15: Results of Pyridinium Optimisation
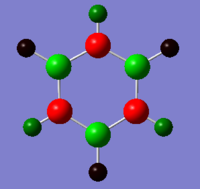
Borazine
All calculations were run using BGLYP/631-G(d,p) The molecule was optimised and the following was obtained.
Log File:File:BORAZINE OPTIMISATION.LOG
| Molecule | Summary Table | Convergence | Jmol | |||
|---|---|---|---|---|---|---|
| Borazine | 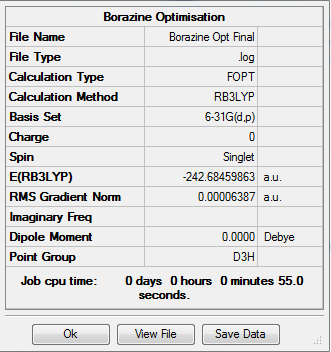 |
 |
|
Table 16: Results of Borazine Optimisation
Frequency Analysis
Benzene
A frequency analysis was carried out on the molecule in order to obtain the symmetry labels and vibrations. It was run using a HPC with a similar basis set theory as used above.
D-log File for HPC calculation:DOI:10042/195338
| Summary Table | Low Modes | |
|---|---|---|
| [[File:Benzene Frequency Summary.PNG[[ |
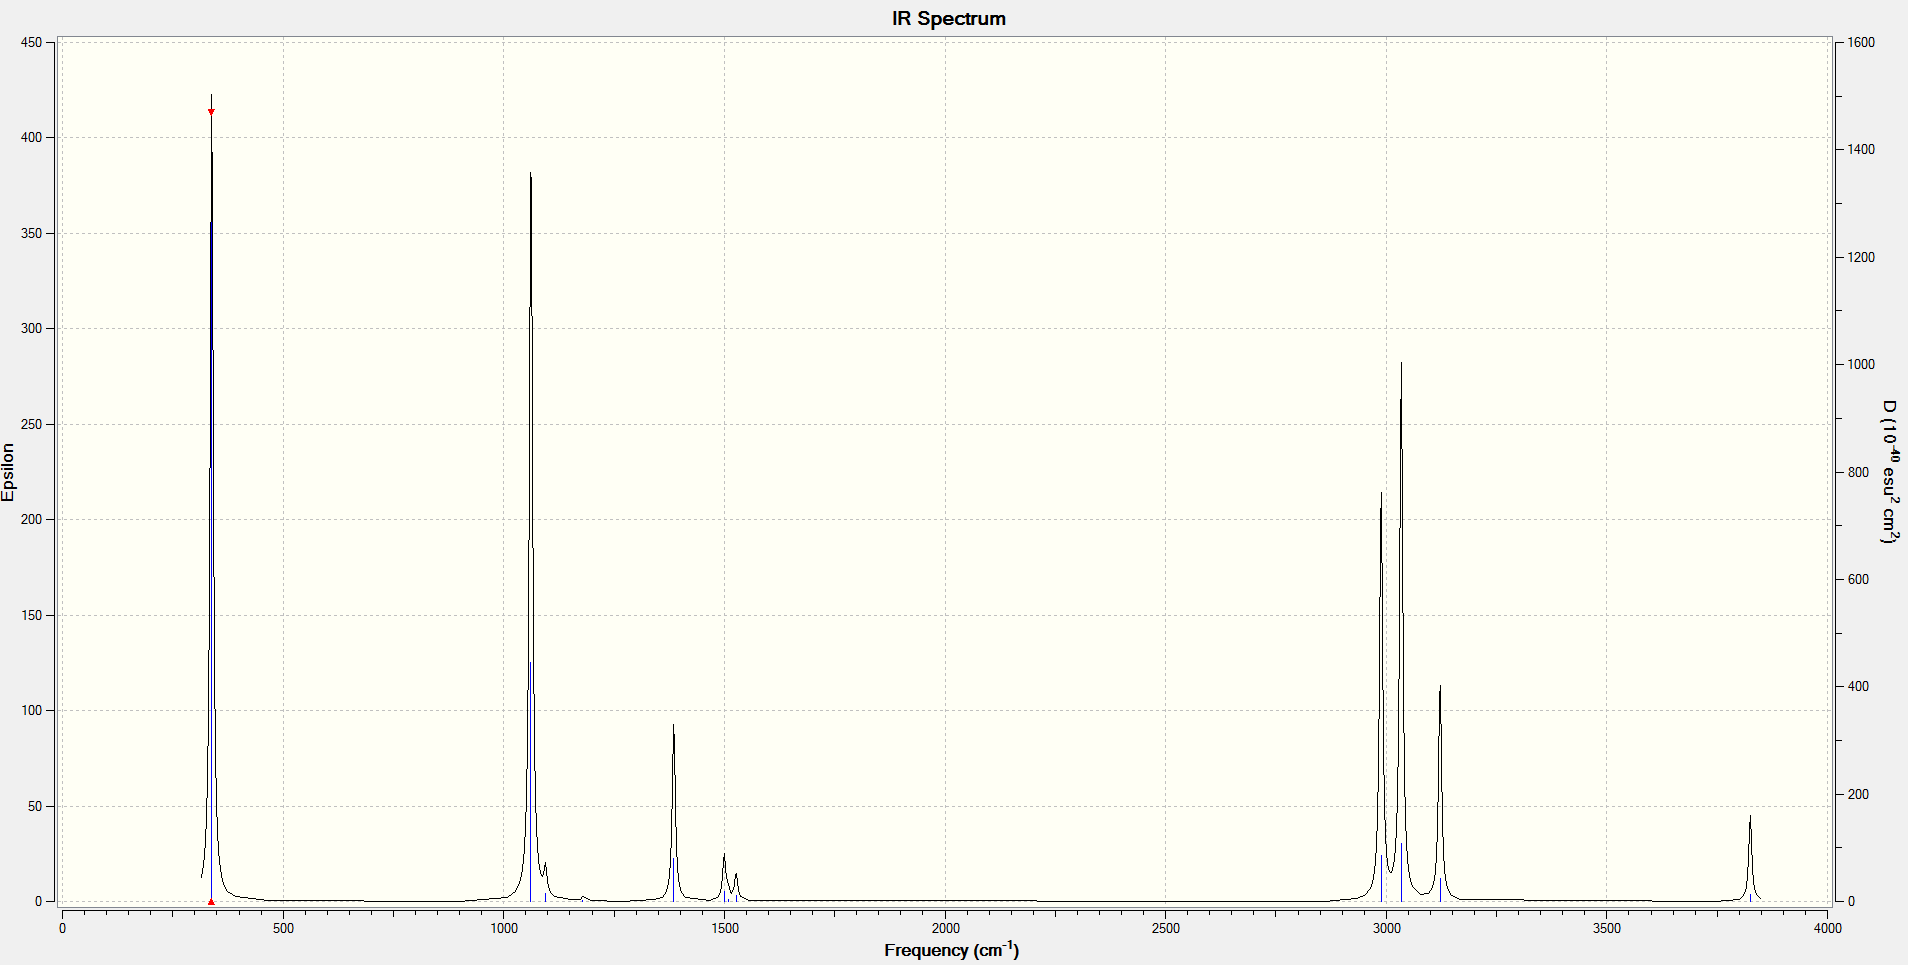
The diagram below shows the IR spectrum of the benzene molecule along with the particular vibrational frequencies.
Boratabenzene
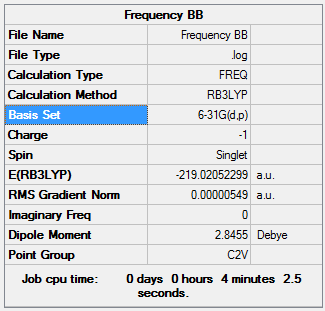
A frequency analysis was carried out on the molecule in order to obtain the symmetry labels and vibrations. It was run using a HPC with a similar basis set theory as used above.
D-log File for HPC calculation: DOI:10042/195342
| Summary Table | Low Modes | |
|---|---|---|
 |
This also allowed the IR Spectrum of the molecule to be generated
Pyridinium
A frequency analysis was carried out on the molecule in order to obtain the symmetry labels and vibrations. It was run using a HPC with a similar basis set theory as used above.
D-log File for HPC calculation: DOI:10042/195346
| Summary Table | Low Modes | |
|---|---|---|
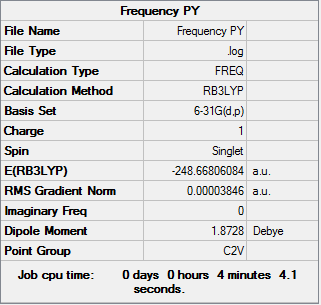 |
The IR spectrum of the molecule obtained from the frequency analysis is shown below.
Borazine
A frequency analysis was carried out on the molecule in order to obtain the symmetry labels and vibrations. It was run using a HPC with a similar basis set theory as used above.
D-log File for HPC calculation: DOI:10042/195355
| Summary Table | Low Modes |
|---|---|
 |

|
The IR spectrum of the molecule obtained from the frequency analysis is shown below.
MO Analysis
Benzene
A MO calculation and then subsequently a NBO calculation was carried out using the optimised benzene structure.
D-log File for HPC calculation :DOI:10042/195339
Once the particular orbitals are generated, the MO diagram for the central part of the benzene is generated. The MO diagram that is drawn via ChemDraw and is presented in the diagram below.
Boratabenzene
A MO calculation and then subsequently a NBO calculation was carried out using the optimised Boratabenzene structure.
D-log File for HPC calculation :DOI:10042/195343
Pyridinium
A MO calculation and then subsequently a NBO calculation was carried out using the optimised pyridinium structure.
D-log File for HPC calculation :DOI:10042/195347
The analysis of these calculations are shown in the section below.
Borazine
A MO calculation and then subsequently a NBO calculation was carried out using the optimised Borazine structure.
D-log File for HPC calculation :DOI:10042/195356
The analysis of these calculations are shown in the section below.
Once the MO calculations had been carried out for all four molecules, three separate MO's of the valence orbitals were selected.
NBO Analysis
Reference diagram for for labeling: 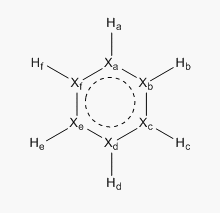
The difference in the charge distribution of each of the respective molecules can be explained via the electronegativity of the atoms present of the molecule. Electronegativity is defined as the ability of an atom to attract electrons towards itself. Thus the more electronegative an atom is, the more likely it will attract an atom hence giving it a more negative value. Using this concept in mind, the values obtained from each NBO calculations for all four molecules can be rationalised. The electronegative values of a typical carbon. nitrogen, hydrogen and boron atom are tabulated in the table below.
| Atoms | Pauling electronegativity Value |
|---|---|
| Carbon | 2.55 |
| Nitrogen | 3.04 |
| Hydrogen | 2.20 |
| Boron | 2.04 |
The first molecule that has been studied and used as a control in this experiment is the benzene molecule. A benzene molecule is essentially made up of 6 carbon atoms joined in a ring structure with one hydrogen atom attached to each of this carbon. The carbon atoms are bonded to one another via a sigma C-C bond. The carbon atom has a sp2 hybdridisation. The unhybridised p-orbital sits orthogonal to the plane and has a lone pair of electron. These lone pair of electron from all the carbon atoms are delocalised in the ring an forms the aromaticity of the molecule. Hence, the delocalisation causes an increase in the electronegativity of the carbon atom and is confirmed by the more negative value obtained in the NBO calculation is comparison with that of hydrogen. The symmetrical nature of the molecule causes the value of each of the carbon atoms and hydrogen atoms respectively to be similar.
In the second molecule, one of the carbon atom is exchanged with a boron atom. This breaks the symmetry of the molecule hence each of the carbon will have a different value depending on how far the carbon atom is situated from the boron atom. Boron atoms are generally much more electropositive than both carbon and hydrogen. Thus as a result, the most positive value would be observed by the boron atom (0.202). As noted earlier, the hydrogen atom attached to the boron atom would have a negative value as it the electrons would be more polarised towards the more electronegative hydrogen atom, hence the value -0.909. The carbon atoms in both the ortho and para positions also much more electronegative than those observed in benzene. The difference in the carbon atom is due to the resonance structure formed by pushing the formal negative charge present in the molecule. Generally, the carbon atom is bound to have the most negative value as it is the most electronegative atom present in the molecule. The hydrogen atoms that are attached to carbon atom would be less electropositive due to the similar reason as benzene.
The third molecule, pyridinium is formed by replacing one of the carbon atom in benzene with nitrogen. This also causes the symmetry of the molecule to be broken therefore affecting the distribution of the charges. As nitrogen is much more electronegative than carbon, it is not surprising to see that the nitrogen atom has the most negative value (-0.476). Therefore the hydrogen atom that is attached to this molecule would subsequently have the highest positive value as it would posses a lower electron density. This is once again proven to be right as the value of this hydrogen atom is 0.483. This value is exceptionally high but is a testament to the high electronegative nature of the nitrogen atom as shown by the Pauling Electronegativity value. The formal positive charge present on this molecule would be resonated across the ring via resonance structures. Similar to that of boratabenzene, this would lead to the formation of a positive charge on the carbon atoms in the ring. Hence, as seen from the values, the ortho and para carbons have the least negative value (-0.021 and 0.071).
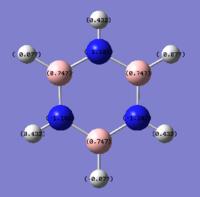
The final molecule that was investigated is the borazine. The alternating boron and nitrogen atoms help cancels out the positvie and negative charge hence giving rise to a neutral molecule. Based on similar reasoning's as above, the most negative value of on the nitrogen atom (-1.102) and the most positive is that on boron(0.747). Once again, the hydrogen atoms attached to nitrogen atoms have a very positive charge value and vice versa for the hydrogen atoms attached to the boron.
MO Comparison
COMPARISON 1
| Molecule | Benzene | Boratabenze | Pyridinium | Borazine |
|---|---|---|---|---|
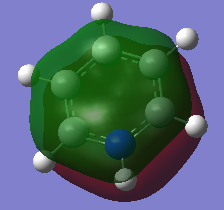
| MO | 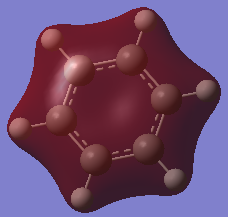 |
 |
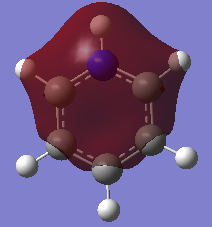 |
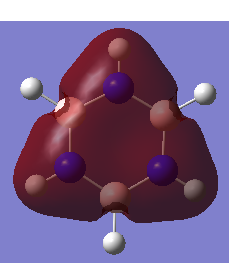
|
| Order | 7 | 7 | 7 | 7 |
| Energy(A.U) | -0.8467 | -0.6044 | -1.214 | -0.8885 |
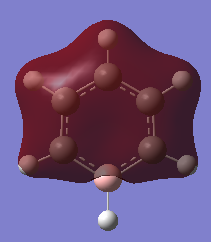
In all four molecules, the final MO diagram is made up from the s-orbitals of the respective molecules. Similar arguments used in comparison two can be used here as they are essentially the same. As this orbitals involve the s orbitals, the energy of the resulting MO's are lower than those in comparison 2.
COMPARISON 2
| Molecule | Benzene | Boratabenze | Pyridinium | Borazine |
|---|---|---|---|---|
| MO | 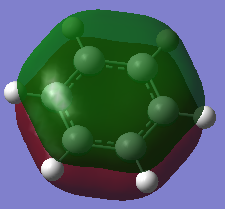 |
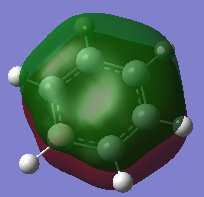 |
 |

|
| Order | 17 | 17 | 17 | 17 |
| Energy(A.U) | -0.3600 | -0.1321 | -0.6406 | -0.3613 |
This set of molecular orbitals show the pi orbitals of each of the molecules. All 6 Px- orbitals are involved in the formation of these MO's. This results in a nodal plane that cuts across the ring. The components involved in this orbitals are that of bonding. The interaction between these orbitals are via space bonding of the in phase lobes of the orbitals. The highly symmetrical nature of the benzene molecules lead to a fairly even and symmetrical sandwich orbital. In boratabenzene, the electropositive boron atom causes the electron density to shy away from it hence forming a slight dip at the boron atom. As this orbital is a combination of the carbon and boron atomic orbitals, the more electronegative carbon atom orbital would have a higher contribution towards the bonding MO whereas the boron atom would have a higher contribution towards the anti-bonding MO. This is because the relative atomic orbitals would be closer in energy towards the respective MO's. The presence of the boron atom can be said to reduce the stabilisation of the bonding orbital as the energy increases to -0.1321a.u from -0.3600 a.u (benzene). For pyridinium, the opposite effect is observed. This is because nitrogen is much more electronegative in comparison to carbon. Thus as binding orbitals are considered here, the nitrogen atomic orbital would have a higher contribution towards the final MO. This can be seen as the electron density formed surrounding the nitrogen atom is much more denser than the carbon. This also then further stabilises the bonding orbital hence reducing the energy of the orbital to -0.6406 a.u. In borazine, the MO formed is aLmost a direct reflection of that discussed in the NBO analysis. As both the atoms cancel out the effects of one another the MO obtained is somewhere in between the boratabenzene and pyridinium. This is also shown in the energy value (-0.3613) of the particular MO.
COMPARISON 3
| Molecule | Benzene | Boratabenze | Pyridinium | Borazine |
|---|---|---|---|---|
| MO | 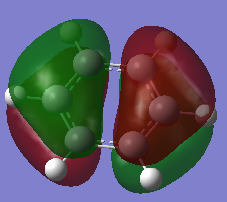 |
 |
 |
|
| Order | 21 | 21 | 20 | 21 |
| Energy(A.U) | -0.2469 | 0.011 | -0.5085 | -0.2759 |
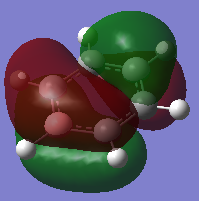
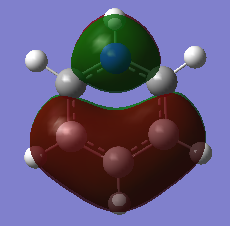
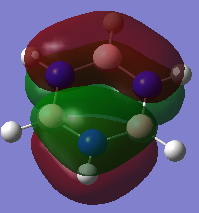
The four orbitals that are compared here are the HOMO's of each of the respective molecules except for pyridinium. For pyridinium it is the orbital that is one lower then the HOMO. The presence of a nodal in between the ring o the molecule indicates that the p orbitals are involved in the formation of this particular orbital. For benzene, based on the LCAO, the 6 of the px orbitals are once again involved in the MO. 3 of the orbitals are in-phase and the remaining 3 are out of phase. The difference in these phases gives rise to an antibonding interaction which subsequently leads to the destabilisation of the orbital. Hence this can be seen by a less negative energy value (-0.2469a.u). The replacement of one of the carbon atom with a boron atom causes a further destabilisation of the HOMO. When compared in relative to benzene, it can be said that the HOMO of the boratabenzene is that of an antibonding nature. Another reason as to why the orbitals are said to be antibonding is due to the relative contribution of the atomic orbitals that form the MO. As the more electropositive atom, it should have a lower contribution towards a bonding orbital as the energy values would be further apart. But it is the opposite in this case with the boron having a higher contribution in this particular orbital. In pyridinium, reordering has occurred. The MO that is being compared is no longer the HOMO. The nature of the orbital however is still of an antibonding nature. Using the same argument, the contribution of the nitrogen towards the MO is lesser than carbon atoms. As nitrogen is more electronegative, it should be closer in energy to that of the bonding orbital hence it should have a higher contribution. But the exact opposite was observed in this MO. In borazine, the difference in the MO distribution could be due to the arrangement of the atoms in the LCAO. As one fragments have more nitrogen then the other it would then have a lower energy thus leading to a higher contribution towards the final MO. This therefore leads to the formation of an unsymmetrical HOMO unlike the benzene.
Effects Of Substitution
The substitution of carbon atoms with either boron or nitrogen atom led to a change in the point group of the molecules.
| Molecule | Benzene | Boratabenze | Pyridinium | Borazine |
|---|---|---|---|---|
| Benzene | D6H | |||
| Boratabenze | C2V | |||
| Pyridinium | C2V | |||
| Borazine | D3H |
The changing of the point group eventually leads to the change in the symmetry labels of the respective atomic orbitals involved in the LCAO. This would eventually lead to different sets of combinations as it is a rule in the drawing of the MO diagram that only orbitals that energies that are close enough to one another and orbitals with the same symmetry labels can interact to form an MO diagram. The different combination would subsequently lead to the reordering of the MO's formed hence leading to each of the MO's having a different energy value.

