Inorganic Computational Lab Francesca Wittmann 01330365
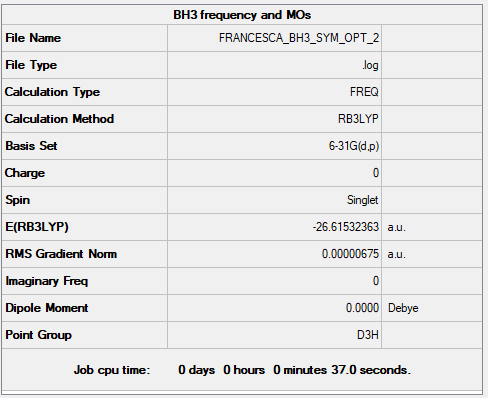
Molecule: BH3
Optimisation: B3LYP/6-31G(d.p)
        Item               Value     Threshold  Converged?
Maximum Force            0.000014     0.000450     YES
RMS     Force            0.000007     0.000300     YES
Maximum Displacement     0.000053     0.001800     YES
RMS     Displacement     0.000027     0.001200     YES
Frequency Analysis
Frequency Analysis Log File: BH3 summary file
Low frequencies --- -7.5936 -1.5614 -0.0054 0.6514 6.9319 7.1055
Low frequencies --- 1162.9677 1213.1634 1213.1661
BH3 Molecule |
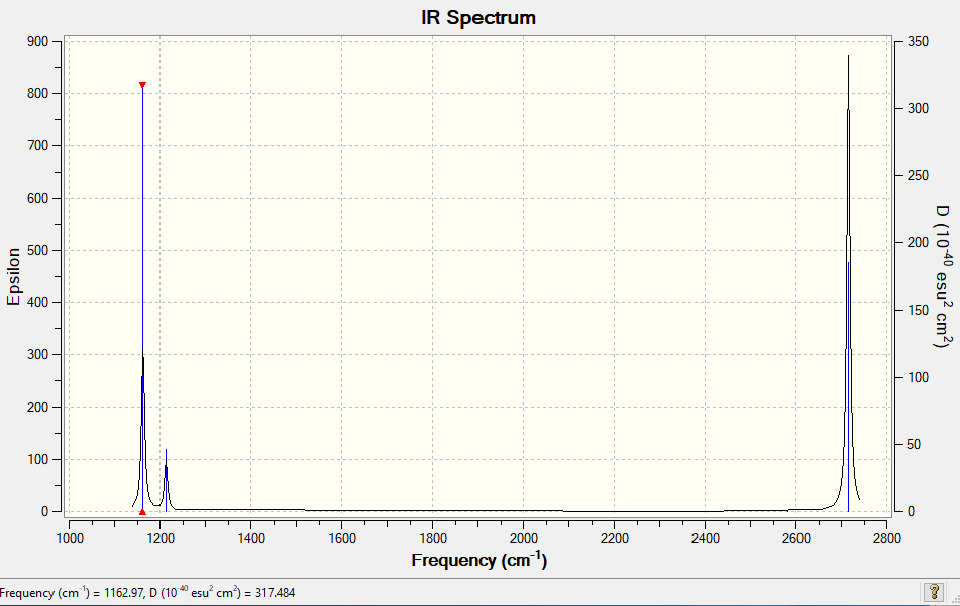
Vibrational spectrum for NH3
| wavenumber (cm-1 | Intensity (arbitrary units) | symmetry | IR active? | Type |
| 1163 | 93 | A"2 | Yes | Out-of-plane bend |
| 1213 | 14 | E' | Very slight | In-plane bend |
| 1213 | 14 | E' | Very slight | In-plane bend |
| 2582 | 0 | A1' | No | Totally symmetric stretch |
| 2716 | 126 | E' | Yes | Asymmetric stretch |
| 2716 | 126 | E' | yes | Asymmetric stretch |
Explanation of why there are not 6 peaks in the IR Spectrum: Only three peaks are observed- two strong and one weak. Two of the stretches that are IR active are degenerate therefore they vibrate at the same frequency at (2716 cm-1) and so only one peak shows ion the IR Spectrum for the two vibrations. This is the same for the two degenerate stretches at 1213 cm-1but they only give a weak peak as the stretches don't result in large changes in dipole moment. The peak at 2682 cm-1 is totally symmetric therefore it does not result in a change in dipole and so doesn't show in the IR Spectra. Therefore only 3 peaks are observed.
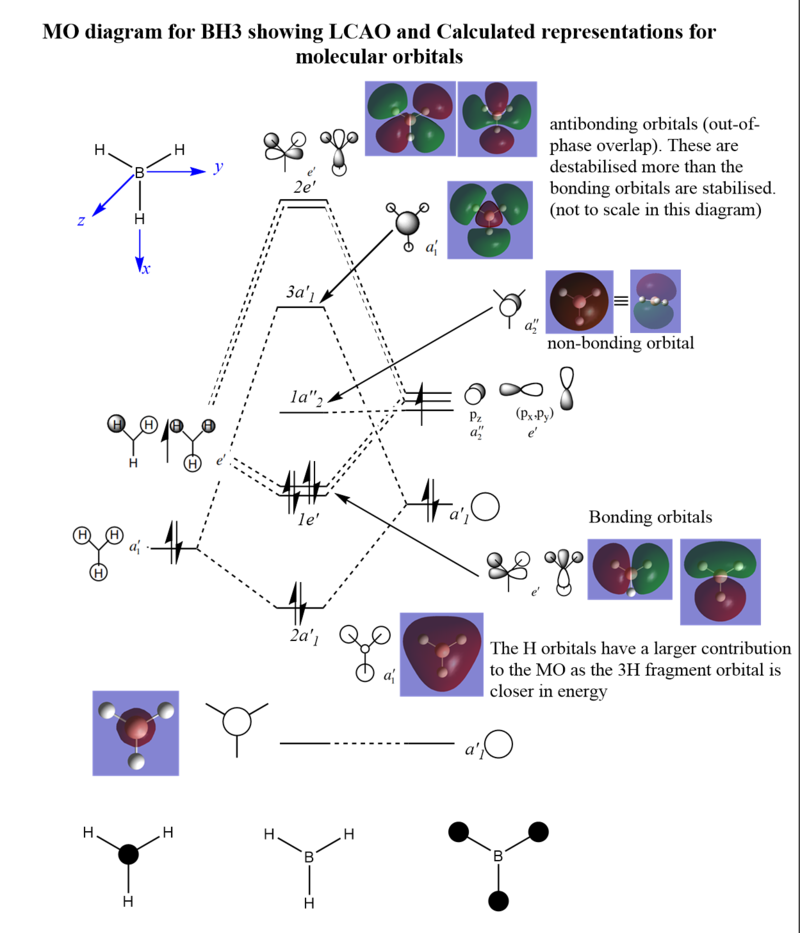
MO Diagram for BH3
Questions:
Are there significant differences between the real and predicted MO?
The calculated and LCAO MOs are very similar, there are very little differences between the two. The real MO diagrams have more diffuse individual bits of orbitals representing the full electron probability space. The computed MOs also combine the LCAOs to cover more space.
Ng611 (talk) 16:49, 13 May 2019 (BST) Good answer. Try to be more specific with your language though. For example, what exactly do you mean by more diffuse? Some additional discussion would have improved this answer.
What does this say about the accuracy and usefulness of qualitative MO theory?
LCAO representation gives an accurate prediction for real MOs (when being used on small molecules such as BH3) and so the qualitative analysis of MOs is very useful for predicting real MO distributions
Association Energies: Ammonia Borane
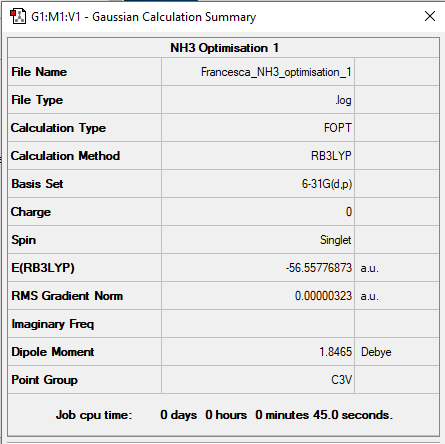
Molecule: NH3
Optimisation: B3LYP/6-31G(d.p)
        Item               Value     Threshold  Converged?
Maximum Force            0.000006     0.000450     YES
RMS     Force            0.000004     0.000300     YES
Maximum Displacement     0.000012     0.001800     YES
RMS     Displacement     0.000008     0.001200     YES
link to NH3 log file: NH3 log file
Frequency Analysis of NH3
Low frequencies ---   -0.0138   -0.0032   -0.0015    7.0783    8.0932    8.0937
Low frequencies --- 1089.3840 1693.9368 1693.9368
NH3 molecule |
NH3BH3 Molecule
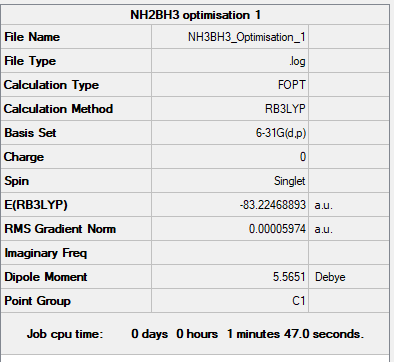
Optimisation
        Item               Value     Threshold  Converged?
Maximum Force            0.000123     0.000450     YES
RMS     Force            0.000058     0.000300     YES
Maximum Displacement     0.000515     0.001800     YES
RMS     Displacement     0.000296     0.001200     YES
link to NH3BH3 optimisation log file: NH3BH3 log file
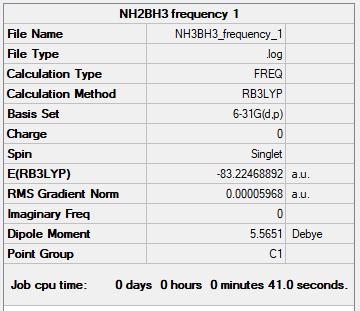
Frequency Analysis
Ng611 (talk) 16:50, 13 May 2019 (BST) Your jMol is missing here...
Low frequencies ---   -0.0014    0.0005    0.0008   16.9373   17.1786   37.4986
Low frequencies ---  265.8666  632.2086  639.3306
Link to Frequency Log File: NH3BH3 log file
Bond Energy Calculations
E(NH3)= -56.55777 Au
E(BH3)= -26.61532 Au
E(NH3BH3)= -83.22469 Au
ΔE=E(NH3BH3)-[E(NH3)+E(BH3)]
ΔE (Au)=-0.05160 Au
ΔE (kJ/mol)= 135 kJ/mol
(1 au= 2625.5 kJ/mol)
This is a sensible value as it is on the scale of most other covalent bonds. It is also reasonable as it is less than most bonds which is in line with the theory that the N-B dative bond should be weaker than most covalent bonds.
Strength of the Bond: The dative covalent bond is a weak bond. 135 kJ/mol is far less than for what is considered a strong bond such as C=O which has a bond strength of 800 kJ/mol and is even far less than medium bond strengths such as C-C single bond which has an energy of 346 kJ/mol.
Ng611 (talk) 16:51, 13 May 2019 (BST) Remember to cite the source you obtained your bond enthalpies from.
(energies in Au to 5 decimal points, in kJ/mol to integers, frequencies to integers, NBO as reported)
Pseudo-Potentials: NI3
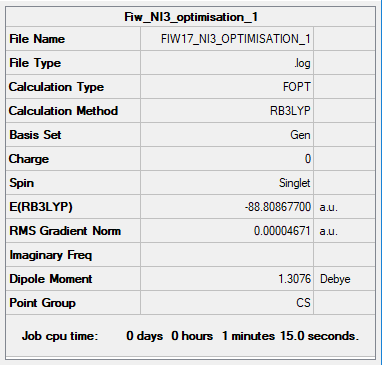
Optimisation
        Item               Value     Threshold  Converged?
Maximum Force            0.000061     0.000450     YES
RMS     Force            0.000037     0.000300     YES
Maximum Displacement     0.000459     0.001800     YES
RMS     Displacement     0.000285     0.001200     YES
Link to Optimisation File:NI3 Log File
OPTIMISED N-I BOND LENGTH= 2.18 Å
Optimised NI3 |
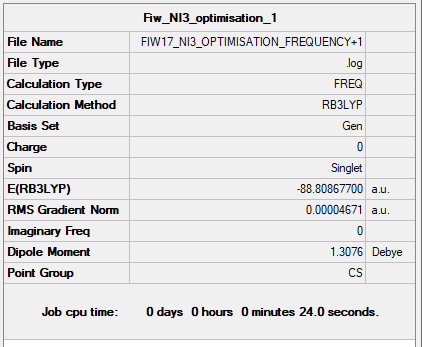
Frequency Analysis
        Item               Value     Threshold  Converged?
Maximum Force            0.000061     0.000450     YES
RMS     Force            0.000037     0.000300     YES
Maximum Displacement     0.000731     0.001800     YES
RMS     Displacement     0.000357     0.001200     YES
Low frequencies ---   -5.5593   -5.4903   -0.0004   -0.0004   -0.0001    6.5126
Low frequencies ---  101.1566  101.2827  148.4563
Link to Frequency File: NI3 Frequency Log File
Mini-Project: Ionic Liquids
Ionic liquids are liquids comprised of only ions (bulky ions such as [N(CH3)4]+ and [P(CH3)4]+). These liquids have low melting points and a range of useful properties and applications. Therefore the study of these liquids is of great importance. The ions that make up the liquids can be studied computationally. In this project, the structures, frequencies, charge distributions and molecular orbitals of [N(CH3)4] and [P(CH3)4]+) are analysed using computational chemistry.
Optimisations and Frequency Analysis NH3
        Item               Value     Threshold  Converged?
Maximum Force            0.000073     0.000450     YES
RMS     Force            0.000018     0.000300     YES
Maximum Displacement     0.000276     0.001800     YES
RMS     Displacement     0.000087     0.001200     YES
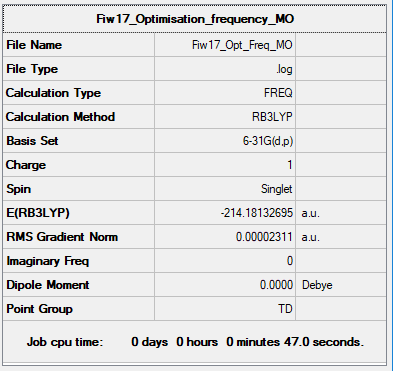
Link to log file: Optimisation and Frequency Summary
Low frequencies ---    0.0004    0.0006    0.0009   35.6277   35.6277   35.6277
Low frequencies ---  215.5223  315.1219  315.1219
[N(CH3)4]+ |
Optimisation and Frequency Analysis for Phosphorus
Optimisation
        Item               Value     Threshold  Converged?
Maximum Force            0.000073     0.000450     YES
RMS     Force            0.000018     0.000300     YES
Maximum Displacement     0.000276     0.001800     YES
RMS     Displacement     0.000087     0.001200     YES
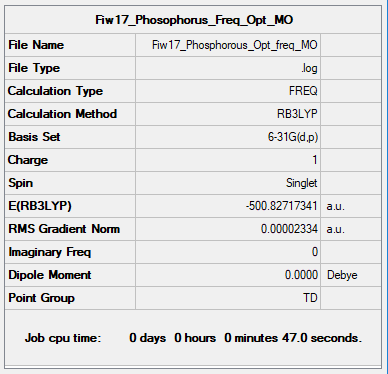
Link to log file: Phosphorus Log File
Frequencies
Low frequencies ---    0.0004    0.0006    0.0009   35.6277   35.6277   35.6277
Low frequencies ---  215.5223  315.1219  315.1219
Charge Comparison of [N(CH3)4]+ and [P(CH3)4]+
Ng611 (talk) 16:57, 13 May 2019 (BST) Looks like you've not scaled your colour ranges accurately...
[N(CH3)4]+
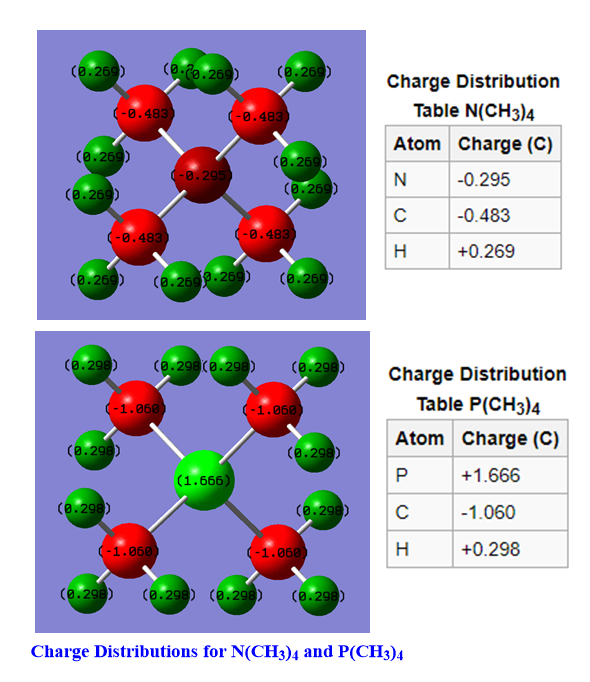
The formal assignment of charge using VSEPR and hybridization theory assigns the positive charge to be on the central nitrogen atom. As can be seen from the above diagram, the Nitrogen does not have a +1 charge. In fact, it is negatively charge indicating that hybridisation theory is inaccurate. Nitrogen is electronegative and hence attracting electrons giving it a negative electron density. The positive charge is instead distributed to the periphery hydrogens allowing for the positive charge to be more diffuse over the whole molecule.
Ng611 (talk) 17:00, 13 May 2019 (BST) I would also add some discussion about the effect of symmetry on charge distribution.
[P(CH3)4]+
The positive charge is formally on the phosphorus atom. Unlike with N(CH3)4 , the charge distribution calculations support the formal assignment in part. However, in the calculation the phosphorus is even more positively charged than the +1 in the formal assignment, with a distribution of +1.666 C. This is because phosphorus is highly electropositive compared to the carbons it is bonded to. Therefore, charge density is pulled away from the phosphorus onto the carbons giving the central phosphorous a highly positive charge density. There is also positive charge on the periphery hydrogens.
Traditional View of [N(R)4]+
Using VSEPR and hybridization theory, the formal assignment of charge is that the central nitrogen has a +1 charge. This is calculated by counting all of the bonding pairs of electrons attached to the nitrogen and then dividing by 2-(8/2=4). Nitrogen has 5 valence electrons so if there are only 4 surrounding electrons then the nitrogen is assigned a positive charge. The calculations of charge distribution show that the positive charge is actually located on the periphery hydrogens (each with a charge distribution of +0.269) and the central nitrogen is actually negatively charged.
Molecular Orbital Analysis of [N(CH3)4]+
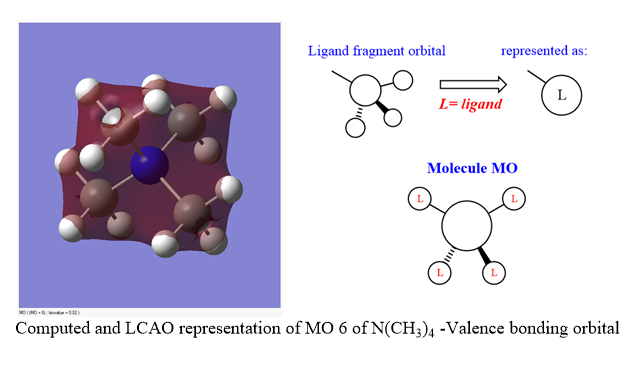
All of the occupied and 5 of the lowest non occupied molecular orbitals for [N(CH3)4]+ were calculated and visualised. 3 valence MOs (bonding and anti-bonding) for this molecule are presented and analysed using LCAO analogues below:
Ng611 (talk) 17:02, 13 May 2019 (BST) Nice orbital analysis! Remember to label the relevant orbital interactions as well.
Additional-Areas of Interest from this Project
I found having to work through the MOs and comparing them to the LCAOs for BH3 and the larger ions was really interesting as I have only done this before from the examples in the lecture courses with Dr Hunt. I found it quite rewarding to be able to work through these from scratch and feel I have a much better grasp of the MO theory from the lectures that we did last term having completed this lab.

