InorganicGaussian 01327311
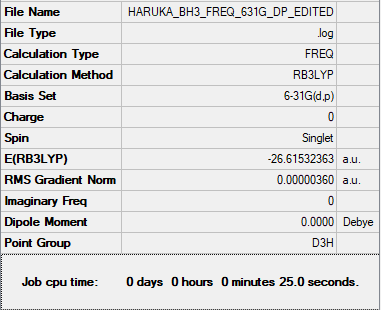
BH3 Molecule
Optimisation
RB3LYP/6-31G(d,p) level
Item               Value     Threshold  Converged?
Maximum Force            0.000004     0.000450     YES
RMS     Force            0.000003     0.000300     YES
Maximum Displacement     0.000017     0.001800     YES
RMS     Displacement     0.000011     0.001200     YES
Frequency analysis log file Media:HARUKA BH3 FREQ 631G DP EDITED.LOG
Low frequencies ---   -1.1800   -1.0028   -0.0055    4.1927   11.0182   11.0637
Low frequencies --- 1162.9912 1213.1792 1213.1819
optimised BH3 molecule |
Comparison of MO diagrams: Gaussian vs LCAO
Energy splitting between 2a’ and 1e’ is expected to be larger than the splitting between 1e’ and 1a2" (ΔE2a’ - 1e’ > ΔE1e’ - 1a2") from observation of MO diagram produced from LCAO (Linear Combination of Atomic Orbitals). However energy calculations of MOs on Gaussian indicates the opposite: 1e' and 1a2" has a larger splitting of 0.28474 au compared to 0.16175 au between 2a’ and 1e’. The AO or FO that is closer to the bonding/anti-bonding MO of concern has a dominant contribution to the MO. Therefore, we would expect from the diagram that the dominant contribution to the 3a1’' MO is from the B2s that is closer to it energetically than the a1’ H3 FO. However, it can be observed from the MO picture taken from gaussian that the lobes are larger on the H atoms (green) rather than B (red).
These two differences given above indicate the flaw of the LCAO theory that the energy positioning of the AOs and FOs are merely qualitative. The energetic similarity or dissimilarity between FOs determine the magnitude of energy splitting between the bonding and antibonding MOs, as well as the dominant contribution to the MO. Therefore qualitative energy positioning of the FOs likewise implies only a vague understanding of these MO properties. Calculations must be done to accurately determine the energy positioning of the orbital.
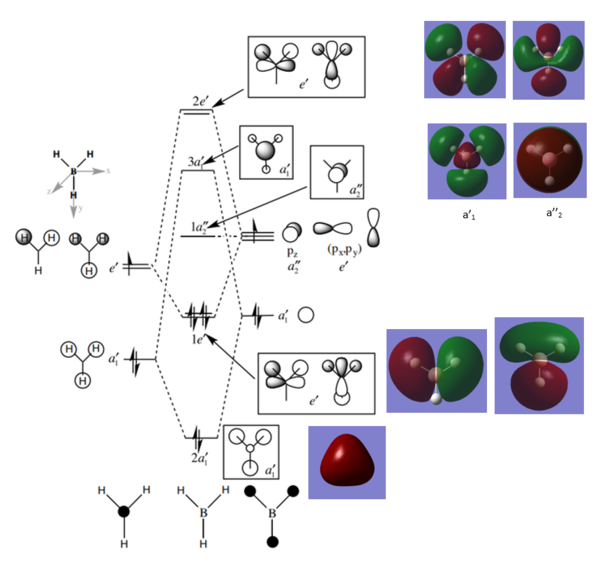
Thorough answer and excellent thought given to both the similarities and differences between the calculated and LCAO MOs. To improve, just note that a better comparison would be to consider the splitting between the bonding and anti-bonding MOs (e.g. 2a1' and 3a1') which form on the combination of the FOs/AOs. This is because you actually try to estimate the size of this splitting when you construct your LCAO diagram. Whereas, the actual magnitude of the gap between other unrelated MOs (e.g. 1e' and 1a2") isn't always specifically predicted, although the energy ordering is, as you mention. Overall, great detail and answer though! Smf115 (talk) 06:14, 30 May 2019 (BST)
IR analysis
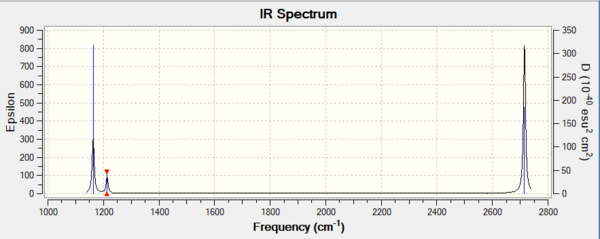
| Wavenumber (cm-1 | Intensity (au) | Vibrational mode | Symmetry | IR activity |
|---|---|---|---|---|
| 1163 | 93 | out of plane bend | A2" | active |
| 1213 | 14 | in plane asymmetric bend | E' | active |
| 1213 | 14 | in plane asymmetric bend | E' | active |
| 2582 | 0 | in plane symmetric stretch | A1' | inactive |
| 2715 | 126 | in plane asymmetric stretch | E' | active |
| 2715 | 126 | in plane asymmetric stretch | E' | active |
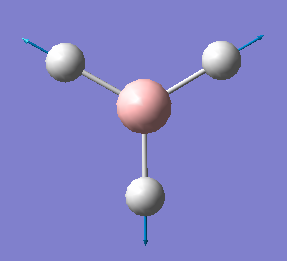
Why do we only see 4 peaks when there are 6 vibrational modes? From the table above, we see 6 vibrational modes as expected from the 3N-6 rule. However, only 4 peaks are seen on the IR as modes 2 and 3, and 4 and 5 are degenerate which leaves 5 distinguishable vibrational modes. Mode 4 (2582.29 cm-1) is non-existent from the IR spectrum as the symmetric B-H stretch does not result in a dipole change as seen from the displacement vectors.
Good identification of both reasons which lead to only 3 visible peaks, think you made a slight error though in stating it leaves 5 distinguishable vibrational modes when you meant 4. Smf115 (talk) 06:20, 30 May 2019 (BST)
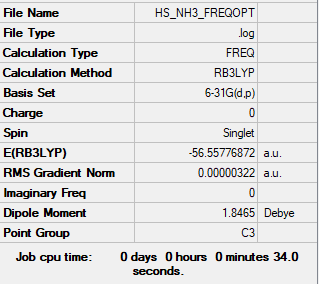
NH3
Optimisation
RB3LYP/6-31G(d,p) level
Item               Value     Threshold  Converged?
Maximum Force            0.000006     0.000450     YES
RMS     Force            0.000004     0.000300     YES
Maximum Displacement     0.000016     0.001800     YES
RMS     Displacement     0.000011     0.001200     YES
Frequency analysis log file Media:HS NH3 FREQOPT.LOG
Low frequencies ---   -0.0137   -0.0027    0.0007    7.0783    8.0932    8.0937
Low frequencies --- 1089.3840 1693.9368 1693.9368
optimised NH3 molecule |
NH3BH3
Optimisation
RB3LYP/6-31G(d,p) level
Item               Value     Threshold  Converged?
Maximum Force            0.000233     0.000450     YES
RMS     Force            0.000083     0.000300     YES
Maximum Displacement     0.000981     0.001800     YES
RMS     Displacement     0.000369     0.001200     YES
Frequency analysis log file Media:HS NH3BH3 OPT.LOG
Low frequencies ---   -0.0329   -0.0117   -0.0055   10.3790   10.3868   38.9662
Low frequencies ---  265.6129  634.4283  639.2421
optimised NH3BH3 molecule |
Dissociation energy analysis
E(NH3)= -56.55777 au
E(BH3)= -26.61532364 au
E(NH3BH3)= -83.22468857 au
ΔE=E(NH3BH3)-[E(NH3)+E(BH3)]= (-83.22469 au) - [(-56.55777 au) + (-26.61532 au)]=-0.05160 au=-135.47580 kJ mol-1
The N-B dative bond (135 kJ mol-1) is weaker compared to a B-B single covalent bond (293 kJ mol-1) and even the N-N bond (167 kJ mol-1). The weaker bond strength of N-B is due to the energy mismatch between the sp3 hybrids of B and N to make the single bond. N is more electronegative than B making their sp3 orbitals much more tightly bound to the N centre, hence decreasing the extent of overlap with B. The N-N bond is significantly weaker than the B-B bond despite both being a homonuclear bond due to the the lone pair repulsion of the closely residing lone pairs on N. This effect is absent for B-B.
NI3
Optimisation
RB3LYP/GEN
need input file
         Item               Value     Threshold  Converged?
 Maximum Force            0.000096     0.000450     YES
 RMS     Force            0.000050     0.000300     YES
 Maximum Displacement     0.001084     0.001800     YES
 RMS     Displacement     0.000616     0.001200     YES
Frequency analysis log file Media:HS NI3 GENOPT 3V FREQ.LOG
Low frequencies ---  -12.7232  -12.7172   -6.4215   -0.0039    0.0189    0.0620
Low frequencies ---  101.0767  101.0775  147.4581
optimised NI3 molecule |
Bond length of N—I was found to be 2.18404Å. Notice that it is substantially longer than the bond length of N—H (1.01798Å). This is due to the much diffuse orbital of the iodine atom, as it is from period 5.
Excellent first section with great thought given to your answers! Just watch your accuracies when reporting bond lengths (3 d.p.) and any literature values used need corresponding references. Smf115 (talk) 06:25, 30 May 2019 (BST)
Mini Project: Ionic Liquids
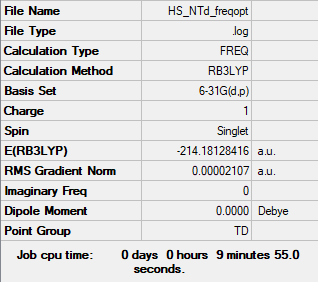
Optimisation of [N(CH3)4]+
B3LYP/6-31G(d,p) level
Item               Value     Threshold  Converged?
Maximum Force            0.000067     0.000450     YES
RMS     Force            0.000017     0.000300     YES
Maximum Displacement     0.000252     0.001800     YES
RMS     Displacement     0.000081     0.001200     YES
Frequency analysis log file Media:HS NTD FREQOPT MO.LOG
Low frequencies ---   -0.0010   -0.0009   -0.0004   22.7104   22.7104   22.7104
Low frequencies ---  189.1568  292.9980  292.9980
Optimised N complex |
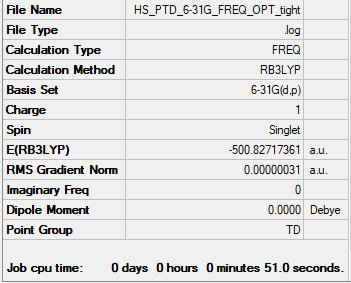
Optimisation of [P(CH3)4]+
RB3LYP/6-31G(d,p) level
Item               Value     Threshold  Converged?
Maximum Force            0.000048     0.000450     YES
RMS     Force            0.000016     0.000300     YES
Maximum Displacement     0.000256     0.001800     YES
RMS     Displacement     0.000162     0.001200     YES
Frequency analysis log file Media:HS PTD 6-31G FREQ OPT TIGHT.LOG
Low frequencies ---   -0.0022   -0.0016    0.0030   50.8737   50.8737   50.8738
Low frequencies ---  187.9725  213.0220  213.0220
Note that the low frequencies list a range of over ±20~30 cm-1. To improve the accuracy of the optimisation, a tight optimisation was done, however yielded the same results. Please refer to Fredrick (Monday demonstrator) for clarification if needed.
Optimised P complex |
Charge analysis of [N(CH3)4]+ and [P(CH3)4]+ complex
The charge analysis was done with a fixed colour range of 1.667 (green) to -1.060 (red) for both molecules. These values are the charge extremes of the P complex and were used as the values to fix the colour range for both molecules for two reasons: to normalise the charge comparisons for the two molecules by colour, and to maximise the colour gradient between the charges.

| Atom | Charge |
|---|---|
| N | -0.295 |
| C | -0.485 |
| H | 0.269 |
| Atom | Charge |
|---|---|
| P | 1.667 |
| C | -1.060 |
| H | 0.298 |
It can be seen from the diagrams that [P(CH3)4]+ (right) has a significantly greater charge disparity between the central metal ion and the rest of the complex. P has a charge of 1.667 as compared to -0.295 on N. This can be attributed to the electronegativity differences with the directly bonded C atom. C atom's electronegativity (2.5) is less than the electronegativity of N (3.0).[2] This means that the C-N bond will be negatively polarised towards the N atom resulting in the negative charge of the N central atom. In contrast, P has a lower electronegativity (2.2) than C atom, hence resulting in the positive polarisation towards the P centre. Nitrogen has a greater stabilisation ability of negative charges from its energetically low lying orbitals, that P lacks being in period 3.
It is interesting to see that despite C-P has a smaller electronegativity difference compared to C-N, it has a greater polarisation than the [N(CH3)4]+ complex. This is explained by the greater degree of polarisation for the longer M-L bond (metal-ligand) is supported by the longer bond length of P-Me (1.817Å) than N-Me (1.510Å).
Good presentation of the NBO charges and a good comparison of the relative charge distributions. The use of referenced electronegativities is good and you raise other ideas such as the energy levels of the orbitals. To improve, this idea could be expanded on a little more and maybe could have been linked to the comparison of the bond lengths. It would have also been good to see some thought given to the relative charges on the H atoms. Smf115 (talk) 12:32, 30 May 2019 (BST)
Formal Charge analysis for [N(CH3)4]+
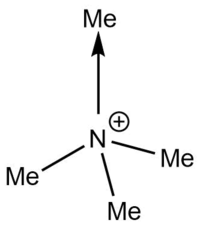
What does the "formal" positive charge on the N represent in the traditional picture? On what atoms is the positive charge actually located for this cation?
In the traditional picture the formal charge (+) is shown to be singularly located on the N atom. This means that the positive charge on the N atom is solely responsible for the +1 charge of the cation. The formal charges can be understood when a Lewis dot structure is drawn for the complex. The dative bond from the N centre to one of the methyl ligand causes the formal charge to reside on the N.
However from the charge analysis above, we see that the positive charge does not actually reside on the N or the C atom, but rather the H atoms around the periphery of the complex. This indicates that the positive charge is spread around the whole ion. In contrast, the positive charge is concentrated on the P centre for the [P(CH3)4]+ complex. The charge distribution is an important aspect to consider when assessing the viscosity of a liquid crystal. [3] Complexes with a diffuse charge distribution such as [N(CH3)4]+ would interact through attractive coulombic interactions between its counter-ion making it hard for ions to flow past each other smoothly. In contrast, because the positive charge on the [P(CH3)4]+ complex strongly resides on the central atom, the counter-anion is sterically more hindered to interact with the positive centre, therefore making it less viscous.
Good identification of where the positive charge actually lies and comparison back to [P(CH3)4]+. Your discussion of how the formal charge arises could be improved by considering formal electron counting. Nice additional information linking to the viscosity of the compounds. Smf115 (talk) 12:34, 30 May 2019 (BST)
LCAO diagram of occupied MOs
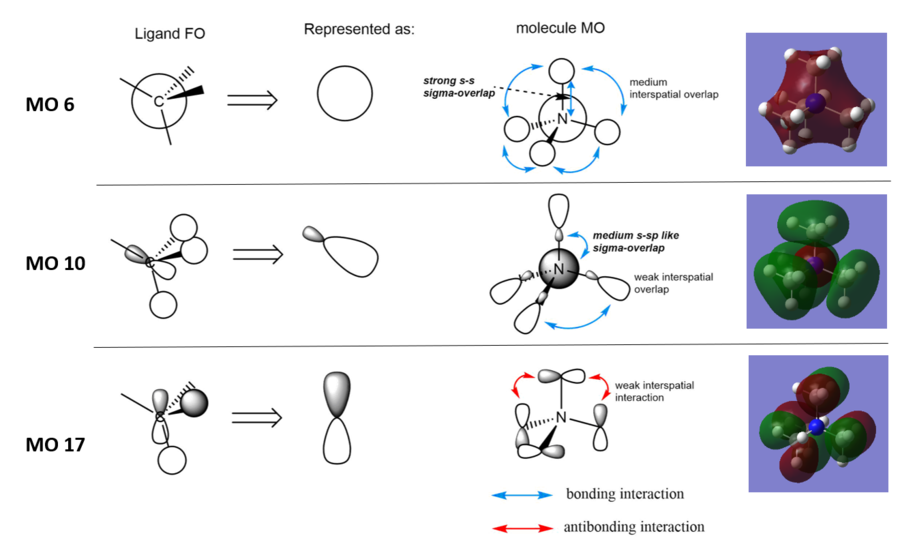
MO 6 Completely bonding character
There are only bonding interactions as the whole complex is in one phase. The lack of orbital contribution from the H atoms in the methyl ligands prevents electron density being around the periphery of the complex as seen in the image from Gaussian. The complex becomes more diffuse compared to MO6 indicating the overlap between 2s orbitals of C and N atom, not 1s orbitals.
MO 10 Bonding character
There are interspatial bonding interactions between the ligand FOs of dominant phases. However this interaction is weak as the interacting lobes are far away, directional from its p-like FO hence decreasing the extent on overlap. Nevertheless it contributes to the bonding character of the complex. Combined with this, there is another bonding interaction between the smaller lobe of the ligand FO and the N orbital. Although the electron density in this lobe is small, it points straight towards the N centre making it a sigma head on overlap. It has a smaller bonding contribution than the sigma-overlap in MO 6. s-s overlap is significantly stronger than s and sp-like orbital interaction.
MO 17 Considerable anti-bonding character
There are interspatial antibonding interactions between the ligand FOs that creates a node between adjacent ligands. Although the overlap and directionality of the simplified p-like ligand FOs make these interactions individually weak, combined, they have a significant effect on the destabilisation of the MO. There is also an angular node in the ligand that doesn’t contribute to the bonding character of between the ligand FOs. For these reasons, the bonding character of the ligands are decreased and the energy of the MO is raised.
You've chosen a nice range of MOs and presented them clearly. A good attempt at constructing the FOs but not fully correct and some main points have been missed when analysing the character. In particular, you should have considered the BH3 MO diagram when constructing the FO for MO10 which is incorrect and thus, the evaluation of it's overall character is too. Smf115 (talk) 12:40, 30 May 2019 (BST)
Overall, a good report with an excellent first section and correct structure calculations throughout. Smf115 (talk) 12:42, 30 May 2019 (BST)
References
- ↑ Hunt, T. BH3 MO diagram.
- ↑ Wired Chemist. http://www.wiredchemist.com/chemistry/data/bond_energies_lengths.html (accessed May 17, 2019).
- ↑ Aslanov, L. Journal of Molecular Liquids 2011, 162 (3), 101–104.

